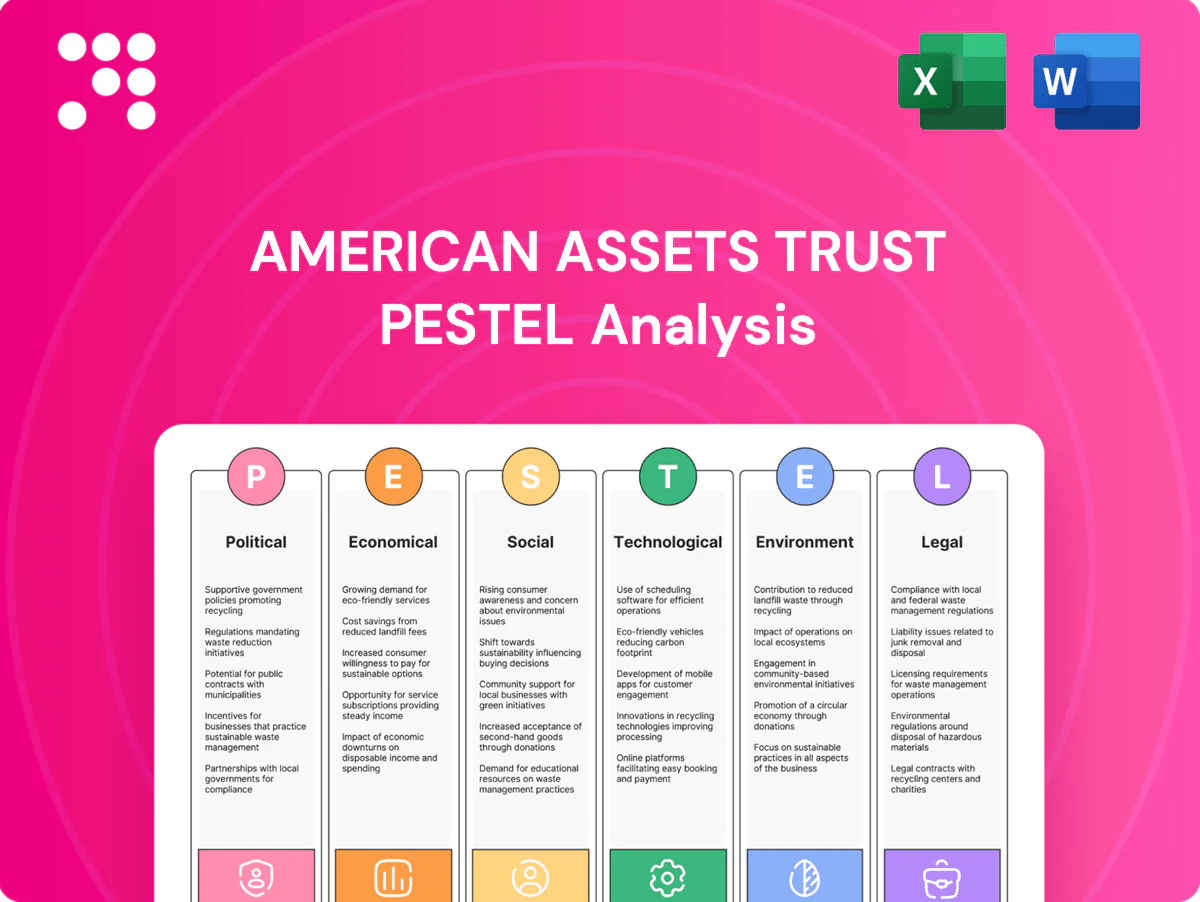
American Assets Trust PESTLE Analysis

Plan Smarter. Present Sharper. Compete Stronger.
Unlock strategic clarity with our PESTLE analysis of American Assets Trust—three concise sections reveal the political, economic, social, technological, legal, and environmental forces shaping its outlook. Ideal for investors and strategists seeking edge. Purchase the full report to access detailed, actionable insights and ready-to-use templates.
Political factors

Local zoning and entitlements
Entitlement timelines—commonly 12–36 months on the West Coast and 24–48 months in Hawaii—plus community hearings and zoning variances routinely delay development starts and cap supply. Shifts in city council leadership can pivot priorities between growth and preservation, altering project feasibility. Proactive stakeholder engagement has been shown to reduce entitlement delays and conditions, and greater entitlement certainty improves underwriting and capex phasing.
State and municipal tax policy
California Proposition 13 sets a 1% base property tax with assessed value increases capped at 2% annually, a material driver of American Assets Trust NOI in California markets. City transfer taxes, such as San Francisco’s tiered levy reaching up to 3% on very high‑value sales, and proposed vacancy taxes in places like Portland can compress NOI. Incentives for mixed‑use or transit‑oriented projects (tax abatements, fee waivers) can offset carrying costs. Tracking city and state legislative calendars and ballot initiatives is essential to anticipate NOI shifts.

Infrastructure and transit funding
Public investment in transit corridors—backed by the 2021 Bipartisan Infrastructure Law's roughly $550 billion in new spending and regional plans like LA Measure M (~$120 billion over 40 years)—boosts foot traffic and office appeal, improving leasing velocity and rents.
Delays or cancellations (eg. multiyear cost overruns on LA Purple Line extensions) can undermine leasing assumptions and valuation models.
Participation in business improvement districts raises near‑term assessments but often increases asset values; site selection should track funded infrastructure pipelines.

Tourism and military presence policy
Hawaii tourism and federal military basing materially shape retail and residential demand in island submarkets; Hawaii received about 8.7 million visitors in 2023, driving transient retail and short-term rental demand, while DoD funding (US defense budget ~858 billion for FY2024) supports 100,000+ local military-linked households and contractors. Visa, travel and quarantine rule shifts can swing tourist flows quarter-to-quarter. Diversification across nodes reduces policy concentration risk.
- Tourism: 8.7M visitors (2023)
- Defense: US FY2024 budget ~858B
- Local impact: 100k+ military households
- Risk mitigation: geographic diversification
Disaster preparedness funding
- Federal grants: FEMA BRIC/HMGP > $2.5B since 2020
- Impact: reduces capex payback timelines for coastal hardening
- Variation: state prioritization drives geographic funding disparities
- Requirement: compliance, BCA, and grant-timing coordination
Entitlement delays curb coastal supply; Prop13, taxes compress CA NOI; BIL/FEMA cut capex
Entitlement timelines (12–36 months West Coast; 24–48 Hawaii) and council shifts delay projects and cap supply. Prop 13 (1% base, 2% cap) materially shapes CA NOI; local transfer/vacancy taxes pressure returns. BIL (~$550B) and transit boosts leasing; FEMA BRIC/HMGP (> $2.5B since 2020) reduces hardening capex.
| Metric | Value |
|---|---|
| Entitlement | 12–48m |
| Prop 13 | 1%/2% cap |
| BIL | $550B |
| FEMA BRIC/HMGP | >$2.5B |
| Hawaii tourism (2023) | 8.7M |
| US defense FY2024 | $858B |
What is included in the product
 Detailed Word Document
Explores how external macro-environmental factors uniquely affect American Assets Trust across Political, Economic, Social, Technological, Environmental, and Legal dimensions, with each section backed by current data and trends to highlight threats and opportunities. Designed for executives, investors, and strategists, the analysis includes forward-looking insights and examples specific to the REIT’s markets and operations.

 Customizable Excel Spreadsheet
A concise, visually segmented PESTLE summary of American Assets Trust that’s easily dropped into presentations or shared across teams, enabling quick alignment on external risks, market positioning, and customizable notes for regional or business‑line context.
Economic factors

Interest rates and cap rates
Federal Reserve policy (federal funds 5.25–5.50% and 10‑yr Treasury ~4.4% in mid‑2025) raises REIT cost of capital, squeezing acquisition and development yields and slowing deal flow. A roughly 100 bps cap‑rate expansion versus 2021 levels has meaningfully compressed NAV and can stall dispositions. Fixed‑rate debt ladders and opportunistic refinancing mitigate spread risk. Market beta remains elevated in supply‑constrained coastal metros where vacancy rates often sit below 6%.
Office demand and hybrid work
Office leasing velocity slowed ~20% YoY in 2024 while Kastle’s Return‑to‑Work sat near 52%, pushing TI packages for trophy assets to ~$50–80/sqft and free‑rent concessions of roughly 3–6 months in many markets; high‑quality, amenity‑rich space still clears but secondary inventory lags, so apply conservative renewal probabilities (~50%) and longer downtime; AAT’s residential/retail mix cushions cash‑flow volatility.

Retail sales and tenant health
Experiential and necessity-based retail in coastal centers have outperformed pure apparel, aligning with broader U.S. trends after retail and food services sales hit about 6.3 trillion in 2023 (U.S. Census). Tenant credit dispersion demands vigilant watchlists and co-tenancy clauses as weaker apparel credits persist. Sales-to-rent ratios (commonly 4–6x or higher) guide sustainable occupancy costs, while strong anchors stabilize small-shop leasing and remerchandising.

Housing affordability and rent growth
West Coast housing affordability constraints have capped rent growth to low single digits year‑over‑year through 2024, increasing regulatory scrutiny in California and Oregon, while sunbelt metros (Phoenix, Austin, Dallas) recorded mid‑single‑digit rent gains driven by in‑migration. Supply constraints in infill coastal and transit‑oriented submarkets have supported stabilized occupancy near 94–96% per 2024 industry data. American Assets Trusts portfolio mix of workforce and Class A assets across West Coast and sunbelt markets helps balance exposure to slowing coastal rent growth and stronger sunbelt demand.
- West Coast: low single‑digit rent growth Y/Y (2024)
- Sunbelt: mid‑single‑digit gains, driven by in‑migration
- Occupancy: ~94–96% in infill/transit submarkets (2024)
- Portfolio: workforce + Class A mix reduces concentration risk
Construction costs and labor
Material inflation ran near 5% in 2024 and combined with union labor tightness — extending schedules by an estimated 10–20% — elongates American Assets Trust development timelines; guaranteed maximum price contracts cap overruns but constrain design flexibility.
- Value engineering: preserves margins
- Phased delivery: accelerates cash flow
- GMP: volatility control vs flexibility loss
- Coastal contingency: 10–15% buffers recommended
Entitlement delays curb coastal supply; Prop13, taxes compress CA NOI; BIL/FEMA cut capex
Higher policy rates (fed funds 5.25–5.50%, 10‑yr ~4.4% mid‑2025) and ~100 bps cap‑rate expansion since 2021 raise REIT cost of capital and compress NAV; 2024 inflation ~5% and material/labor tightness lengthen development by ~10–20%. Occupancy in infill/transit submarkets near 94–96% (2024); West Coast rent growth low single‑digit, sunbelt mid single‑digit (2024).
| Metric | Value | Year |
|---|---|---|
| Federal funds | 5.25–5.50% | Mid‑2025 |
| 10‑yr Treasury | ~4.4% | Mid‑2025 |
| Inflation (CPI) | ~5% | 2024 |
| Cap‑rate change vs 2021 | ~+100 bps | 2021–2025 |
| Occupancy (infill) | 94–96% | 2024 |
| Rent growth West Coast | Low single‑digit | 2024 |
| Rent growth Sunbelt | Mid single‑digit | 2024 |
What You See Is What You Get
American Assets Trust PESTLE Analysis
The American Assets Trust PESTLE Analysis examines political, economic, social, technological, legal and environmental factors affecting the company's strategy and portfolio performance. It highlights key risks, opportunities and actionable implications for investors and managers. The preview shown here is the exact document you’ll receive after purchase—fully formatted and ready to use.

Plan Smarter. Present Sharper. Compete Stronger.
Unlock strategic clarity with our PESTLE analysis of American Assets Trust—three concise sections reveal the political, economic, social, technological, legal, and environmental forces shaping its outlook. Ideal for investors and strategists seeking edge. Purchase the full report to access detailed, actionable insights and ready-to-use templates.
Political factors
Local zoning and entitlements
Entitlement timelines—commonly 12–36 months on the West Coast and 24–48 months in Hawaii—plus community hearings and zoning variances routinely delay development starts and cap supply. Shifts in city council leadership can pivot priorities between growth and preservation, altering project feasibility. Proactive stakeholder engagement has been shown to reduce entitlement delays and conditions, and greater entitlement certainty improves underwriting and capex phasing.
State and municipal tax policy
California Proposition 13 sets a 1% base property tax with assessed value increases capped at 2% annually, a material driver of American Assets Trust NOI in California markets. City transfer taxes, such as San Francisco’s tiered levy reaching up to 3% on very high‑value sales, and proposed vacancy taxes in places like Portland can compress NOI. Incentives for mixed‑use or transit‑oriented projects (tax abatements, fee waivers) can offset carrying costs. Tracking city and state legislative calendars and ballot initiatives is essential to anticipate NOI shifts.
Infrastructure and transit funding
Public investment in transit corridors—backed by the 2021 Bipartisan Infrastructure Law's roughly $550 billion in new spending and regional plans like LA Measure M (~$120 billion over 40 years)—boosts foot traffic and office appeal, improving leasing velocity and rents.
Delays or cancellations (eg. multiyear cost overruns on LA Purple Line extensions) can undermine leasing assumptions and valuation models.
Participation in business improvement districts raises near‑term assessments but often increases asset values; site selection should track funded infrastructure pipelines.
Tourism and military presence policy
Hawaii tourism and federal military basing materially shape retail and residential demand in island submarkets; Hawaii received about 8.7 million visitors in 2023, driving transient retail and short-term rental demand, while DoD funding (US defense budget ~858 billion for FY2024) supports 100,000+ local military-linked households and contractors. Visa, travel and quarantine rule shifts can swing tourist flows quarter-to-quarter. Diversification across nodes reduces policy concentration risk.
- Tourism: 8.7M visitors (2023)
- Defense: US FY2024 budget ~858B
- Local impact: 100k+ military households
- Risk mitigation: geographic diversification
Disaster preparedness funding
- Federal grants: FEMA BRIC/HMGP > $2.5B since 2020
- Impact: reduces capex payback timelines for coastal hardening
- Variation: state prioritization drives geographic funding disparities
- Requirement: compliance, BCA, and grant-timing coordination
Entitlement delays curb coastal supply; Prop13, taxes compress CA NOI; BIL/FEMA cut capex
Entitlement timelines (12–36 months West Coast; 24–48 Hawaii) and council shifts delay projects and cap supply. Prop 13 (1% base, 2% cap) materially shapes CA NOI; local transfer/vacancy taxes pressure returns. BIL (~$550B) and transit boosts leasing; FEMA BRIC/HMGP (> $2.5B since 2020) reduces hardening capex.
| Metric | Value |
|---|---|
| Entitlement | 12–48m |
| Prop 13 | 1%/2% cap |
| BIL | $550B |
| FEMA BRIC/HMGP | >$2.5B |
| Hawaii tourism (2023) | 8.7M |
| US defense FY2024 | $858B |
What is included in the product
Detailed Word Document
Explores how external macro-environmental factors uniquely affect American Assets Trust across Political, Economic, Social, Technological, Environmental, and Legal dimensions, with each section backed by current data and trends to highlight threats and opportunities. Designed for executives, investors, and strategists, the analysis includes forward-looking insights and examples specific to the REIT’s markets and operations.
Customizable Excel Spreadsheet
A concise, visually segmented PESTLE summary of American Assets Trust that’s easily dropped into presentations or shared across teams, enabling quick alignment on external risks, market positioning, and customizable notes for regional or business‑line context.
Economic factors
Interest rates and cap rates
Federal Reserve policy (federal funds 5.25–5.50% and 10‑yr Treasury ~4.4% in mid‑2025) raises REIT cost of capital, squeezing acquisition and development yields and slowing deal flow. A roughly 100 bps cap‑rate expansion versus 2021 levels has meaningfully compressed NAV and can stall dispositions. Fixed‑rate debt ladders and opportunistic refinancing mitigate spread risk. Market beta remains elevated in supply‑constrained coastal metros where vacancy rates often sit below 6%.
Office demand and hybrid work
Office leasing velocity slowed ~20% YoY in 2024 while Kastle’s Return‑to‑Work sat near 52%, pushing TI packages for trophy assets to ~$50–80/sqft and free‑rent concessions of roughly 3–6 months in many markets; high‑quality, amenity‑rich space still clears but secondary inventory lags, so apply conservative renewal probabilities (~50%) and longer downtime; AAT’s residential/retail mix cushions cash‑flow volatility.
Retail sales and tenant health
Experiential and necessity-based retail in coastal centers have outperformed pure apparel, aligning with broader U.S. trends after retail and food services sales hit about 6.3 trillion in 2023 (U.S. Census). Tenant credit dispersion demands vigilant watchlists and co-tenancy clauses as weaker apparel credits persist. Sales-to-rent ratios (commonly 4–6x or higher) guide sustainable occupancy costs, while strong anchors stabilize small-shop leasing and remerchandising.
Housing affordability and rent growth
West Coast housing affordability constraints have capped rent growth to low single digits year‑over‑year through 2024, increasing regulatory scrutiny in California and Oregon, while sunbelt metros (Phoenix, Austin, Dallas) recorded mid‑single‑digit rent gains driven by in‑migration. Supply constraints in infill coastal and transit‑oriented submarkets have supported stabilized occupancy near 94–96% per 2024 industry data. American Assets Trusts portfolio mix of workforce and Class A assets across West Coast and sunbelt markets helps balance exposure to slowing coastal rent growth and stronger sunbelt demand.
- West Coast: low single‑digit rent growth Y/Y (2024)
- Sunbelt: mid‑single‑digit gains, driven by in‑migration
- Occupancy: ~94–96% in infill/transit submarkets (2024)
- Portfolio: workforce + Class A mix reduces concentration risk
Construction costs and labor
Material inflation ran near 5% in 2024 and combined with union labor tightness — extending schedules by an estimated 10–20% — elongates American Assets Trust development timelines; guaranteed maximum price contracts cap overruns but constrain design flexibility.
- Value engineering: preserves margins
- Phased delivery: accelerates cash flow
- GMP: volatility control vs flexibility loss
- Coastal contingency: 10–15% buffers recommended
Entitlement delays curb coastal supply; Prop13, taxes compress CA NOI; BIL/FEMA cut capex
Higher policy rates (fed funds 5.25–5.50%, 10‑yr ~4.4% mid‑2025) and ~100 bps cap‑rate expansion since 2021 raise REIT cost of capital and compress NAV; 2024 inflation ~5% and material/labor tightness lengthen development by ~10–20%. Occupancy in infill/transit submarkets near 94–96% (2024); West Coast rent growth low single‑digit, sunbelt mid single‑digit (2024).
| Metric | Value | Year |
|---|---|---|
| Federal funds | 5.25–5.50% | Mid‑2025 |
| 10‑yr Treasury | ~4.4% | Mid‑2025 |
| Inflation (CPI) | ~5% | 2024 |
| Cap‑rate change vs 2021 | ~+100 bps | 2021–2025 |
| Occupancy (infill) | 94–96% | 2024 |
| Rent growth West Coast | Low single‑digit | 2024 |
| Rent growth Sunbelt | Mid single‑digit | 2024 |
What You See Is What You Get
American Assets Trust PESTLE Analysis
The American Assets Trust PESTLE Analysis examines political, economic, social, technological, legal and environmental factors affecting the company's strategy and portfolio performance. It highlights key risks, opportunities and actionable implications for investors and managers. The preview shown here is the exact document you’ll receive after purchase—fully formatted and ready to use.
Original: $10.00
-65%$10.00
$3.50Description
Plan Smarter. Present Sharper. Compete Stronger.
Unlock strategic clarity with our PESTLE analysis of American Assets Trust—three concise sections reveal the political, economic, social, technological, legal, and environmental forces shaping its outlook. Ideal for investors and strategists seeking edge. Purchase the full report to access detailed, actionable insights and ready-to-use templates.
Political factors
Local zoning and entitlements
Entitlement timelines—commonly 12–36 months on the West Coast and 24–48 months in Hawaii—plus community hearings and zoning variances routinely delay development starts and cap supply. Shifts in city council leadership can pivot priorities between growth and preservation, altering project feasibility. Proactive stakeholder engagement has been shown to reduce entitlement delays and conditions, and greater entitlement certainty improves underwriting and capex phasing.
State and municipal tax policy
California Proposition 13 sets a 1% base property tax with assessed value increases capped at 2% annually, a material driver of American Assets Trust NOI in California markets. City transfer taxes, such as San Francisco’s tiered levy reaching up to 3% on very high‑value sales, and proposed vacancy taxes in places like Portland can compress NOI. Incentives for mixed‑use or transit‑oriented projects (tax abatements, fee waivers) can offset carrying costs. Tracking city and state legislative calendars and ballot initiatives is essential to anticipate NOI shifts.
Infrastructure and transit funding
Public investment in transit corridors—backed by the 2021 Bipartisan Infrastructure Law's roughly $550 billion in new spending and regional plans like LA Measure M (~$120 billion over 40 years)—boosts foot traffic and office appeal, improving leasing velocity and rents.
Delays or cancellations (eg. multiyear cost overruns on LA Purple Line extensions) can undermine leasing assumptions and valuation models.
Participation in business improvement districts raises near‑term assessments but often increases asset values; site selection should track funded infrastructure pipelines.
Tourism and military presence policy
Hawaii tourism and federal military basing materially shape retail and residential demand in island submarkets; Hawaii received about 8.7 million visitors in 2023, driving transient retail and short-term rental demand, while DoD funding (US defense budget ~858 billion for FY2024) supports 100,000+ local military-linked households and contractors. Visa, travel and quarantine rule shifts can swing tourist flows quarter-to-quarter. Diversification across nodes reduces policy concentration risk.
- Tourism: 8.7M visitors (2023)
- Defense: US FY2024 budget ~858B
- Local impact: 100k+ military households
- Risk mitigation: geographic diversification
Disaster preparedness funding
- Federal grants: FEMA BRIC/HMGP > $2.5B since 2020
- Impact: reduces capex payback timelines for coastal hardening
- Variation: state prioritization drives geographic funding disparities
- Requirement: compliance, BCA, and grant-timing coordination
Entitlement delays curb coastal supply; Prop13, taxes compress CA NOI; BIL/FEMA cut capex
Entitlement timelines (12–36 months West Coast; 24–48 Hawaii) and council shifts delay projects and cap supply. Prop 13 (1% base, 2% cap) materially shapes CA NOI; local transfer/vacancy taxes pressure returns. BIL (~$550B) and transit boosts leasing; FEMA BRIC/HMGP (> $2.5B since 2020) reduces hardening capex.
| Metric | Value |
|---|---|
| Entitlement | 12–48m |
| Prop 13 | 1%/2% cap |
| BIL | $550B |
| FEMA BRIC/HMGP | >$2.5B |
| Hawaii tourism (2023) | 8.7M |
| US defense FY2024 | $858B |
What is included in the product
Detailed Word Document
Explores how external macro-environmental factors uniquely affect American Assets Trust across Political, Economic, Social, Technological, Environmental, and Legal dimensions, with each section backed by current data and trends to highlight threats and opportunities. Designed for executives, investors, and strategists, the analysis includes forward-looking insights and examples specific to the REIT’s markets and operations.
Customizable Excel Spreadsheet
A concise, visually segmented PESTLE summary of American Assets Trust that’s easily dropped into presentations or shared across teams, enabling quick alignment on external risks, market positioning, and customizable notes for regional or business‑line context.
Economic factors
Interest rates and cap rates
Federal Reserve policy (federal funds 5.25–5.50% and 10‑yr Treasury ~4.4% in mid‑2025) raises REIT cost of capital, squeezing acquisition and development yields and slowing deal flow. A roughly 100 bps cap‑rate expansion versus 2021 levels has meaningfully compressed NAV and can stall dispositions. Fixed‑rate debt ladders and opportunistic refinancing mitigate spread risk. Market beta remains elevated in supply‑constrained coastal metros where vacancy rates often sit below 6%.
Office demand and hybrid work
Office leasing velocity slowed ~20% YoY in 2024 while Kastle’s Return‑to‑Work sat near 52%, pushing TI packages for trophy assets to ~$50–80/sqft and free‑rent concessions of roughly 3–6 months in many markets; high‑quality, amenity‑rich space still clears but secondary inventory lags, so apply conservative renewal probabilities (~50%) and longer downtime; AAT’s residential/retail mix cushions cash‑flow volatility.
Retail sales and tenant health
Experiential and necessity-based retail in coastal centers have outperformed pure apparel, aligning with broader U.S. trends after retail and food services sales hit about 6.3 trillion in 2023 (U.S. Census). Tenant credit dispersion demands vigilant watchlists and co-tenancy clauses as weaker apparel credits persist. Sales-to-rent ratios (commonly 4–6x or higher) guide sustainable occupancy costs, while strong anchors stabilize small-shop leasing and remerchandising.
Housing affordability and rent growth
West Coast housing affordability constraints have capped rent growth to low single digits year‑over‑year through 2024, increasing regulatory scrutiny in California and Oregon, while sunbelt metros (Phoenix, Austin, Dallas) recorded mid‑single‑digit rent gains driven by in‑migration. Supply constraints in infill coastal and transit‑oriented submarkets have supported stabilized occupancy near 94–96% per 2024 industry data. American Assets Trusts portfolio mix of workforce and Class A assets across West Coast and sunbelt markets helps balance exposure to slowing coastal rent growth and stronger sunbelt demand.
- West Coast: low single‑digit rent growth Y/Y (2024)
- Sunbelt: mid‑single‑digit gains, driven by in‑migration
- Occupancy: ~94–96% in infill/transit submarkets (2024)
- Portfolio: workforce + Class A mix reduces concentration risk
Construction costs and labor
Material inflation ran near 5% in 2024 and combined with union labor tightness — extending schedules by an estimated 10–20% — elongates American Assets Trust development timelines; guaranteed maximum price contracts cap overruns but constrain design flexibility.
- Value engineering: preserves margins
- Phased delivery: accelerates cash flow
- GMP: volatility control vs flexibility loss
- Coastal contingency: 10–15% buffers recommended
Entitlement delays curb coastal supply; Prop13, taxes compress CA NOI; BIL/FEMA cut capex
Higher policy rates (fed funds 5.25–5.50%, 10‑yr ~4.4% mid‑2025) and ~100 bps cap‑rate expansion since 2021 raise REIT cost of capital and compress NAV; 2024 inflation ~5% and material/labor tightness lengthen development by ~10–20%. Occupancy in infill/transit submarkets near 94–96% (2024); West Coast rent growth low single‑digit, sunbelt mid single‑digit (2024).
| Metric | Value | Year |
|---|---|---|
| Federal funds | 5.25–5.50% | Mid‑2025 |
| 10‑yr Treasury | ~4.4% | Mid‑2025 |
| Inflation (CPI) | ~5% | 2024 |
| Cap‑rate change vs 2021 | ~+100 bps | 2021–2025 |
| Occupancy (infill) | 94–96% | 2024 |
| Rent growth West Coast | Low single‑digit | 2024 |
| Rent growth Sunbelt | Mid single‑digit | 2024 |
What You See Is What You Get
American Assets Trust PESTLE Analysis
The American Assets Trust PESTLE Analysis examines political, economic, social, technological, legal and environmental factors affecting the company's strategy and portfolio performance. It highlights key risks, opportunities and actionable implications for investors and managers. The preview shown here is the exact document you’ll receive after purchase—fully formatted and ready to use.











