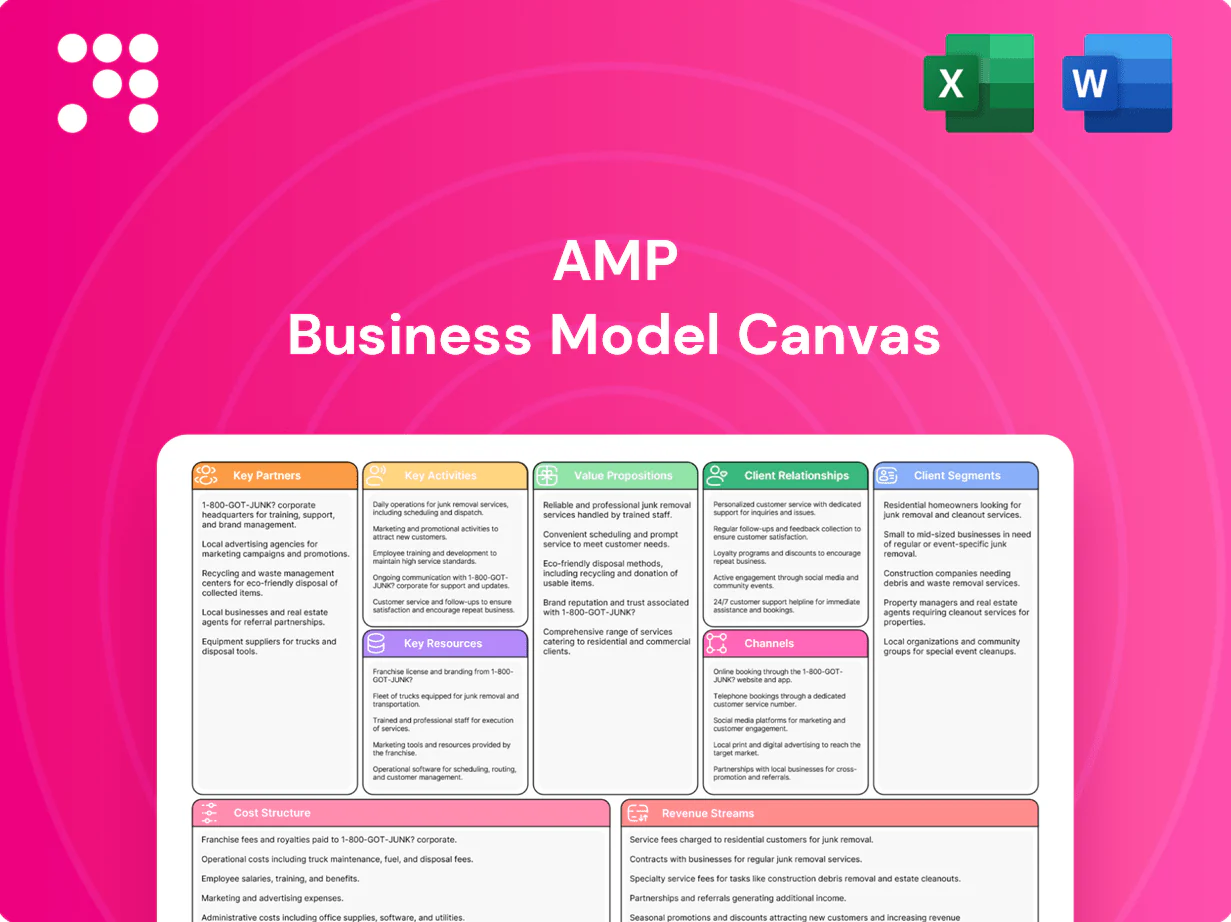
AMP Business Model Canvas

Unlock strategic DNA with a concise Business Model Canvas for investors and strategists
Unlock AMP’s strategic DNA with our concise Business Model Canvas—three to five-sentence snapshot showing how AMP creates value, scales revenue streams, and leverages partnerships to stay competitive. Download the full, editable Canvas to access all nine blocks, financial implications, and actionable insights for investors and strategists.
Partnerships

Fund managers
External fund managers broaden AMP’s asset class coverage and niche strategies, delivering alpha across equities, fixed income and alternatives; as of 2024 outsourced managers account for roughly 40% of institutional active mandates globally, boosting diversification. Co-developing mandates with managers improves fee efficiency and capacity, while governance overlays and quarterly reporting ensure alignment and transparency.
Custodians & trustees
Global custodians safeguard assets, manage corporate actions and deliver consolidated reporting across the A$3.4 trillion Australian superannuation pool (APRA, June 2024). Trustee partners ensure superannuation compliance and fiduciary oversight for AMP's funds. Their scale reduces operational risk and lowers unit costs via standardisation. Integrated data feeds power performance and risk analytics across portfolios.

Technology vendors
Core banking, advice and portfolio platforms underpin AMP’s digital delivery, supporting scale and compliance while handling A$100+ billion in client assets across platforms. Fintech partners accelerate innovation and personalization, with global fintech investment around US$62 billion in 2023 driving product variety. Cloud and cybersecurity providers — used by over 90% of enterprises in 2024 — enhance resilience and uptime. APIs enable ecosystem integrations and can cut time-to-market by up to 30%.

Distribution alliances
- Broker networks
- Comparison sites
- Employer groups
- Mortgage brokers / IFAs
- Co‑marketing
Regulatory & industry bodies
Engagement with regulators ensures AMP product design meets compliance and reduces redesign costs; ongoing dialogues in 2024 supported faster approvals and lower conduct breaches. Industry associations shape standards and policy input, with AMP participating in 15 bodies in 2024 to influence frameworks. Education partnerships lifted adviser accreditation and ethics—over 13,000 advisers underwent updated CPD modules in 2024. Collaboration builds trust and cuts conduct risk across distribution channels.
- regulatory engagement: 15 bodies (2024)
- adviser CPD: 13,000 completed (2024)
- reduced conduct risk: fewer product redesigns (2024)
External managers cover ~40% mandates; custody A$3.4tn; platforms A$100bn+
External managers, custodians and fintechs expand AMP’s product coverage and resilience, with outsourced managers covering ~40% of institutional active mandates and custodial support across A$3.4 trillion (APRA, June 2024). Platform and bank partnerships handle A$100+bn in platform assets, while distribution alliances drive acquisition (mortgage brokers/IFAs ~60% origination, MFAA 2024). Regulatory and industry engagement (15 bodies; 13,000 advisers CPD 2024) reduce conduct risk.
| Partner | Metric (2024) |
|---|---|
| Outsourced managers | ~40% mandates |
| Custodial pool | A$3.4tn |
| Platform assets | A$100+bn |
| Mortgage/IFA orig. | ~60% |
| Industry bodies / CPD | 15 / 13,000 |
What is included in the product
 Detailed Word Document
A comprehensive AMP Business Model Canvas tailored to the company’s strategy, covering customer segments, channels, value propositions and the 9 classic BMC blocks with real-world operations and competitive-advantage analysis. Ideal for presentations, funding discussions, SWOT-linked insights, validation with company data, and polished use by entrepreneurs and analysts.

 Customizable Excel Spreadsheet
AMP Business Model Canvas condenses company strategy into a clean, shareable one-page snapshot that saves hours of formatting, eases team collaboration, and lets you quickly compare models or adapt structure for new insights.
Activities

Portfolio management
Strategic and tactical asset allocation at AMP (FUMA A$121.3bn at 30 June 2024) drives returns and volatility control, while rigorous manager selection and oversight enforce performance and cost discipline. Risk budgeting combined with ESG integration preserves long-term value, and detailed reporting ensures transparency to clients and regulators.
Financial advice delivery
Goals-based planning aligns AMP products to client needs, mapping portfolios to objectives and risk profiles while noting that as of 2024 the Australian superannuation pool exceeded A$3.5 trillion (APRA). Ongoing reviews recalibrate strategies for life events and market moves. Compliance and the best-interest duty (since 2019) legally guide AMP recommendations. Hybrid models blend human advisers with digital tools to scale advice delivery.

Product development
Design superannuation, retirement income and investment products aligned to Australia’s A$3.6 trillion super sector (APRA Mar 2024), structuring fee tiers, liquidity windows and risk buffers. Stress-test portfolios against severe market shocks (eg 30% drawdown) and longevity scenarios to age 95 vs current life expectancy 83.4 years. Iterate product features from customer NPS/claims data and APRA/ASIC rule changes.

Banking operations
Manage deposits, lending and payments with prudent risk controls, aligning credit underwriting to balance growth and asset quality; global bank assets were about $150 trillion in 2024, underscoring scale and systemic risk. Treasury optimizes funding and interest-rate exposure while digital servicing cuts friction and cost-to-serve, improving operational efficiency and customer retention.
- deposits: liquidity & reserve management
- credit: underwriting & portfolio quality
- treasury: funding & rate hedging
- digital: self-service, lower cost-to-serve
Risk & compliance
Risk & compliance monitors conduct, AML/CTF controls and prudential obligations, aligning capital planning and scenario testing to maintain minimum Basel III CET1 of 4.5% and enhance resilience; vendor and model risk frameworks ensure control, while incident management drives remediation and organisational learning.
- Monitor conduct, AML/CTF, prudential
- Scenario testing & capital planning
- Vendor & model risk frameworks
- Incident management & remediation
Allocation drives returns: A$121.3bn FUMA, A$3.6tn super pool, CET1≥4.5%
Strategic asset allocation and manager oversight (AMP FUMA A$121.3bn at 30 Jun 2024) drive returns and cost discipline. Goals-based planning aligns products to clients within Australia’s A$3.6tn super pool (APRA Mar 2024). Risk, compliance and treasury (Basel III CET1 min 4.5%) protect solvency and liquidity.
| Activity | 2024 metric | Purpose |
|---|---|---|
| Investment | A$121.3bn FUMA | Returns & volatility control |
| Super product | A$3.6tn market | Client alignment |
| Risk/Treasury | CET1 ≥4.5% | Resilience & liquidity |
Preview Before You Purchase
Business Model Canvas
The AMP Business Model Canvas preview shown here is the exact, live document you will receive after purchase, not a mockup or sample. When you buy, you’ll get this same fully formatted, ready-to-edit file (Word and Excel) with all sections included. No surprises—what you see is what you’ll download and use immediately.

Unlock strategic DNA with a concise Business Model Canvas for investors and strategists
Unlock AMP’s strategic DNA with our concise Business Model Canvas—three to five-sentence snapshot showing how AMP creates value, scales revenue streams, and leverages partnerships to stay competitive. Download the full, editable Canvas to access all nine blocks, financial implications, and actionable insights for investors and strategists.
Partnerships
Fund managers
External fund managers broaden AMP’s asset class coverage and niche strategies, delivering alpha across equities, fixed income and alternatives; as of 2024 outsourced managers account for roughly 40% of institutional active mandates globally, boosting diversification. Co-developing mandates with managers improves fee efficiency and capacity, while governance overlays and quarterly reporting ensure alignment and transparency.
Custodians & trustees
Global custodians safeguard assets, manage corporate actions and deliver consolidated reporting across the A$3.4 trillion Australian superannuation pool (APRA, June 2024). Trustee partners ensure superannuation compliance and fiduciary oversight for AMP's funds. Their scale reduces operational risk and lowers unit costs via standardisation. Integrated data feeds power performance and risk analytics across portfolios.
Technology vendors
Core banking, advice and portfolio platforms underpin AMP’s digital delivery, supporting scale and compliance while handling A$100+ billion in client assets across platforms. Fintech partners accelerate innovation and personalization, with global fintech investment around US$62 billion in 2023 driving product variety. Cloud and cybersecurity providers — used by over 90% of enterprises in 2024 — enhance resilience and uptime. APIs enable ecosystem integrations and can cut time-to-market by up to 30%.
Distribution alliances
- Broker networks
- Comparison sites
- Employer groups
- Mortgage brokers / IFAs
- Co‑marketing
Regulatory & industry bodies
Engagement with regulators ensures AMP product design meets compliance and reduces redesign costs; ongoing dialogues in 2024 supported faster approvals and lower conduct breaches. Industry associations shape standards and policy input, with AMP participating in 15 bodies in 2024 to influence frameworks. Education partnerships lifted adviser accreditation and ethics—over 13,000 advisers underwent updated CPD modules in 2024. Collaboration builds trust and cuts conduct risk across distribution channels.
- regulatory engagement: 15 bodies (2024)
- adviser CPD: 13,000 completed (2024)
- reduced conduct risk: fewer product redesigns (2024)
External managers cover ~40% mandates; custody A$3.4tn; platforms A$100bn+
External managers, custodians and fintechs expand AMP’s product coverage and resilience, with outsourced managers covering ~40% of institutional active mandates and custodial support across A$3.4 trillion (APRA, June 2024). Platform and bank partnerships handle A$100+bn in platform assets, while distribution alliances drive acquisition (mortgage brokers/IFAs ~60% origination, MFAA 2024). Regulatory and industry engagement (15 bodies; 13,000 advisers CPD 2024) reduce conduct risk.
| Partner | Metric (2024) |
|---|---|
| Outsourced managers | ~40% mandates |
| Custodial pool | A$3.4tn |
| Platform assets | A$100+bn |
| Mortgage/IFA orig. | ~60% |
| Industry bodies / CPD | 15 / 13,000 |
What is included in the product
Detailed Word Document
A comprehensive AMP Business Model Canvas tailored to the company’s strategy, covering customer segments, channels, value propositions and the 9 classic BMC blocks with real-world operations and competitive-advantage analysis. Ideal for presentations, funding discussions, SWOT-linked insights, validation with company data, and polished use by entrepreneurs and analysts.
Customizable Excel Spreadsheet
AMP Business Model Canvas condenses company strategy into a clean, shareable one-page snapshot that saves hours of formatting, eases team collaboration, and lets you quickly compare models or adapt structure for new insights.
Activities
Portfolio management
Strategic and tactical asset allocation at AMP (FUMA A$121.3bn at 30 June 2024) drives returns and volatility control, while rigorous manager selection and oversight enforce performance and cost discipline. Risk budgeting combined with ESG integration preserves long-term value, and detailed reporting ensures transparency to clients and regulators.
Financial advice delivery
Goals-based planning aligns AMP products to client needs, mapping portfolios to objectives and risk profiles while noting that as of 2024 the Australian superannuation pool exceeded A$3.5 trillion (APRA). Ongoing reviews recalibrate strategies for life events and market moves. Compliance and the best-interest duty (since 2019) legally guide AMP recommendations. Hybrid models blend human advisers with digital tools to scale advice delivery.
Product development
Design superannuation, retirement income and investment products aligned to Australia’s A$3.6 trillion super sector (APRA Mar 2024), structuring fee tiers, liquidity windows and risk buffers. Stress-test portfolios against severe market shocks (eg 30% drawdown) and longevity scenarios to age 95 vs current life expectancy 83.4 years. Iterate product features from customer NPS/claims data and APRA/ASIC rule changes.
Banking operations
Manage deposits, lending and payments with prudent risk controls, aligning credit underwriting to balance growth and asset quality; global bank assets were about $150 trillion in 2024, underscoring scale and systemic risk. Treasury optimizes funding and interest-rate exposure while digital servicing cuts friction and cost-to-serve, improving operational efficiency and customer retention.
- deposits: liquidity & reserve management
- credit: underwriting & portfolio quality
- treasury: funding & rate hedging
- digital: self-service, lower cost-to-serve
Risk & compliance
Risk & compliance monitors conduct, AML/CTF controls and prudential obligations, aligning capital planning and scenario testing to maintain minimum Basel III CET1 of 4.5% and enhance resilience; vendor and model risk frameworks ensure control, while incident management drives remediation and organisational learning.
- Monitor conduct, AML/CTF, prudential
- Scenario testing & capital planning
- Vendor & model risk frameworks
- Incident management & remediation
Allocation drives returns: A$121.3bn FUMA, A$3.6tn super pool, CET1≥4.5%
Strategic asset allocation and manager oversight (AMP FUMA A$121.3bn at 30 Jun 2024) drive returns and cost discipline. Goals-based planning aligns products to clients within Australia’s A$3.6tn super pool (APRA Mar 2024). Risk, compliance and treasury (Basel III CET1 min 4.5%) protect solvency and liquidity.
| Activity | 2024 metric | Purpose |
|---|---|---|
| Investment | A$121.3bn FUMA | Returns & volatility control |
| Super product | A$3.6tn market | Client alignment |
| Risk/Treasury | CET1 ≥4.5% | Resilience & liquidity |
Preview Before You Purchase
Business Model Canvas
The AMP Business Model Canvas preview shown here is the exact, live document you will receive after purchase, not a mockup or sample. When you buy, you’ll get this same fully formatted, ready-to-edit file (Word and Excel) with all sections included. No surprises—what you see is what you’ll download and use immediately.
Original: $10.00
-65%$10.00
$3.50Description
Unlock strategic DNA with a concise Business Model Canvas for investors and strategists
Unlock AMP’s strategic DNA with our concise Business Model Canvas—three to five-sentence snapshot showing how AMP creates value, scales revenue streams, and leverages partnerships to stay competitive. Download the full, editable Canvas to access all nine blocks, financial implications, and actionable insights for investors and strategists.
Partnerships
Fund managers
External fund managers broaden AMP’s asset class coverage and niche strategies, delivering alpha across equities, fixed income and alternatives; as of 2024 outsourced managers account for roughly 40% of institutional active mandates globally, boosting diversification. Co-developing mandates with managers improves fee efficiency and capacity, while governance overlays and quarterly reporting ensure alignment and transparency.
Custodians & trustees
Global custodians safeguard assets, manage corporate actions and deliver consolidated reporting across the A$3.4 trillion Australian superannuation pool (APRA, June 2024). Trustee partners ensure superannuation compliance and fiduciary oversight for AMP's funds. Their scale reduces operational risk and lowers unit costs via standardisation. Integrated data feeds power performance and risk analytics across portfolios.
Technology vendors
Core banking, advice and portfolio platforms underpin AMP’s digital delivery, supporting scale and compliance while handling A$100+ billion in client assets across platforms. Fintech partners accelerate innovation and personalization, with global fintech investment around US$62 billion in 2023 driving product variety. Cloud and cybersecurity providers — used by over 90% of enterprises in 2024 — enhance resilience and uptime. APIs enable ecosystem integrations and can cut time-to-market by up to 30%.
Distribution alliances
- Broker networks
- Comparison sites
- Employer groups
- Mortgage brokers / IFAs
- Co‑marketing
Regulatory & industry bodies
Engagement with regulators ensures AMP product design meets compliance and reduces redesign costs; ongoing dialogues in 2024 supported faster approvals and lower conduct breaches. Industry associations shape standards and policy input, with AMP participating in 15 bodies in 2024 to influence frameworks. Education partnerships lifted adviser accreditation and ethics—over 13,000 advisers underwent updated CPD modules in 2024. Collaboration builds trust and cuts conduct risk across distribution channels.
- regulatory engagement: 15 bodies (2024)
- adviser CPD: 13,000 completed (2024)
- reduced conduct risk: fewer product redesigns (2024)
External managers cover ~40% mandates; custody A$3.4tn; platforms A$100bn+
External managers, custodians and fintechs expand AMP’s product coverage and resilience, with outsourced managers covering ~40% of institutional active mandates and custodial support across A$3.4 trillion (APRA, June 2024). Platform and bank partnerships handle A$100+bn in platform assets, while distribution alliances drive acquisition (mortgage brokers/IFAs ~60% origination, MFAA 2024). Regulatory and industry engagement (15 bodies; 13,000 advisers CPD 2024) reduce conduct risk.
| Partner | Metric (2024) |
|---|---|
| Outsourced managers | ~40% mandates |
| Custodial pool | A$3.4tn |
| Platform assets | A$100+bn |
| Mortgage/IFA orig. | ~60% |
| Industry bodies / CPD | 15 / 13,000 |
What is included in the product
Detailed Word Document
A comprehensive AMP Business Model Canvas tailored to the company’s strategy, covering customer segments, channels, value propositions and the 9 classic BMC blocks with real-world operations and competitive-advantage analysis. Ideal for presentations, funding discussions, SWOT-linked insights, validation with company data, and polished use by entrepreneurs and analysts.
Customizable Excel Spreadsheet
AMP Business Model Canvas condenses company strategy into a clean, shareable one-page snapshot that saves hours of formatting, eases team collaboration, and lets you quickly compare models or adapt structure for new insights.
Activities
Portfolio management
Strategic and tactical asset allocation at AMP (FUMA A$121.3bn at 30 June 2024) drives returns and volatility control, while rigorous manager selection and oversight enforce performance and cost discipline. Risk budgeting combined with ESG integration preserves long-term value, and detailed reporting ensures transparency to clients and regulators.
Financial advice delivery
Goals-based planning aligns AMP products to client needs, mapping portfolios to objectives and risk profiles while noting that as of 2024 the Australian superannuation pool exceeded A$3.5 trillion (APRA). Ongoing reviews recalibrate strategies for life events and market moves. Compliance and the best-interest duty (since 2019) legally guide AMP recommendations. Hybrid models blend human advisers with digital tools to scale advice delivery.
Product development
Design superannuation, retirement income and investment products aligned to Australia’s A$3.6 trillion super sector (APRA Mar 2024), structuring fee tiers, liquidity windows and risk buffers. Stress-test portfolios against severe market shocks (eg 30% drawdown) and longevity scenarios to age 95 vs current life expectancy 83.4 years. Iterate product features from customer NPS/claims data and APRA/ASIC rule changes.
Banking operations
Manage deposits, lending and payments with prudent risk controls, aligning credit underwriting to balance growth and asset quality; global bank assets were about $150 trillion in 2024, underscoring scale and systemic risk. Treasury optimizes funding and interest-rate exposure while digital servicing cuts friction and cost-to-serve, improving operational efficiency and customer retention.
- deposits: liquidity & reserve management
- credit: underwriting & portfolio quality
- treasury: funding & rate hedging
- digital: self-service, lower cost-to-serve
Risk & compliance
Risk & compliance monitors conduct, AML/CTF controls and prudential obligations, aligning capital planning and scenario testing to maintain minimum Basel III CET1 of 4.5% and enhance resilience; vendor and model risk frameworks ensure control, while incident management drives remediation and organisational learning.
- Monitor conduct, AML/CTF, prudential
- Scenario testing & capital planning
- Vendor & model risk frameworks
- Incident management & remediation
Allocation drives returns: A$121.3bn FUMA, A$3.6tn super pool, CET1≥4.5%
Strategic asset allocation and manager oversight (AMP FUMA A$121.3bn at 30 Jun 2024) drive returns and cost discipline. Goals-based planning aligns products to clients within Australia’s A$3.6tn super pool (APRA Mar 2024). Risk, compliance and treasury (Basel III CET1 min 4.5%) protect solvency and liquidity.
| Activity | 2024 metric | Purpose |
|---|---|---|
| Investment | A$121.3bn FUMA | Returns & volatility control |
| Super product | A$3.6tn market | Client alignment |
| Risk/Treasury | CET1 ≥4.5% | Resilience & liquidity |
Preview Before You Purchase
Business Model Canvas
The AMP Business Model Canvas preview shown here is the exact, live document you will receive after purchase, not a mockup or sample. When you buy, you’ll get this same fully formatted, ready-to-edit file (Word and Excel) with all sections included. No surprises—what you see is what you’ll download and use immediately.











