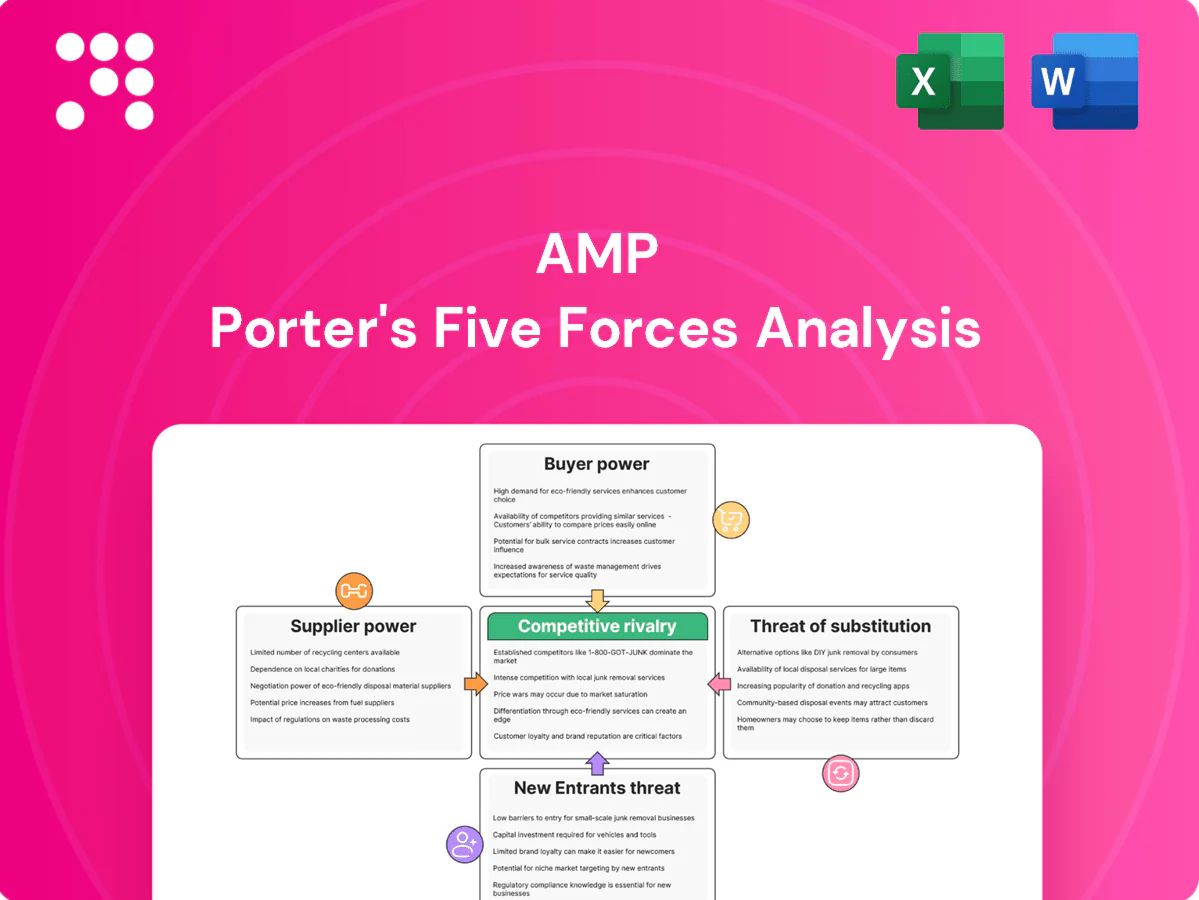
AMP Porter's Five Forces Analysis

From Overview to Strategy Blueprint
AMP’s Porter’s Five Forces highlights key competitive pressures—buyer and supplier power, entrant threats, substitutes and rivalry—that shape its strategic choices. This snapshot flags high-impact areas and potential vulnerabilities. The full report quantifies each force, offers visuals and implications. Unlock the complete analysis to inform investment or strategic decisions.
Suppliers Bargaining Power

Wholesale funding dependence
AMP relies heavily on wholesale markets and institutional lenders to fund banking and investment activities; wholesale funding made up about 38% of total funding in FY2024, exposing the group to rate volatility and credit spread moves that can raise input costs and compress margins.
Diversified funding programs and 6% deposit growth in 2024 reduced concentration risk, but rapid shifts in RBA policy (cash rate ~4.35% through mid-2024) can quickly swing supplier leverage.
Technology and platform vendors
Core banking, advice platforms and cybersecurity vendors (eg Temenos with 3,000+ bank customers) hold strong leverage because switching involves deep integration, extended timelines and costs; SLAs matter — 99.9% uptime equals ~8.76 hours downtime/year versus 99.99% equals ~52.6 minutes. Multi-vendor architectures and open APIs reduce vendor lock-in. Service-level reliability directly affects client experience and regulatory compliance.

Asset managers and research providers
External managers, index providers and research houses drive product costs and outcomes; for example BlackRock surpassed about $10.5 trillion AUM in 2024 while the top three ETF/index providers control roughly 70% of US ETF flows, allowing brand-name managers to command higher fees and distribution terms. AMP can leverage internal capabilities and open-architecture to negotiate terms, with performance dispersion over time shifting supplier bargaining power.

Data, market infrastructure, and custodians
Exchanges, data feeds, and custodial banks are core to AMP operations, with Bloomberg and Refinitiv remaining dominant market-data suppliers in 2024, strengthening supplier leverage.
Oligopolistic pricing for market data and real-time feeds elevates supplier power, while long-term custody contracts create multi-year operational dependence.
Regulatory reporting demands (MiFID II, SEC rules) in 2024 increased reliance on high-quality data and reconciliation services.
- Market-data concentration: Bloomberg/Refinitiv dominant in 2024
- Custody lock-in: multi-year contracts common
- Regulation: MiFID II/SEC rules drive data quality needs
Adviser networks and distribution partners
Aligned and independent advisers both steer client flows into AMP products, with top 10% high-performing practices able to negotiate materially better economics and service SLAs based on scale and retention.
Rising compliance and licensing costs through 2024 have concentrated bargaining power among larger licensees and dealer groups, while AMP’s expanding digital direct channels (c.15% of gross flows in 2024) partially offset adviser leverage.
- Adviser influence on flows
- Top practices negotiate better terms
- Compliance consolidates bargaining power
- Digital channels ~15% of flows (2024)
Suppliers exert moderate-high power: wholesale funding 38%, digital flows 15%
Suppliers exert moderate-to-high power: wholesale funding was 38% of funding in FY2024 and is rate-sensitive (RBA cash rate ~4.35% mid-2024). Market-data and custody (Bloomberg/Refinitiv dominant) create oligopolistic leverage. External managers (BlackRock ~$10.5tn AUM) and top advisers extract premium terms, while AMP’s digital channels (~15% flows) and internal capabilities partially offset supplier bargaining power.
| Supplier | 2024 metric | Impact |
|---|---|---|
| Wholesale funding | 38% of funding | High rate/credit sensitivity |
| Market data/custody | Bloomberg/Refinitiv dominant | Oligopoly pricing |
| Digital channels | ~15% flows | Reduces adviser leverage |
What is included in the product
 Detailed Word Document
Concise Porter’s Five Forces analysis tailored to AMP, uncovering competitive drivers, buyer and supplier power, entry barriers, substitutes, and emerging threats to its market share; includes strategic commentary and editable format for integration into investor materials or strategy decks.

 Customizable Excel Spreadsheet
A single-sheet AMP Porter's Five Forces tool that visualizes competitive pressure with a spider chart and lets you tweak inputs to model scenarios—ideal for fast strategic decisions and slide-ready summaries.
Customers Bargaining Power

Price-sensitive retail investors
Transparent fees and plentiful low-cost alternatives heighten price pressure on AMP; global ETF assets topped about US$13 trillion in 2024, anchoring customer fee expectations. AMP must explicitly justify advice and platform fees with demonstrable outcomes and tools. Online onboarding and portability rules shorten switching to hours–days, making investor churn easier.
Superannuation members
Superannuation members wield growing bargaining power as APRAs MySuper heatmap and 2024 regulatory focus amplify fee and performance scrutiny; Australia’s super system held about A$3.7 trillion in 2024, raising the stakes. Members can easily switch funds, increasing churn risk if AMP trails peers on returns. Default arrangements still aid retention but face tighter oversight. Retirement-phase members demand stronger income certainty and guaranteed outcomes.

High-net-worth and advised clients
According to 2024 reports, high-net-worth clients control tens of trillions in investable wealth and increasingly demand bespoke advice, tax efficiency, and alternative access to private markets. They routinely negotiate fees tied to wallet size and performance alignment, driving margin pressure for providers. Strong service quality and trusted relationships materially reduce price sensitivity and churn. Platform breadth and exclusive offerings significantly increase retention and share of wallet.

Corporate and institutional mandates
Corporate and institutional mandates drive aggressive RFPs where scale matters: Australia’s superannuation pool reached about A$3.5 trillion in 2024, letting large clients extract lower fees and bespoke services. Performance, detailed reporting and ESG integration are baseline expectations, and multi-manager portability and platform solutions materially reduce switching costs, strengthening customer bargaining power.
- RFP frequency: high among top-tier mandates
- Scale leverage: large clients win fee concessions
- Table stakes: performance, reporting, ESG
- Switching: multi-manager portability lowers barriers
SMEs and mortgage customers
Business owners and mortgage borrowers increasingly shop rates via banks and brokers; in 2024 about 65% used comparison tools, compressing spreads and pushing average bank mortgage margins toward ~1.2–1.5 percentage points. Cross-sell (insurance, deposits) helps offset margin pressure. Turnaround speed and digital service are decisive differentiators.
- ~65% use comparison tools (2024)
- Margins ~1.2–1.5pp
- Cross-sell lifts lifetime value
- Digital turnaround drives win rates
Low-cost ETFs and mobile switching force funds to prove value as fee scrutiny intensifies
Transparent fees and abundant low-cost alternatives (global ETF assets ~US$13trn in 2024) increase price sensitivity and force AMP to justify advice/platform fees with measurable outcomes. Super members (Australia super ~A$3.7trn in 2024) can switch easily, amplifying churn risk; default status aids retention but scrutiny is rising. HNW and institutional clients demand bespoke terms, driving fee concessions and RFP frequency.
| Metric | 2024 Value |
|---|---|
| Global ETF assets | ~US$13trn |
| Australia super pool | ~A$3.7trn |
| Consumers using comparison tools | ~65% |
| Bank mortgage margins | ~1.2–1.5pp |
Preview the Actual Deliverable
AMP Porter's Five Forces Analysis
This preview is the exact AMP Porter's Five Forces Analysis you’ll receive after purchase—fully formatted and ready to use. It contains the complete competitive assessment, threats and bargaining power insights, and strategic implications as presented here. No mockups or placeholders; once you buy, you’ll get instant access to this same document.

From Overview to Strategy Blueprint
AMP’s Porter’s Five Forces highlights key competitive pressures—buyer and supplier power, entrant threats, substitutes and rivalry—that shape its strategic choices. This snapshot flags high-impact areas and potential vulnerabilities. The full report quantifies each force, offers visuals and implications. Unlock the complete analysis to inform investment or strategic decisions.
Suppliers Bargaining Power
Wholesale funding dependence
AMP relies heavily on wholesale markets and institutional lenders to fund banking and investment activities; wholesale funding made up about 38% of total funding in FY2024, exposing the group to rate volatility and credit spread moves that can raise input costs and compress margins.
Diversified funding programs and 6% deposit growth in 2024 reduced concentration risk, but rapid shifts in RBA policy (cash rate ~4.35% through mid-2024) can quickly swing supplier leverage.
Technology and platform vendors
Core banking, advice platforms and cybersecurity vendors (eg Temenos with 3,000+ bank customers) hold strong leverage because switching involves deep integration, extended timelines and costs; SLAs matter — 99.9% uptime equals ~8.76 hours downtime/year versus 99.99% equals ~52.6 minutes. Multi-vendor architectures and open APIs reduce vendor lock-in. Service-level reliability directly affects client experience and regulatory compliance.
Asset managers and research providers
External managers, index providers and research houses drive product costs and outcomes; for example BlackRock surpassed about $10.5 trillion AUM in 2024 while the top three ETF/index providers control roughly 70% of US ETF flows, allowing brand-name managers to command higher fees and distribution terms. AMP can leverage internal capabilities and open-architecture to negotiate terms, with performance dispersion over time shifting supplier bargaining power.
Data, market infrastructure, and custodians
Exchanges, data feeds, and custodial banks are core to AMP operations, with Bloomberg and Refinitiv remaining dominant market-data suppliers in 2024, strengthening supplier leverage.
Oligopolistic pricing for market data and real-time feeds elevates supplier power, while long-term custody contracts create multi-year operational dependence.
Regulatory reporting demands (MiFID II, SEC rules) in 2024 increased reliance on high-quality data and reconciliation services.
- Market-data concentration: Bloomberg/Refinitiv dominant in 2024
- Custody lock-in: multi-year contracts common
- Regulation: MiFID II/SEC rules drive data quality needs
Adviser networks and distribution partners
Aligned and independent advisers both steer client flows into AMP products, with top 10% high-performing practices able to negotiate materially better economics and service SLAs based on scale and retention.
Rising compliance and licensing costs through 2024 have concentrated bargaining power among larger licensees and dealer groups, while AMP’s expanding digital direct channels (c.15% of gross flows in 2024) partially offset adviser leverage.
- Adviser influence on flows
- Top practices negotiate better terms
- Compliance consolidates bargaining power
- Digital channels ~15% of flows (2024)
Suppliers exert moderate-high power: wholesale funding 38%, digital flows 15%
Suppliers exert moderate-to-high power: wholesale funding was 38% of funding in FY2024 and is rate-sensitive (RBA cash rate ~4.35% mid-2024). Market-data and custody (Bloomberg/Refinitiv dominant) create oligopolistic leverage. External managers (BlackRock ~$10.5tn AUM) and top advisers extract premium terms, while AMP’s digital channels (~15% flows) and internal capabilities partially offset supplier bargaining power.
| Supplier | 2024 metric | Impact |
|---|---|---|
| Wholesale funding | 38% of funding | High rate/credit sensitivity |
| Market data/custody | Bloomberg/Refinitiv dominant | Oligopoly pricing |
| Digital channels | ~15% flows | Reduces adviser leverage |
What is included in the product
Detailed Word Document
Concise Porter’s Five Forces analysis tailored to AMP, uncovering competitive drivers, buyer and supplier power, entry barriers, substitutes, and emerging threats to its market share; includes strategic commentary and editable format for integration into investor materials or strategy decks.
Customizable Excel Spreadsheet
A single-sheet AMP Porter's Five Forces tool that visualizes competitive pressure with a spider chart and lets you tweak inputs to model scenarios—ideal for fast strategic decisions and slide-ready summaries.
Customers Bargaining Power
Price-sensitive retail investors
Transparent fees and plentiful low-cost alternatives heighten price pressure on AMP; global ETF assets topped about US$13 trillion in 2024, anchoring customer fee expectations. AMP must explicitly justify advice and platform fees with demonstrable outcomes and tools. Online onboarding and portability rules shorten switching to hours–days, making investor churn easier.
Superannuation members
Superannuation members wield growing bargaining power as APRAs MySuper heatmap and 2024 regulatory focus amplify fee and performance scrutiny; Australia’s super system held about A$3.7 trillion in 2024, raising the stakes. Members can easily switch funds, increasing churn risk if AMP trails peers on returns. Default arrangements still aid retention but face tighter oversight. Retirement-phase members demand stronger income certainty and guaranteed outcomes.
High-net-worth and advised clients
According to 2024 reports, high-net-worth clients control tens of trillions in investable wealth and increasingly demand bespoke advice, tax efficiency, and alternative access to private markets. They routinely negotiate fees tied to wallet size and performance alignment, driving margin pressure for providers. Strong service quality and trusted relationships materially reduce price sensitivity and churn. Platform breadth and exclusive offerings significantly increase retention and share of wallet.
Corporate and institutional mandates
Corporate and institutional mandates drive aggressive RFPs where scale matters: Australia’s superannuation pool reached about A$3.5 trillion in 2024, letting large clients extract lower fees and bespoke services. Performance, detailed reporting and ESG integration are baseline expectations, and multi-manager portability and platform solutions materially reduce switching costs, strengthening customer bargaining power.
- RFP frequency: high among top-tier mandates
- Scale leverage: large clients win fee concessions
- Table stakes: performance, reporting, ESG
- Switching: multi-manager portability lowers barriers
SMEs and mortgage customers
Business owners and mortgage borrowers increasingly shop rates via banks and brokers; in 2024 about 65% used comparison tools, compressing spreads and pushing average bank mortgage margins toward ~1.2–1.5 percentage points. Cross-sell (insurance, deposits) helps offset margin pressure. Turnaround speed and digital service are decisive differentiators.
- ~65% use comparison tools (2024)
- Margins ~1.2–1.5pp
- Cross-sell lifts lifetime value
- Digital turnaround drives win rates
Low-cost ETFs and mobile switching force funds to prove value as fee scrutiny intensifies
Transparent fees and abundant low-cost alternatives (global ETF assets ~US$13trn in 2024) increase price sensitivity and force AMP to justify advice/platform fees with measurable outcomes. Super members (Australia super ~A$3.7trn in 2024) can switch easily, amplifying churn risk; default status aids retention but scrutiny is rising. HNW and institutional clients demand bespoke terms, driving fee concessions and RFP frequency.
| Metric | 2024 Value |
|---|---|
| Global ETF assets | ~US$13trn |
| Australia super pool | ~A$3.7trn |
| Consumers using comparison tools | ~65% |
| Bank mortgage margins | ~1.2–1.5pp |
Preview the Actual Deliverable
AMP Porter's Five Forces Analysis
This preview is the exact AMP Porter's Five Forces Analysis you’ll receive after purchase—fully formatted and ready to use. It contains the complete competitive assessment, threats and bargaining power insights, and strategic implications as presented here. No mockups or placeholders; once you buy, you’ll get instant access to this same document.
Description
From Overview to Strategy Blueprint
AMP’s Porter’s Five Forces highlights key competitive pressures—buyer and supplier power, entrant threats, substitutes and rivalry—that shape its strategic choices. This snapshot flags high-impact areas and potential vulnerabilities. The full report quantifies each force, offers visuals and implications. Unlock the complete analysis to inform investment or strategic decisions.
Suppliers Bargaining Power
Wholesale funding dependence
AMP relies heavily on wholesale markets and institutional lenders to fund banking and investment activities; wholesale funding made up about 38% of total funding in FY2024, exposing the group to rate volatility and credit spread moves that can raise input costs and compress margins.
Diversified funding programs and 6% deposit growth in 2024 reduced concentration risk, but rapid shifts in RBA policy (cash rate ~4.35% through mid-2024) can quickly swing supplier leverage.
Technology and platform vendors
Core banking, advice platforms and cybersecurity vendors (eg Temenos with 3,000+ bank customers) hold strong leverage because switching involves deep integration, extended timelines and costs; SLAs matter — 99.9% uptime equals ~8.76 hours downtime/year versus 99.99% equals ~52.6 minutes. Multi-vendor architectures and open APIs reduce vendor lock-in. Service-level reliability directly affects client experience and regulatory compliance.
Asset managers and research providers
External managers, index providers and research houses drive product costs and outcomes; for example BlackRock surpassed about $10.5 trillion AUM in 2024 while the top three ETF/index providers control roughly 70% of US ETF flows, allowing brand-name managers to command higher fees and distribution terms. AMP can leverage internal capabilities and open-architecture to negotiate terms, with performance dispersion over time shifting supplier bargaining power.
Data, market infrastructure, and custodians
Exchanges, data feeds, and custodial banks are core to AMP operations, with Bloomberg and Refinitiv remaining dominant market-data suppliers in 2024, strengthening supplier leverage.
Oligopolistic pricing for market data and real-time feeds elevates supplier power, while long-term custody contracts create multi-year operational dependence.
Regulatory reporting demands (MiFID II, SEC rules) in 2024 increased reliance on high-quality data and reconciliation services.
- Market-data concentration: Bloomberg/Refinitiv dominant in 2024
- Custody lock-in: multi-year contracts common
- Regulation: MiFID II/SEC rules drive data quality needs
Adviser networks and distribution partners
Aligned and independent advisers both steer client flows into AMP products, with top 10% high-performing practices able to negotiate materially better economics and service SLAs based on scale and retention.
Rising compliance and licensing costs through 2024 have concentrated bargaining power among larger licensees and dealer groups, while AMP’s expanding digital direct channels (c.15% of gross flows in 2024) partially offset adviser leverage.
- Adviser influence on flows
- Top practices negotiate better terms
- Compliance consolidates bargaining power
- Digital channels ~15% of flows (2024)
Suppliers exert moderate-high power: wholesale funding 38%, digital flows 15%
Suppliers exert moderate-to-high power: wholesale funding was 38% of funding in FY2024 and is rate-sensitive (RBA cash rate ~4.35% mid-2024). Market-data and custody (Bloomberg/Refinitiv dominant) create oligopolistic leverage. External managers (BlackRock ~$10.5tn AUM) and top advisers extract premium terms, while AMP’s digital channels (~15% flows) and internal capabilities partially offset supplier bargaining power.
| Supplier | 2024 metric | Impact |
|---|---|---|
| Wholesale funding | 38% of funding | High rate/credit sensitivity |
| Market data/custody | Bloomberg/Refinitiv dominant | Oligopoly pricing |
| Digital channels | ~15% flows | Reduces adviser leverage |
What is included in the product
Detailed Word Document
Concise Porter’s Five Forces analysis tailored to AMP, uncovering competitive drivers, buyer and supplier power, entry barriers, substitutes, and emerging threats to its market share; includes strategic commentary and editable format for integration into investor materials or strategy decks.
Customizable Excel Spreadsheet
A single-sheet AMP Porter's Five Forces tool that visualizes competitive pressure with a spider chart and lets you tweak inputs to model scenarios—ideal for fast strategic decisions and slide-ready summaries.
Customers Bargaining Power
Price-sensitive retail investors
Transparent fees and plentiful low-cost alternatives heighten price pressure on AMP; global ETF assets topped about US$13 trillion in 2024, anchoring customer fee expectations. AMP must explicitly justify advice and platform fees with demonstrable outcomes and tools. Online onboarding and portability rules shorten switching to hours–days, making investor churn easier.
Superannuation members
Superannuation members wield growing bargaining power as APRAs MySuper heatmap and 2024 regulatory focus amplify fee and performance scrutiny; Australia’s super system held about A$3.7 trillion in 2024, raising the stakes. Members can easily switch funds, increasing churn risk if AMP trails peers on returns. Default arrangements still aid retention but face tighter oversight. Retirement-phase members demand stronger income certainty and guaranteed outcomes.
High-net-worth and advised clients
According to 2024 reports, high-net-worth clients control tens of trillions in investable wealth and increasingly demand bespoke advice, tax efficiency, and alternative access to private markets. They routinely negotiate fees tied to wallet size and performance alignment, driving margin pressure for providers. Strong service quality and trusted relationships materially reduce price sensitivity and churn. Platform breadth and exclusive offerings significantly increase retention and share of wallet.
Corporate and institutional mandates
Corporate and institutional mandates drive aggressive RFPs where scale matters: Australia’s superannuation pool reached about A$3.5 trillion in 2024, letting large clients extract lower fees and bespoke services. Performance, detailed reporting and ESG integration are baseline expectations, and multi-manager portability and platform solutions materially reduce switching costs, strengthening customer bargaining power.
- RFP frequency: high among top-tier mandates
- Scale leverage: large clients win fee concessions
- Table stakes: performance, reporting, ESG
- Switching: multi-manager portability lowers barriers
SMEs and mortgage customers
Business owners and mortgage borrowers increasingly shop rates via banks and brokers; in 2024 about 65% used comparison tools, compressing spreads and pushing average bank mortgage margins toward ~1.2–1.5 percentage points. Cross-sell (insurance, deposits) helps offset margin pressure. Turnaround speed and digital service are decisive differentiators.
- ~65% use comparison tools (2024)
- Margins ~1.2–1.5pp
- Cross-sell lifts lifetime value
- Digital turnaround drives win rates
Low-cost ETFs and mobile switching force funds to prove value as fee scrutiny intensifies
Transparent fees and abundant low-cost alternatives (global ETF assets ~US$13trn in 2024) increase price sensitivity and force AMP to justify advice/platform fees with measurable outcomes. Super members (Australia super ~A$3.7trn in 2024) can switch easily, amplifying churn risk; default status aids retention but scrutiny is rising. HNW and institutional clients demand bespoke terms, driving fee concessions and RFP frequency.
| Metric | 2024 Value |
|---|---|
| Global ETF assets | ~US$13trn |
| Australia super pool | ~A$3.7trn |
| Consumers using comparison tools | ~65% |
| Bank mortgage margins | ~1.2–1.5pp |
Preview the Actual Deliverable
AMP Porter's Five Forces Analysis
This preview is the exact AMP Porter's Five Forces Analysis you’ll receive after purchase—fully formatted and ready to use. It contains the complete competitive assessment, threats and bargaining power insights, and strategic implications as presented here. No mockups or placeholders; once you buy, you’ll get instant access to this same document.











