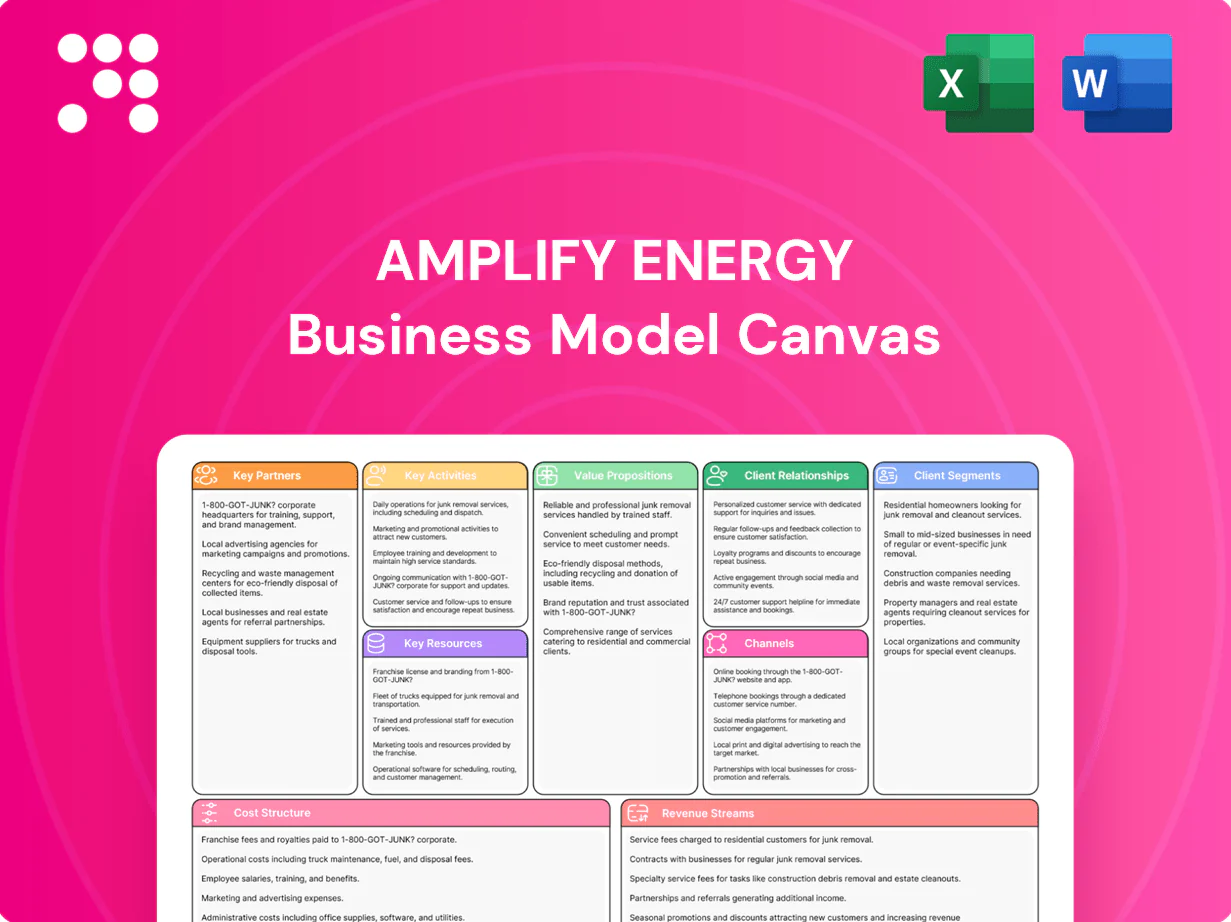
Amplify Energy Business Model Canvas

Discover a concise Business Model Canvas for upstream and midstream energy value creation
Discover how Amplify Energy creates value across upstream and midstream operations with a concise Business Model Canvas that maps customer segments, revenue streams, and key partnerships. This snapshot highlights strategic priorities, scalability levers, and cost drivers. Ideal for investors and strategists seeking a practical playbook. Purchase the full Canvas for a downloadable, section-by-section blueprint.
Partnerships

Midstream and pipeline operators
Access to gathering, processing, and transportation is critical for moving oil, gas, and NGLs to market, and partnerships with midstream and pipeline operators reduce bottlenecks and shrink basis differentials. Priority capacity and favorable tariffs directly improve netbacks by securing outflow and lowering transportation costs. Coordinated maintenance schedules minimize downtime and flaring, preserving volumes and regulatory compliance.
Oilfield services and equipment vendors
Reliable OFS partners enable efficient workovers, recompletions and integrity projects, supporting recovery uplifts of 5–12% seen in 2024 field trials. Preferred pricing and SLAs have cut LOE roughly 10% for operators. Technology-enabled vendors reduced non-productive time by up to 30% in 2024 pilots. Local crews across OK, TX, LA and CA shorten response times to under 24 hours.

Financial institutions and hedge counterparties
Reserve-based lenders and swap counterparties provide liquidity cushions that stabilize Amplify Energy cash flows, with commodity hedges protecting revenues amid a 2024 WTI average near $78/bbl. Hedging partnerships manage price volatility through swaps and collars, reducing earnings variability while preserving upside. Letters of credit and trade finance back marketing commitments and lift working capital. Structured products can cap downside exposures while enabling participation in upside movements.

Regulators, landowners, and mineral-rights holders
Positive relationships with regulators, landowners, and mineral-rights holders secure permits, access, and social license to operate; clear communication reduces regulatory friction and delays while alignment on compliance lowers legal and environmental risk. Surface and mineral agreements ensure continuity for development plans and asset value retention. Strong, documented partnerships support timely project execution and risk mitigation.
- permits & access secured
- reduced regulatory delays
- surface/mineral continuity
- compliance-driven risk reduction
Technology and data providers
Midstream +3 USD/bbl; LOE -10% NPT -30% prod +5-10%
Midstream partnerships secure capacity and cut transport costs, improving netbacks by ~3 USD/bbl in 2024. OFS and local crews lowered LOE ~10% and reduced NPT by up to 30% in 2024 pilots. Tech, lenders and hedges (2024 WTI avg ~78 USD/bbl) delivered 5–10% production uplift, stabilized cashflow and cut earnings volatility.
| Partner type | Primary benefit | 2024 impact |
|---|---|---|
| Midstream | Lower transport/basis | +3 USD/bbl netback |
| OFS/local crews | Ops efficiency | LOE −10%, NPT −30% |
| Tech/finance | Prod & cash stability | Prod +5–10%, WTI 78 USD |
What is included in the product
 Detailed Word Document
A comprehensive Business Model Canvas for Amplify Energy detailing customer segments, channels, value propositions, revenue streams, key partners, activities, resources, cost structure and distribution; reflects real-world operations, includes competitive advantages and SWOT insights, and is tailored for investor presentations and strategic analysis.

 Customizable Excel Spreadsheet
Condenses Amplify Energy’s strategic and operational elements into a clean, editable one-page canvas—ideal for quickly identifying pain points, aligning teams, and speeding decision-making.
Activities

Operations and production optimization
In 2024 Amplify Energy concentrated daily field operations on maximizing uptime, artificial lift tuning, and active decline management. Continuous surveillance pinpoints underperforming wells for rapid remedial interventions. Targeted chemical programs and flow-assurance work sustain throughput across gathering systems. Ongoing continuous-improvement initiatives drive reductions in LOE per BOE.
Workovers and recompletions
Systematic workover programs target mature wells to unlock low-risk barrels, typically yielding 5–15% incremental recoverable volumes per well in 2024 deployments. Zonal recompletions and stimulation improved near-term recovery factors, often boosting production rates by 10–40% on recompleted intervals. Tubular integrity campaigns and lift upgrades extended well life by 2–5 years while reducing intervention frequency. Rig scheduling and batching cut idle time roughly 20%, lowering per-well capital spend by ~15%.

Reservoir management and planning
Integrated geoscience and engineering steer depletion strategy, using data-driven type curves and PDP analytics to size 2024 capex and prioritize high-IRR wells; first-year decline for tight plays typically runs 40–60%, guiding hedged spend. Secondary recovery and pressure maintenance are modeled to deliver 10–30% EUR uplift where viable. Area development plans sequence projects to flatten production profile and optimize cash flow timing.

Acquisitions and portfolio optimization
Acquisitions focus on conventional, cash-generative assets while divestitures prune non-core properties to sharpen portfolio focus; synergy capture arises from operating overlap and shared infrastructure access, and disciplined post-close integration accelerates value creation.
- Target: cash-generative conventional assets
- Divest: non-core pruning
- Synergies: ops overlap + infrastructure
- Integration: rapid post-close value capture
Hedging, compliance, and HSE
Hedging locks margins and protects debt covenants by stabilizing cash flows against oil price swings; Amplify’s 2021 Huntington Beach spill (~25,000 gallons) highlighted the balance between price risk and operational risk. Regulatory compliance secures permits, reporting, and safety standards, while environmental programs target emissions and spill reduction. Ongoing training and audits reinforce a strong safety culture and continual improvement.
- Hedging: stabilizes cash flow, protects covenants
- Compliance: permits, reporting, safety standards
- Environmental: spill/emission reduction (Huntington Beach ~25,000 gal)
- Training/Audits: embed safety culture
Tuning, rig batching cut costs ~15% and drove 10–40% production gains
Daily ops focused on uptime, artificial lift tuning, decline management; workovers delivered 5–15% incremental recoverables and recompletions raised rates 10–40% in 2024. Depletion modelling (first-year declines 40–60% for tight plays) guided capex and sequencing; rig batching cut idle time ~20%, lowering per-well spend ~15%. Hedging stabilized cash flows; Huntington Beach spill ~25,000 gal underscored compliance and emissions focus.
| Metric | 2024 |
|---|---|
| Workover uplift | 5–15% |
| Recompletion rate gains | 10–40% |
| First-year decline (tight) | 40–60% |
| Rig idle reduction | ~20% |
| Per-well capex | ~15% lower |
What You See Is What You Get
Business Model Canvas
The document you’re previewing is the actual Amplify Energy Business Model Canvas you’ll receive—no mockups or samples—showing real content and layout exactly as in the final file. Upon purchase you’ll get this same complete, editable document ready for download and use.

Discover a concise Business Model Canvas for upstream and midstream energy value creation
Discover how Amplify Energy creates value across upstream and midstream operations with a concise Business Model Canvas that maps customer segments, revenue streams, and key partnerships. This snapshot highlights strategic priorities, scalability levers, and cost drivers. Ideal for investors and strategists seeking a practical playbook. Purchase the full Canvas for a downloadable, section-by-section blueprint.
Partnerships
Midstream and pipeline operators
Access to gathering, processing, and transportation is critical for moving oil, gas, and NGLs to market, and partnerships with midstream and pipeline operators reduce bottlenecks and shrink basis differentials. Priority capacity and favorable tariffs directly improve netbacks by securing outflow and lowering transportation costs. Coordinated maintenance schedules minimize downtime and flaring, preserving volumes and regulatory compliance.
Oilfield services and equipment vendors
Reliable OFS partners enable efficient workovers, recompletions and integrity projects, supporting recovery uplifts of 5–12% seen in 2024 field trials. Preferred pricing and SLAs have cut LOE roughly 10% for operators. Technology-enabled vendors reduced non-productive time by up to 30% in 2024 pilots. Local crews across OK, TX, LA and CA shorten response times to under 24 hours.
Financial institutions and hedge counterparties
Reserve-based lenders and swap counterparties provide liquidity cushions that stabilize Amplify Energy cash flows, with commodity hedges protecting revenues amid a 2024 WTI average near $78/bbl. Hedging partnerships manage price volatility through swaps and collars, reducing earnings variability while preserving upside. Letters of credit and trade finance back marketing commitments and lift working capital. Structured products can cap downside exposures while enabling participation in upside movements.
Regulators, landowners, and mineral-rights holders
Positive relationships with regulators, landowners, and mineral-rights holders secure permits, access, and social license to operate; clear communication reduces regulatory friction and delays while alignment on compliance lowers legal and environmental risk. Surface and mineral agreements ensure continuity for development plans and asset value retention. Strong, documented partnerships support timely project execution and risk mitigation.
- permits & access secured
- reduced regulatory delays
- surface/mineral continuity
- compliance-driven risk reduction
Technology and data providers
Midstream +3 USD/bbl; LOE -10% NPT -30% prod +5-10%
Midstream partnerships secure capacity and cut transport costs, improving netbacks by ~3 USD/bbl in 2024. OFS and local crews lowered LOE ~10% and reduced NPT by up to 30% in 2024 pilots. Tech, lenders and hedges (2024 WTI avg ~78 USD/bbl) delivered 5–10% production uplift, stabilized cashflow and cut earnings volatility.
| Partner type | Primary benefit | 2024 impact |
|---|---|---|
| Midstream | Lower transport/basis | +3 USD/bbl netback |
| OFS/local crews | Ops efficiency | LOE −10%, NPT −30% |
| Tech/finance | Prod & cash stability | Prod +5–10%, WTI 78 USD |
What is included in the product
Detailed Word Document
A comprehensive Business Model Canvas for Amplify Energy detailing customer segments, channels, value propositions, revenue streams, key partners, activities, resources, cost structure and distribution; reflects real-world operations, includes competitive advantages and SWOT insights, and is tailored for investor presentations and strategic analysis.
Customizable Excel Spreadsheet
Condenses Amplify Energy’s strategic and operational elements into a clean, editable one-page canvas—ideal for quickly identifying pain points, aligning teams, and speeding decision-making.
Activities
Operations and production optimization
In 2024 Amplify Energy concentrated daily field operations on maximizing uptime, artificial lift tuning, and active decline management. Continuous surveillance pinpoints underperforming wells for rapid remedial interventions. Targeted chemical programs and flow-assurance work sustain throughput across gathering systems. Ongoing continuous-improvement initiatives drive reductions in LOE per BOE.
Workovers and recompletions
Systematic workover programs target mature wells to unlock low-risk barrels, typically yielding 5–15% incremental recoverable volumes per well in 2024 deployments. Zonal recompletions and stimulation improved near-term recovery factors, often boosting production rates by 10–40% on recompleted intervals. Tubular integrity campaigns and lift upgrades extended well life by 2–5 years while reducing intervention frequency. Rig scheduling and batching cut idle time roughly 20%, lowering per-well capital spend by ~15%.
Reservoir management and planning
Integrated geoscience and engineering steer depletion strategy, using data-driven type curves and PDP analytics to size 2024 capex and prioritize high-IRR wells; first-year decline for tight plays typically runs 40–60%, guiding hedged spend. Secondary recovery and pressure maintenance are modeled to deliver 10–30% EUR uplift where viable. Area development plans sequence projects to flatten production profile and optimize cash flow timing.
Acquisitions and portfolio optimization
Acquisitions focus on conventional, cash-generative assets while divestitures prune non-core properties to sharpen portfolio focus; synergy capture arises from operating overlap and shared infrastructure access, and disciplined post-close integration accelerates value creation.
- Target: cash-generative conventional assets
- Divest: non-core pruning
- Synergies: ops overlap + infrastructure
- Integration: rapid post-close value capture
Hedging, compliance, and HSE
Hedging locks margins and protects debt covenants by stabilizing cash flows against oil price swings; Amplify’s 2021 Huntington Beach spill (~25,000 gallons) highlighted the balance between price risk and operational risk. Regulatory compliance secures permits, reporting, and safety standards, while environmental programs target emissions and spill reduction. Ongoing training and audits reinforce a strong safety culture and continual improvement.
- Hedging: stabilizes cash flow, protects covenants
- Compliance: permits, reporting, safety standards
- Environmental: spill/emission reduction (Huntington Beach ~25,000 gal)
- Training/Audits: embed safety culture
Tuning, rig batching cut costs ~15% and drove 10–40% production gains
Daily ops focused on uptime, artificial lift tuning, decline management; workovers delivered 5–15% incremental recoverables and recompletions raised rates 10–40% in 2024. Depletion modelling (first-year declines 40–60% for tight plays) guided capex and sequencing; rig batching cut idle time ~20%, lowering per-well spend ~15%. Hedging stabilized cash flows; Huntington Beach spill ~25,000 gal underscored compliance and emissions focus.
| Metric | 2024 |
|---|---|
| Workover uplift | 5–15% |
| Recompletion rate gains | 10–40% |
| First-year decline (tight) | 40–60% |
| Rig idle reduction | ~20% |
| Per-well capex | ~15% lower |
What You See Is What You Get
Business Model Canvas
The document you’re previewing is the actual Amplify Energy Business Model Canvas you’ll receive—no mockups or samples—showing real content and layout exactly as in the final file. Upon purchase you’ll get this same complete, editable document ready for download and use.
Original: $10.00
-65%$10.00
$3.50Description
Discover a concise Business Model Canvas for upstream and midstream energy value creation
Discover how Amplify Energy creates value across upstream and midstream operations with a concise Business Model Canvas that maps customer segments, revenue streams, and key partnerships. This snapshot highlights strategic priorities, scalability levers, and cost drivers. Ideal for investors and strategists seeking a practical playbook. Purchase the full Canvas for a downloadable, section-by-section blueprint.
Partnerships
Midstream and pipeline operators
Access to gathering, processing, and transportation is critical for moving oil, gas, and NGLs to market, and partnerships with midstream and pipeline operators reduce bottlenecks and shrink basis differentials. Priority capacity and favorable tariffs directly improve netbacks by securing outflow and lowering transportation costs. Coordinated maintenance schedules minimize downtime and flaring, preserving volumes and regulatory compliance.
Oilfield services and equipment vendors
Reliable OFS partners enable efficient workovers, recompletions and integrity projects, supporting recovery uplifts of 5–12% seen in 2024 field trials. Preferred pricing and SLAs have cut LOE roughly 10% for operators. Technology-enabled vendors reduced non-productive time by up to 30% in 2024 pilots. Local crews across OK, TX, LA and CA shorten response times to under 24 hours.
Financial institutions and hedge counterparties
Reserve-based lenders and swap counterparties provide liquidity cushions that stabilize Amplify Energy cash flows, with commodity hedges protecting revenues amid a 2024 WTI average near $78/bbl. Hedging partnerships manage price volatility through swaps and collars, reducing earnings variability while preserving upside. Letters of credit and trade finance back marketing commitments and lift working capital. Structured products can cap downside exposures while enabling participation in upside movements.
Regulators, landowners, and mineral-rights holders
Positive relationships with regulators, landowners, and mineral-rights holders secure permits, access, and social license to operate; clear communication reduces regulatory friction and delays while alignment on compliance lowers legal and environmental risk. Surface and mineral agreements ensure continuity for development plans and asset value retention. Strong, documented partnerships support timely project execution and risk mitigation.
- permits & access secured
- reduced regulatory delays
- surface/mineral continuity
- compliance-driven risk reduction
Technology and data providers
Midstream +3 USD/bbl; LOE -10% NPT -30% prod +5-10%
Midstream partnerships secure capacity and cut transport costs, improving netbacks by ~3 USD/bbl in 2024. OFS and local crews lowered LOE ~10% and reduced NPT by up to 30% in 2024 pilots. Tech, lenders and hedges (2024 WTI avg ~78 USD/bbl) delivered 5–10% production uplift, stabilized cashflow and cut earnings volatility.
| Partner type | Primary benefit | 2024 impact |
|---|---|---|
| Midstream | Lower transport/basis | +3 USD/bbl netback |
| OFS/local crews | Ops efficiency | LOE −10%, NPT −30% |
| Tech/finance | Prod & cash stability | Prod +5–10%, WTI 78 USD |
What is included in the product
Detailed Word Document
A comprehensive Business Model Canvas for Amplify Energy detailing customer segments, channels, value propositions, revenue streams, key partners, activities, resources, cost structure and distribution; reflects real-world operations, includes competitive advantages and SWOT insights, and is tailored for investor presentations and strategic analysis.
Customizable Excel Spreadsheet
Condenses Amplify Energy’s strategic and operational elements into a clean, editable one-page canvas—ideal for quickly identifying pain points, aligning teams, and speeding decision-making.
Activities
Operations and production optimization
In 2024 Amplify Energy concentrated daily field operations on maximizing uptime, artificial lift tuning, and active decline management. Continuous surveillance pinpoints underperforming wells for rapid remedial interventions. Targeted chemical programs and flow-assurance work sustain throughput across gathering systems. Ongoing continuous-improvement initiatives drive reductions in LOE per BOE.
Workovers and recompletions
Systematic workover programs target mature wells to unlock low-risk barrels, typically yielding 5–15% incremental recoverable volumes per well in 2024 deployments. Zonal recompletions and stimulation improved near-term recovery factors, often boosting production rates by 10–40% on recompleted intervals. Tubular integrity campaigns and lift upgrades extended well life by 2–5 years while reducing intervention frequency. Rig scheduling and batching cut idle time roughly 20%, lowering per-well capital spend by ~15%.
Reservoir management and planning
Integrated geoscience and engineering steer depletion strategy, using data-driven type curves and PDP analytics to size 2024 capex and prioritize high-IRR wells; first-year decline for tight plays typically runs 40–60%, guiding hedged spend. Secondary recovery and pressure maintenance are modeled to deliver 10–30% EUR uplift where viable. Area development plans sequence projects to flatten production profile and optimize cash flow timing.
Acquisitions and portfolio optimization
Acquisitions focus on conventional, cash-generative assets while divestitures prune non-core properties to sharpen portfolio focus; synergy capture arises from operating overlap and shared infrastructure access, and disciplined post-close integration accelerates value creation.
- Target: cash-generative conventional assets
- Divest: non-core pruning
- Synergies: ops overlap + infrastructure
- Integration: rapid post-close value capture
Hedging, compliance, and HSE
Hedging locks margins and protects debt covenants by stabilizing cash flows against oil price swings; Amplify’s 2021 Huntington Beach spill (~25,000 gallons) highlighted the balance between price risk and operational risk. Regulatory compliance secures permits, reporting, and safety standards, while environmental programs target emissions and spill reduction. Ongoing training and audits reinforce a strong safety culture and continual improvement.
- Hedging: stabilizes cash flow, protects covenants
- Compliance: permits, reporting, safety standards
- Environmental: spill/emission reduction (Huntington Beach ~25,000 gal)
- Training/Audits: embed safety culture
Tuning, rig batching cut costs ~15% and drove 10–40% production gains
Daily ops focused on uptime, artificial lift tuning, decline management; workovers delivered 5–15% incremental recoverables and recompletions raised rates 10–40% in 2024. Depletion modelling (first-year declines 40–60% for tight plays) guided capex and sequencing; rig batching cut idle time ~20%, lowering per-well spend ~15%. Hedging stabilized cash flows; Huntington Beach spill ~25,000 gal underscored compliance and emissions focus.
| Metric | 2024 |
|---|---|
| Workover uplift | 5–15% |
| Recompletion rate gains | 10–40% |
| First-year decline (tight) | 40–60% |
| Rig idle reduction | ~20% |
| Per-well capex | ~15% lower |
What You See Is What You Get
Business Model Canvas
The document you’re previewing is the actual Amplify Energy Business Model Canvas you’ll receive—no mockups or samples—showing real content and layout exactly as in the final file. Upon purchase you’ll get this same complete, editable document ready for download and use.











