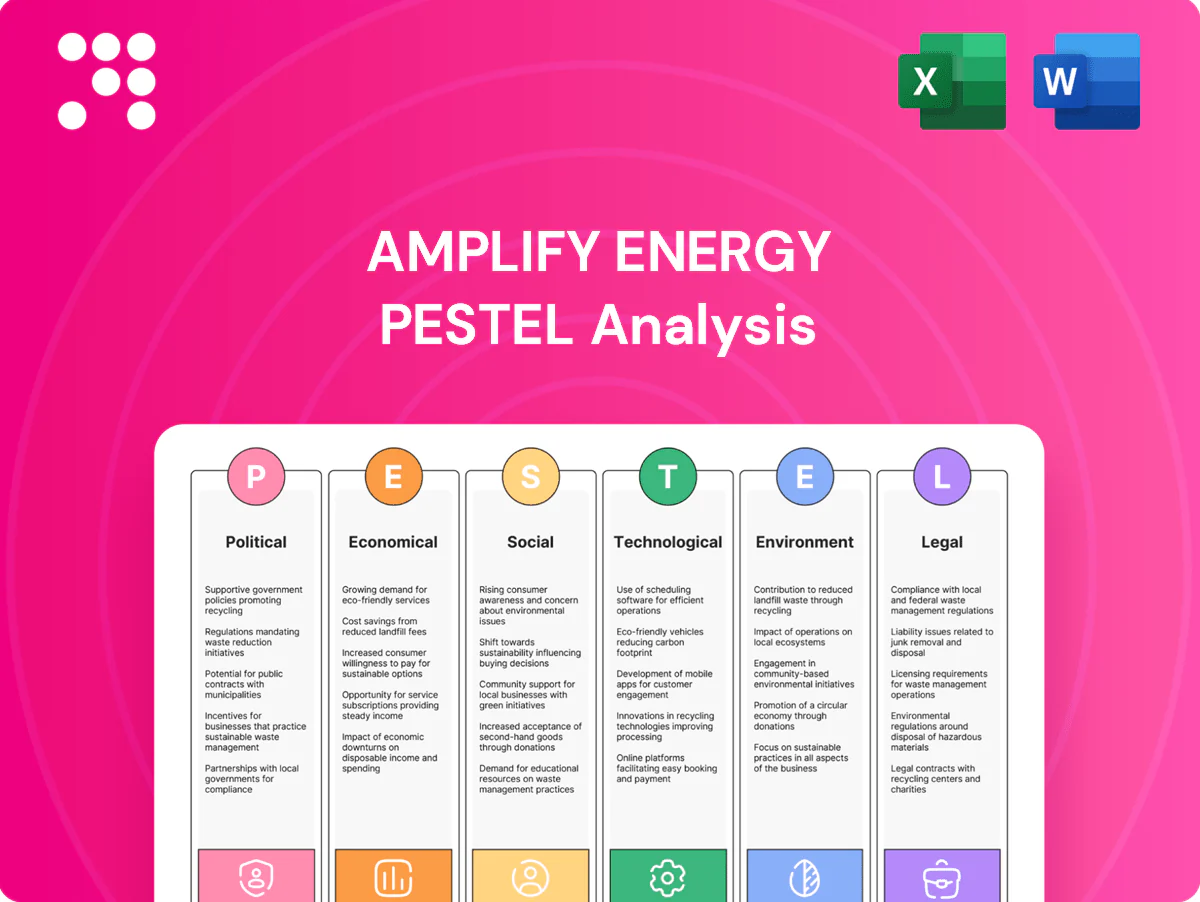
Amplify Energy PESTLE Analysis

Plan Smarter. Present Sharper. Compete Stronger.
Gain a strategic advantage with our PESTLE analysis of Amplify Energy, highlighting political, environmental, and regulatory forces shaping operations. Packed with actionable insights for investors and strategists, it reveals risks and growth levers. Purchase the full report to download comprehensive, ready-to-use findings.
Political factors

Federal energy policy swings
Federal administration changes can swing priorities between fossil fuel development and decarbonization, affecting permitting timelines, leasing access and midstream approvals; US crude production averaged about 12.9 million b/d in 2024, underscoring ongoing industry scale. EPA finalized methane and VOC New Source Performance Standards in September 2023, which still apply to onshore operators. Amplify’s mature onshore focus lowers exposure to federal leasing volatility but not to EPA rulemaking or methane policy shifts, so scenario analyses across policy regimes are essential.
State-level divergence (CA vs. OK/TX/LA)
California’s stricter stance—SB 1137 and related rules imposing ~3,200 ft setbacks and tightening methane/air limits—contrasts with more supportive regimes in Oklahoma, Texas and Louisiana, where 2024 Texas oil production was ~5.5 mb/d and permitting is faster. This divergence changes development optionality, raises operating costs and can erode social license in CA versus higher netbacks in Gulf/Plains basins. Asset allocation must weigh regulatory friction against realized netbacks and reserve valuations. A bifurcated compliance strategy preserves flexibility across jurisdictions.

Infrastructure and permitting politics
Pipelines, disposal wells and gathering systems for Amplify Energy face heightened political scrutiny that can delay projects by 12–24 months and add millions in incremental capex. Local and county authorities frequently layer approvals on top of state oversight, increasing administrative risk. Upgrades in mature fields depend on a predictable permitting cadence to protect cash flow and reserve recovery. Early stakeholder engagement has proven to reduce political bottlenecks and shorten timelines.

Fiscal incentives and royalties
Tax credits, depletion allowances and state incentives materially affect project economics; the federal corporate tax rate is 21% and royalty frameworks differ by private, state or federal land.
Potential increases in severance taxes or ad valorem adjustments can erode margins; Amplify benefits from optimizing leases and advocating for stable fiscal terms.
- federal tax: 21%
- royalties vary by land ownership
- lease optimization reduces fiscal exposure
Energy security and grid reliability narratives
High-profile reliability events (eg ERCOT peak ~79 GW in Aug 2023) boost political support for domestic production; policymakers increasingly weigh transition targets against supply stability, shifting regulatory tone toward pragmatic permitting and reserve requirements. Mature conventional assets are framed as low‑risk backstops, and reliability-aligned messaging eases public acceptance of Amplify Energy operational plans.
- Policy pressure: higher after major outages
- Regulatory tilt: balancing decarbonization and reserves
- Asset framing: conventional = backstop
- Communications: reliability messaging aids approvals
EPA NSPS + 21% tax reshape permits; CA delays vs TX/OK/LA; pipelines add 12–24m
Federal shifts (EPA NSPS 2023) plus 21% federal tax shape Amplify’s permitting, capex and netbacks; US crude ~12.9 mb/d (2024) and Texas ~5.5 mb/d (2024). CA setbacks raise costs vs faster permitting in TX/OK/LA; pipeline/disposal approvals can add 12–24 month delays. Lease optimization and stakeholder engagement lower fiscal and political risk.
| Metric | Value |
|---|---|
| US crude 2024 | 12.9 mb/d |
| TX oil 2024 | 5.5 mb/d |
| Federal tax | 21% |
| Permitting delay | 12–24 months |
What is included in the product
 Detailed Word Document
Explores how macro-environmental factors uniquely affect Amplify Energy across Political, Economic, Social, Technological, Environmental, and Legal dimensions, with each section backed by current data and trends. Designed for executives, consultants, and investors to identify threats, opportunities, and forward-looking scenarios relevant to the company’s industry and region.

 Customizable Excel Spreadsheet
A concise, visually segmented PESTLE summary of Amplify Energy that streamlines external risk assessment for meetings and presentations, supports quick alignment across teams, and is easily annotated for region- or business-line–specific notes.
Economic factors

Commodity price volatility (WTI/HH)
Oil and gas price swings (WTI averaged about $80/bbl in 2024; Henry Hub ~ $3.00/MMBtu) drive cash flow for Amplify’s conventional assets, while hedging programs can stabilize EBITDA but cap upside during bull runs. Regional basis differentials — Permian differentials reaching $8–$12/bbl in 2024 — materially affect realized pricing. Disciplined hedge layering tied to decline profiles is essential to smooth cash flow and preserve upside optionality.
Service and labor cost cycles
Oilfield services and skilled labor tighten sharply in upcycles, pushing lifting and workover dayrates higher; the Baker Hughes U.S. rig count averaged about 600 rigs in 2024, signaling strong service demand. Mature fields depend on steady maintenance whose costs track volatile dayrates and contractor availability. Counter-cyclical contracting and vendor diversification preserved margins for many operators during 2022–24. Targeted automation reduced labor hours and mitigated wage inflation pressure.

Decline management and capital efficiency
Conventional reservoirs allow manageable declines when workovers and recompletions are timed to reservoir response, helping limit annual decline curves versus skyrocketing shale drops. Capital discipline—avoiding uneconomic late-life spending—preserves returns and protects balance sheets during 2024–25 price swings. Deploying bite-sized, high-IRR projects improves portfolio flexibility in volatile markets. Rigorous economic screening and portfolio pruning bolster free cash flow resilience.

Midstream access and differentials
Midstream gathering, processing and disposal capacity drive uptime and netbacks; 2024 regional constraints have periodically widened basis by roughly $5–$30 per barrel, forcing higher trucking or compression costs of about $2–$8/bbl and reducing realized margins. Long-term take-or-pay contracts require precise volume forecasting to avoid sunk fees; negotiating flexible, volume-flex or force majeure-protected midstream terms limits downside.
- impact: widened basis $5–$30/bbl
- costs: trucking/compression ~$2–$8/bbl
- risk: take-or-pay needs accurate forecasting
- mitigation: flexible midstream terms
Interest rates and balance sheet health
Higher policy rates (US fed funds 5.25–5.50% in mid‑2025) raise Amplify Energy’s borrowing costs and project hurdle rates, increasing sensitivity to oil price dips; liquidity and covenant headroom (cash, revolver availability) are critical to survive downturns. Prudent leverage and laddered debt enhance optionality for opportunistic acquisitions in mature basins.
- Higher rates: + borrowing costs
- Liquidity & covenants: survival buffer
- Prudent leverage: acquisition optionality
- Laddered debt: reduces refinancing risk
EPA NSPS + 21% tax reshape permits; CA delays vs TX/OK/LA; pipelines add 12–24m
WTI ~ $80/bbl (2024) and Henry Hub ~ $3/MMBtu drive cash flow; hedges smooth EBITDA but cap upside. Permian basis $8–$12/bbl and rig count ~600 (2024) materially affect realized pricing and service costs. Midstream constraints widened basis $5–$30/bbl, adding ~$2–$8/bbl trucking/compression. Fed funds 5.25–5.50% (mid‑2025) raises borrowing costs, making liquidity and low leverage critical.
| Metric | Value |
|---|---|
| WTI (2024) | $80/bbl |
| Henry Hub | $3/MMBtu |
| Permian diff | $8–$12/bbl |
| US rig count (2024) | ~600 |
| Fed funds (mid‑2025) | 5.25–5.50% |
Preview Before You Purchase
Amplify Energy PESTLE Analysis
The preview shown here is the exact Amplify Energy PESTLE Analysis you’ll receive after purchase—fully formatted and ready to use. The layout, content, and structure visible are identical to the downloadable file. No placeholders or teasers—this is the finished, professionally structured document.

Plan Smarter. Present Sharper. Compete Stronger.
Gain a strategic advantage with our PESTLE analysis of Amplify Energy, highlighting political, environmental, and regulatory forces shaping operations. Packed with actionable insights for investors and strategists, it reveals risks and growth levers. Purchase the full report to download comprehensive, ready-to-use findings.
Political factors
Federal energy policy swings
Federal administration changes can swing priorities between fossil fuel development and decarbonization, affecting permitting timelines, leasing access and midstream approvals; US crude production averaged about 12.9 million b/d in 2024, underscoring ongoing industry scale. EPA finalized methane and VOC New Source Performance Standards in September 2023, which still apply to onshore operators. Amplify’s mature onshore focus lowers exposure to federal leasing volatility but not to EPA rulemaking or methane policy shifts, so scenario analyses across policy regimes are essential.
State-level divergence (CA vs. OK/TX/LA)
California’s stricter stance—SB 1137 and related rules imposing ~3,200 ft setbacks and tightening methane/air limits—contrasts with more supportive regimes in Oklahoma, Texas and Louisiana, where 2024 Texas oil production was ~5.5 mb/d and permitting is faster. This divergence changes development optionality, raises operating costs and can erode social license in CA versus higher netbacks in Gulf/Plains basins. Asset allocation must weigh regulatory friction against realized netbacks and reserve valuations. A bifurcated compliance strategy preserves flexibility across jurisdictions.
Infrastructure and permitting politics
Pipelines, disposal wells and gathering systems for Amplify Energy face heightened political scrutiny that can delay projects by 12–24 months and add millions in incremental capex. Local and county authorities frequently layer approvals on top of state oversight, increasing administrative risk. Upgrades in mature fields depend on a predictable permitting cadence to protect cash flow and reserve recovery. Early stakeholder engagement has proven to reduce political bottlenecks and shorten timelines.
Fiscal incentives and royalties
Tax credits, depletion allowances and state incentives materially affect project economics; the federal corporate tax rate is 21% and royalty frameworks differ by private, state or federal land.
Potential increases in severance taxes or ad valorem adjustments can erode margins; Amplify benefits from optimizing leases and advocating for stable fiscal terms.
- federal tax: 21%
- royalties vary by land ownership
- lease optimization reduces fiscal exposure
Energy security and grid reliability narratives
High-profile reliability events (eg ERCOT peak ~79 GW in Aug 2023) boost political support for domestic production; policymakers increasingly weigh transition targets against supply stability, shifting regulatory tone toward pragmatic permitting and reserve requirements. Mature conventional assets are framed as low‑risk backstops, and reliability-aligned messaging eases public acceptance of Amplify Energy operational plans.
- Policy pressure: higher after major outages
- Regulatory tilt: balancing decarbonization and reserves
- Asset framing: conventional = backstop
- Communications: reliability messaging aids approvals
EPA NSPS + 21% tax reshape permits; CA delays vs TX/OK/LA; pipelines add 12–24m
Federal shifts (EPA NSPS 2023) plus 21% federal tax shape Amplify’s permitting, capex and netbacks; US crude ~12.9 mb/d (2024) and Texas ~5.5 mb/d (2024). CA setbacks raise costs vs faster permitting in TX/OK/LA; pipeline/disposal approvals can add 12–24 month delays. Lease optimization and stakeholder engagement lower fiscal and political risk.
| Metric | Value |
|---|---|
| US crude 2024 | 12.9 mb/d |
| TX oil 2024 | 5.5 mb/d |
| Federal tax | 21% |
| Permitting delay | 12–24 months |
What is included in the product
Detailed Word Document
Explores how macro-environmental factors uniquely affect Amplify Energy across Political, Economic, Social, Technological, Environmental, and Legal dimensions, with each section backed by current data and trends. Designed for executives, consultants, and investors to identify threats, opportunities, and forward-looking scenarios relevant to the company’s industry and region.
Customizable Excel Spreadsheet
A concise, visually segmented PESTLE summary of Amplify Energy that streamlines external risk assessment for meetings and presentations, supports quick alignment across teams, and is easily annotated for region- or business-line–specific notes.
Economic factors
Commodity price volatility (WTI/HH)
Oil and gas price swings (WTI averaged about $80/bbl in 2024; Henry Hub ~ $3.00/MMBtu) drive cash flow for Amplify’s conventional assets, while hedging programs can stabilize EBITDA but cap upside during bull runs. Regional basis differentials — Permian differentials reaching $8–$12/bbl in 2024 — materially affect realized pricing. Disciplined hedge layering tied to decline profiles is essential to smooth cash flow and preserve upside optionality.
Service and labor cost cycles
Oilfield services and skilled labor tighten sharply in upcycles, pushing lifting and workover dayrates higher; the Baker Hughes U.S. rig count averaged about 600 rigs in 2024, signaling strong service demand. Mature fields depend on steady maintenance whose costs track volatile dayrates and contractor availability. Counter-cyclical contracting and vendor diversification preserved margins for many operators during 2022–24. Targeted automation reduced labor hours and mitigated wage inflation pressure.
Decline management and capital efficiency
Conventional reservoirs allow manageable declines when workovers and recompletions are timed to reservoir response, helping limit annual decline curves versus skyrocketing shale drops. Capital discipline—avoiding uneconomic late-life spending—preserves returns and protects balance sheets during 2024–25 price swings. Deploying bite-sized, high-IRR projects improves portfolio flexibility in volatile markets. Rigorous economic screening and portfolio pruning bolster free cash flow resilience.
Midstream access and differentials
Midstream gathering, processing and disposal capacity drive uptime and netbacks; 2024 regional constraints have periodically widened basis by roughly $5–$30 per barrel, forcing higher trucking or compression costs of about $2–$8/bbl and reducing realized margins. Long-term take-or-pay contracts require precise volume forecasting to avoid sunk fees; negotiating flexible, volume-flex or force majeure-protected midstream terms limits downside.
- impact: widened basis $5–$30/bbl
- costs: trucking/compression ~$2–$8/bbl
- risk: take-or-pay needs accurate forecasting
- mitigation: flexible midstream terms
Interest rates and balance sheet health
Higher policy rates (US fed funds 5.25–5.50% in mid‑2025) raise Amplify Energy’s borrowing costs and project hurdle rates, increasing sensitivity to oil price dips; liquidity and covenant headroom (cash, revolver availability) are critical to survive downturns. Prudent leverage and laddered debt enhance optionality for opportunistic acquisitions in mature basins.
- Higher rates: + borrowing costs
- Liquidity & covenants: survival buffer
- Prudent leverage: acquisition optionality
- Laddered debt: reduces refinancing risk
EPA NSPS + 21% tax reshape permits; CA delays vs TX/OK/LA; pipelines add 12–24m
WTI ~ $80/bbl (2024) and Henry Hub ~ $3/MMBtu drive cash flow; hedges smooth EBITDA but cap upside. Permian basis $8–$12/bbl and rig count ~600 (2024) materially affect realized pricing and service costs. Midstream constraints widened basis $5–$30/bbl, adding ~$2–$8/bbl trucking/compression. Fed funds 5.25–5.50% (mid‑2025) raises borrowing costs, making liquidity and low leverage critical.
| Metric | Value |
|---|---|
| WTI (2024) | $80/bbl |
| Henry Hub | $3/MMBtu |
| Permian diff | $8–$12/bbl |
| US rig count (2024) | ~600 |
| Fed funds (mid‑2025) | 5.25–5.50% |
Preview Before You Purchase
Amplify Energy PESTLE Analysis
The preview shown here is the exact Amplify Energy PESTLE Analysis you’ll receive after purchase—fully formatted and ready to use. The layout, content, and structure visible are identical to the downloadable file. No placeholders or teasers—this is the finished, professionally structured document.
Original: $10.00
-65%$10.00
$3.50Description
Plan Smarter. Present Sharper. Compete Stronger.
Gain a strategic advantage with our PESTLE analysis of Amplify Energy, highlighting political, environmental, and regulatory forces shaping operations. Packed with actionable insights for investors and strategists, it reveals risks and growth levers. Purchase the full report to download comprehensive, ready-to-use findings.
Political factors
Federal energy policy swings
Federal administration changes can swing priorities between fossil fuel development and decarbonization, affecting permitting timelines, leasing access and midstream approvals; US crude production averaged about 12.9 million b/d in 2024, underscoring ongoing industry scale. EPA finalized methane and VOC New Source Performance Standards in September 2023, which still apply to onshore operators. Amplify’s mature onshore focus lowers exposure to federal leasing volatility but not to EPA rulemaking or methane policy shifts, so scenario analyses across policy regimes are essential.
State-level divergence (CA vs. OK/TX/LA)
California’s stricter stance—SB 1137 and related rules imposing ~3,200 ft setbacks and tightening methane/air limits—contrasts with more supportive regimes in Oklahoma, Texas and Louisiana, where 2024 Texas oil production was ~5.5 mb/d and permitting is faster. This divergence changes development optionality, raises operating costs and can erode social license in CA versus higher netbacks in Gulf/Plains basins. Asset allocation must weigh regulatory friction against realized netbacks and reserve valuations. A bifurcated compliance strategy preserves flexibility across jurisdictions.
Infrastructure and permitting politics
Pipelines, disposal wells and gathering systems for Amplify Energy face heightened political scrutiny that can delay projects by 12–24 months and add millions in incremental capex. Local and county authorities frequently layer approvals on top of state oversight, increasing administrative risk. Upgrades in mature fields depend on a predictable permitting cadence to protect cash flow and reserve recovery. Early stakeholder engagement has proven to reduce political bottlenecks and shorten timelines.
Fiscal incentives and royalties
Tax credits, depletion allowances and state incentives materially affect project economics; the federal corporate tax rate is 21% and royalty frameworks differ by private, state or federal land.
Potential increases in severance taxes or ad valorem adjustments can erode margins; Amplify benefits from optimizing leases and advocating for stable fiscal terms.
- federal tax: 21%
- royalties vary by land ownership
- lease optimization reduces fiscal exposure
Energy security and grid reliability narratives
High-profile reliability events (eg ERCOT peak ~79 GW in Aug 2023) boost political support for domestic production; policymakers increasingly weigh transition targets against supply stability, shifting regulatory tone toward pragmatic permitting and reserve requirements. Mature conventional assets are framed as low‑risk backstops, and reliability-aligned messaging eases public acceptance of Amplify Energy operational plans.
- Policy pressure: higher after major outages
- Regulatory tilt: balancing decarbonization and reserves
- Asset framing: conventional = backstop
- Communications: reliability messaging aids approvals
EPA NSPS + 21% tax reshape permits; CA delays vs TX/OK/LA; pipelines add 12–24m
Federal shifts (EPA NSPS 2023) plus 21% federal tax shape Amplify’s permitting, capex and netbacks; US crude ~12.9 mb/d (2024) and Texas ~5.5 mb/d (2024). CA setbacks raise costs vs faster permitting in TX/OK/LA; pipeline/disposal approvals can add 12–24 month delays. Lease optimization and stakeholder engagement lower fiscal and political risk.
| Metric | Value |
|---|---|
| US crude 2024 | 12.9 mb/d |
| TX oil 2024 | 5.5 mb/d |
| Federal tax | 21% |
| Permitting delay | 12–24 months |
What is included in the product
Detailed Word Document
Explores how macro-environmental factors uniquely affect Amplify Energy across Political, Economic, Social, Technological, Environmental, and Legal dimensions, with each section backed by current data and trends. Designed for executives, consultants, and investors to identify threats, opportunities, and forward-looking scenarios relevant to the company’s industry and region.
Customizable Excel Spreadsheet
A concise, visually segmented PESTLE summary of Amplify Energy that streamlines external risk assessment for meetings and presentations, supports quick alignment across teams, and is easily annotated for region- or business-line–specific notes.
Economic factors
Commodity price volatility (WTI/HH)
Oil and gas price swings (WTI averaged about $80/bbl in 2024; Henry Hub ~ $3.00/MMBtu) drive cash flow for Amplify’s conventional assets, while hedging programs can stabilize EBITDA but cap upside during bull runs. Regional basis differentials — Permian differentials reaching $8–$12/bbl in 2024 — materially affect realized pricing. Disciplined hedge layering tied to decline profiles is essential to smooth cash flow and preserve upside optionality.
Service and labor cost cycles
Oilfield services and skilled labor tighten sharply in upcycles, pushing lifting and workover dayrates higher; the Baker Hughes U.S. rig count averaged about 600 rigs in 2024, signaling strong service demand. Mature fields depend on steady maintenance whose costs track volatile dayrates and contractor availability. Counter-cyclical contracting and vendor diversification preserved margins for many operators during 2022–24. Targeted automation reduced labor hours and mitigated wage inflation pressure.
Decline management and capital efficiency
Conventional reservoirs allow manageable declines when workovers and recompletions are timed to reservoir response, helping limit annual decline curves versus skyrocketing shale drops. Capital discipline—avoiding uneconomic late-life spending—preserves returns and protects balance sheets during 2024–25 price swings. Deploying bite-sized, high-IRR projects improves portfolio flexibility in volatile markets. Rigorous economic screening and portfolio pruning bolster free cash flow resilience.
Midstream access and differentials
Midstream gathering, processing and disposal capacity drive uptime and netbacks; 2024 regional constraints have periodically widened basis by roughly $5–$30 per barrel, forcing higher trucking or compression costs of about $2–$8/bbl and reducing realized margins. Long-term take-or-pay contracts require precise volume forecasting to avoid sunk fees; negotiating flexible, volume-flex or force majeure-protected midstream terms limits downside.
- impact: widened basis $5–$30/bbl
- costs: trucking/compression ~$2–$8/bbl
- risk: take-or-pay needs accurate forecasting
- mitigation: flexible midstream terms
Interest rates and balance sheet health
Higher policy rates (US fed funds 5.25–5.50% in mid‑2025) raise Amplify Energy’s borrowing costs and project hurdle rates, increasing sensitivity to oil price dips; liquidity and covenant headroom (cash, revolver availability) are critical to survive downturns. Prudent leverage and laddered debt enhance optionality for opportunistic acquisitions in mature basins.
- Higher rates: + borrowing costs
- Liquidity & covenants: survival buffer
- Prudent leverage: acquisition optionality
- Laddered debt: reduces refinancing risk
EPA NSPS + 21% tax reshape permits; CA delays vs TX/OK/LA; pipelines add 12–24m
WTI ~ $80/bbl (2024) and Henry Hub ~ $3/MMBtu drive cash flow; hedges smooth EBITDA but cap upside. Permian basis $8–$12/bbl and rig count ~600 (2024) materially affect realized pricing and service costs. Midstream constraints widened basis $5–$30/bbl, adding ~$2–$8/bbl trucking/compression. Fed funds 5.25–5.50% (mid‑2025) raises borrowing costs, making liquidity and low leverage critical.
| Metric | Value |
|---|---|
| WTI (2024) | $80/bbl |
| Henry Hub | $3/MMBtu |
| Permian diff | $8–$12/bbl |
| US rig count (2024) | ~600 |
| Fed funds (mid‑2025) | 5.25–5.50% |
Preview Before You Purchase
Amplify Energy PESTLE Analysis
The preview shown here is the exact Amplify Energy PESTLE Analysis you’ll receive after purchase—fully formatted and ready to use. The layout, content, and structure visible are identical to the downloadable file. No placeholders or teasers—this is the finished, professionally structured document.











