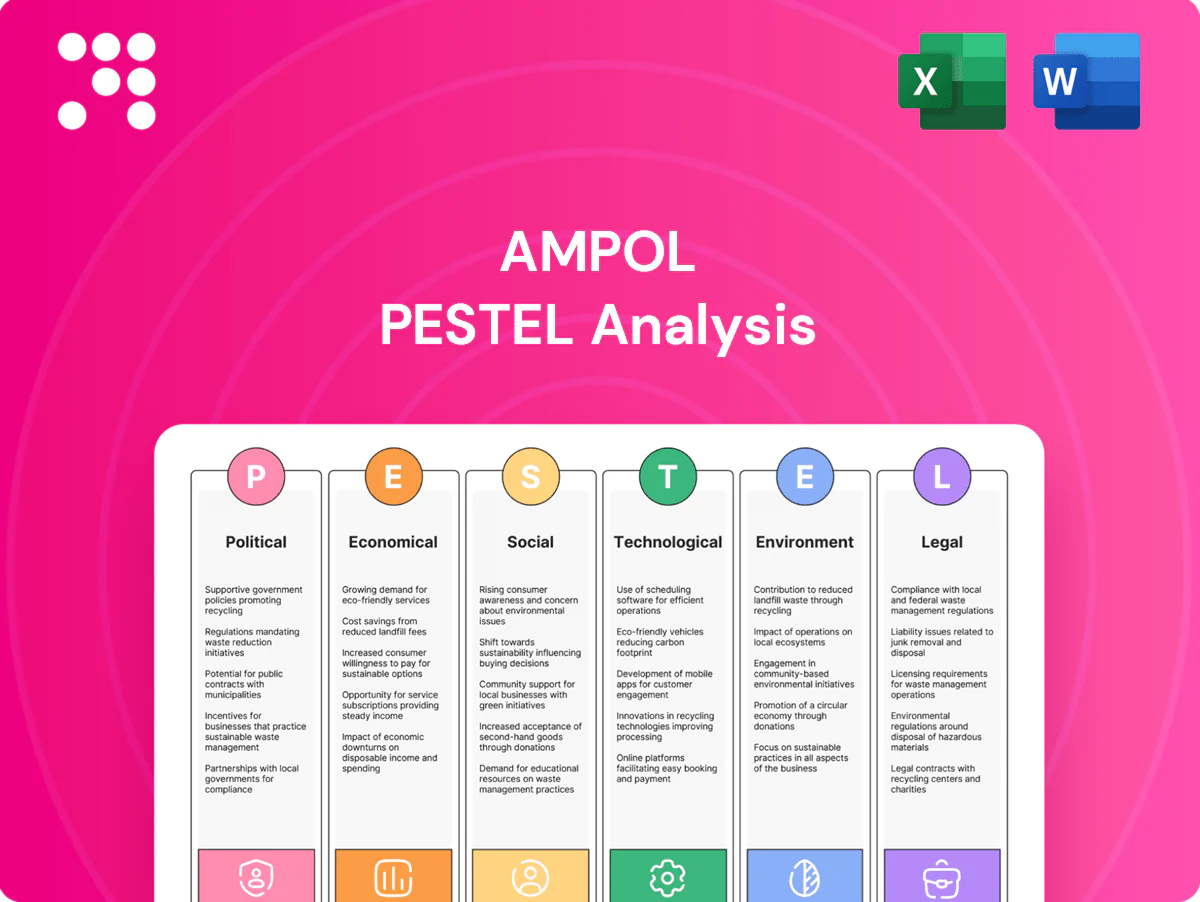
Ampol PESTLE Analysis

Skip the Research. Get the Strategy.
Unlock how political shifts, economic cycles, and environmental pressures are shaping Ampol’s strategic outlook in our concise PESTLE snapshot. Ideal for investors and strategists, this analysis highlights risks and opportunities you can act on today. Purchase the full PESTLE for detailed, ready-to-use insights and forecasts.
Political factors

Fuel excise and taxes
Australia’s fuel excise (currently 44.2 cents per litre) and past temporary cuts (notably the 22.1 c/L short-term cut in 2022) directly move pump prices and Ampol’s refined margins, with each 10 c/L swing changing retail pump prices materially and fuel gross margin volatility. Temporary excise cuts or indexation reinstatements can lift demand and compress or expand profitability; Ampol must use pricing strategies and hedges to cushion abrupt policy shifts and coordinate with government on pass-through timing to avoid margin lag.
Energy transition policy
Federal net-zero by 2050 and a 43% 2030 emissions target steer investment toward EV charging, biofuels and alternative energy in Australia.
Incentives or mandates can materially accelerate or undermine returns on new-energy projects, while policy clarity shapes capital allocation between refining, imports and low‑carbon solutions.
With EVs ~10% of new-car sales in 2024, Ampol’s credibility hinges on aligning with net-zero roadmaps.

Refining support and fuel security
Government schemes such as the National Fuel Security Framework and state-level refining support directly influence the economics of Ampol’s Lytton refinery by underpinning domestic refining margins and investment signals. Strategic stockholding rules require commercial holders to maintain minimum reserves, shaping working capital needs and storage capex for Ampol. Policy reversals or subsidy changes could compress refining margins or force supply-chain shifts, while active engagement with fuel security frameworks mitigates geopolitical supply risk.

Trade and geopolitics
Relations with key Asian suppliers, notably Singapore refiners, influence Ampol’s import costs and product availability; disruptions can raise costs and margins volatility. Sanctions and chokepoint risks—about 20% of seaborne oil trade transits the Strait of Hormuz—can abruptly disrupt crude and product flows. Tariff and non‑tariff barriers in ASEAN markets reduce sourcing flexibility, while Ampol’s diversified supply chains and active political‑risk monitoring mitigate exposure.
- Supplier concentration risk
- Strait of Hormoz ~20% seaborne oil
- Tariff/non‑tariff constraints
- Diversified sourcing & risk monitoring
State planning and local permits
State planning regimes materially affect Ampol’s station rollouts and upgrades across its ~1,900 Australian and New Zealand sites; local council approvals can add months to timelines for EV charger installs and store refurbishments. Community consultation often dictates site design and operating hours, and delays increase project costs and risk of lost retail and fuel margin revenue.
- Sites impacted: ~1,900
- Net-zero target: 2050
- Approvals can add months
- Delays = higher capex and lost margin
Policy swings and 44.2 c/L excise drive fuel price volatility and EV capex shift
Australia’s 44.2 c/L fuel excise and past 22.1 c/L cut drive pump-price and margin volatility; pricing/hedging needed to manage policy swings.
Net-zero by 2050 and 43% 2030 target shift capex to EV charging, biofuels and low‑carbon projects; EVs ~10% of new-car sales (2024).
~1,900 sites, supply risks via Strait of Hormuz (~20% seaborne oil) and ASEAN trade barriers make supply diversification and govt engagement essential.
| Metric | Value |
|---|---|
| Fuel excise | 44.2 c/L |
| EV share (2024) | ~10% |
| Sites | ~1,900 |
| Strait of Hormuz | ~20% |
| Net-zero | 2050; 43% by 2030 |
What is included in the product
 Detailed Word Document
Provides a concise PESTLE assessment of Ampol across Political, Economic, Social, Technological, Environmental and Legal dimensions, grounded in current market and regulatory trends relevant to Australia’s fuels and energy sector. Designed for executives and advisors, it highlights data-backed risks and opportunities with forward-looking insights ready for reports or decks.

 Customizable Excel Spreadsheet
A concise, visually segmented Ampol PESTLE summary that can be dropped into presentations, shared across teams, and annotated for local context to streamline strategic planning and external risk discussions.
Economic factors

Oil price volatility
Brent trading around US$85–95/bbl and refined product spreads determine Ampol’s wholesale costs and retail margins. Crack spreads, which varied roughly US$8–18/bbl in 2024–25, and timing of inventory revaluation drive quarterly earnings volatility. Ampol’s hedging and active inventory management help mitigate price shocks. Price swings also shift customer demand elasticity, compressing volumes in sharp upswings.
Exchange rates (AUD/USD)
Imported crude and refined fuel purchases are USD-priced while Ampol's pump sales and commercial revenues are mostly in AUD. FX moves feed quickly into COGS and can compress margins when the AUD weakens; AUD/USD was about 0.66 in mid-2025. Hedging programs reduce but do not eliminate translation and timing risk. Persistent AUD weakness lifts wholesale cost pass-through to pump prices and can damp retail volumes.

Interest rates and inflation
Higher policy rates — RBA cash rate around 4.35% mid‑2025 — raise Ampol’s financing costs for capex on fuel terminals and convenience rollouts, increasing interest expense on A$‑denominated debt. Inflation running near 4% in 2024–25 lifts wages, utilities and store inputs, squeezing unit economics. Consumers trading down or cutting discretionary driving reduce forecourt footfall and basket sizes. Strong pricing discipline and tight cost control become critical to protect margins.

Transport and industrial demand
Transport and industrial demand for Ampol is driven by mining, aviation, marine and logistics cycles that determine bulk diesel and jet fuel volumes; economic slowdowns reduce diesel and jet offtake while upswings increase throughput and margin opportunity.
Contract structures (fixed pass-through vs. margin-based) affect price pass-through and volume stability; Ampol’s diversified B2B exposure to industrial customers helps smooth retail cyclicality and supports more stable cash flows.
- Drivers: mining, aviation, marine, logistics
- Risk: economic slowdowns cut diesel/jet demand
- Upside: cycles amplify throughput in upturns
- Mitigant: contracts + B2B diversification stabilize volumes
Competition and margin pressure
Rival retailers and supermarkets intensify price wars at the bowser, squeezing Ampol’s margins while its ~1,900-station network and Link loyalty program aim to protect volume and share. Promotions and fuel discounts increasingly drive purchases, and convenience retailing—growing higher-margin FMCG sales—partially offsets fuel margin decline. Network optimisation and analytics (site-level pricing, SKU mix, forecourt throughput) are critical to sustaining profitability.
- Network: ~1,900 sites
- Loyalty: Link drives repeat visits
- Margin defense: convenience mix vs FMCG rivals
- Focus: site analytics & optimisation
Policy swings and 44.2 c/L excise drive fuel price volatility and EV capex shift
Brent US$85–95/bbl and crack spreads US$8–18/bbl in 2024–25 drive Ampol’s wholesale costs and earnings volatility; active hedging mitigates but doesn’t remove risk. AUD/USD ~0.66 (mid‑2025), RBA cash rate ~4.35% and ~4% inflation lift funding and operating costs, pressuring margins; ~1,900 sites and Link loyalty help defend volumes.
| Metric | Value |
|---|---|
| Brent | US$85–95/bbl |
| Crack spread | US$8–18/bbl |
| AUD/USD | ~0.66 (mid‑2025) |
| RBA cash rate | ~4.35% |
| Inflation | ~4% |
| Network | ~1,900 sites |
Same Document Delivered
Ampol PESTLE Analysis
The preview of the Ampol PESTLE Analysis shown here is the exact document you’ll receive after purchase—fully formatted and ready to use. This is the real file with complete content and structure, no placeholders or teasers. After payment you’ll be able to download this identical, professionally structured report instantly.

Skip the Research. Get the Strategy.
Unlock how political shifts, economic cycles, and environmental pressures are shaping Ampol’s strategic outlook in our concise PESTLE snapshot. Ideal for investors and strategists, this analysis highlights risks and opportunities you can act on today. Purchase the full PESTLE for detailed, ready-to-use insights and forecasts.
Political factors
Fuel excise and taxes
Australia’s fuel excise (currently 44.2 cents per litre) and past temporary cuts (notably the 22.1 c/L short-term cut in 2022) directly move pump prices and Ampol’s refined margins, with each 10 c/L swing changing retail pump prices materially and fuel gross margin volatility. Temporary excise cuts or indexation reinstatements can lift demand and compress or expand profitability; Ampol must use pricing strategies and hedges to cushion abrupt policy shifts and coordinate with government on pass-through timing to avoid margin lag.
Energy transition policy
Federal net-zero by 2050 and a 43% 2030 emissions target steer investment toward EV charging, biofuels and alternative energy in Australia.
Incentives or mandates can materially accelerate or undermine returns on new-energy projects, while policy clarity shapes capital allocation between refining, imports and low‑carbon solutions.
With EVs ~10% of new-car sales in 2024, Ampol’s credibility hinges on aligning with net-zero roadmaps.
Refining support and fuel security
Government schemes such as the National Fuel Security Framework and state-level refining support directly influence the economics of Ampol’s Lytton refinery by underpinning domestic refining margins and investment signals. Strategic stockholding rules require commercial holders to maintain minimum reserves, shaping working capital needs and storage capex for Ampol. Policy reversals or subsidy changes could compress refining margins or force supply-chain shifts, while active engagement with fuel security frameworks mitigates geopolitical supply risk.
Trade and geopolitics
Relations with key Asian suppliers, notably Singapore refiners, influence Ampol’s import costs and product availability; disruptions can raise costs and margins volatility. Sanctions and chokepoint risks—about 20% of seaborne oil trade transits the Strait of Hormuz—can abruptly disrupt crude and product flows. Tariff and non‑tariff barriers in ASEAN markets reduce sourcing flexibility, while Ampol’s diversified supply chains and active political‑risk monitoring mitigate exposure.
- Supplier concentration risk
- Strait of Hormoz ~20% seaborne oil
- Tariff/non‑tariff constraints
- Diversified sourcing & risk monitoring
State planning and local permits
State planning regimes materially affect Ampol’s station rollouts and upgrades across its ~1,900 Australian and New Zealand sites; local council approvals can add months to timelines for EV charger installs and store refurbishments. Community consultation often dictates site design and operating hours, and delays increase project costs and risk of lost retail and fuel margin revenue.
- Sites impacted: ~1,900
- Net-zero target: 2050
- Approvals can add months
- Delays = higher capex and lost margin
Policy swings and 44.2 c/L excise drive fuel price volatility and EV capex shift
Australia’s 44.2 c/L fuel excise and past 22.1 c/L cut drive pump-price and margin volatility; pricing/hedging needed to manage policy swings.
Net-zero by 2050 and 43% 2030 target shift capex to EV charging, biofuels and low‑carbon projects; EVs ~10% of new-car sales (2024).
~1,900 sites, supply risks via Strait of Hormuz (~20% seaborne oil) and ASEAN trade barriers make supply diversification and govt engagement essential.
| Metric | Value |
|---|---|
| Fuel excise | 44.2 c/L |
| EV share (2024) | ~10% |
| Sites | ~1,900 |
| Strait of Hormuz | ~20% |
| Net-zero | 2050; 43% by 2030 |
What is included in the product
Detailed Word Document
Provides a concise PESTLE assessment of Ampol across Political, Economic, Social, Technological, Environmental and Legal dimensions, grounded in current market and regulatory trends relevant to Australia’s fuels and energy sector. Designed for executives and advisors, it highlights data-backed risks and opportunities with forward-looking insights ready for reports or decks.
Customizable Excel Spreadsheet
A concise, visually segmented Ampol PESTLE summary that can be dropped into presentations, shared across teams, and annotated for local context to streamline strategic planning and external risk discussions.
Economic factors
Oil price volatility
Brent trading around US$85–95/bbl and refined product spreads determine Ampol’s wholesale costs and retail margins. Crack spreads, which varied roughly US$8–18/bbl in 2024–25, and timing of inventory revaluation drive quarterly earnings volatility. Ampol’s hedging and active inventory management help mitigate price shocks. Price swings also shift customer demand elasticity, compressing volumes in sharp upswings.
Exchange rates (AUD/USD)
Imported crude and refined fuel purchases are USD-priced while Ampol's pump sales and commercial revenues are mostly in AUD. FX moves feed quickly into COGS and can compress margins when the AUD weakens; AUD/USD was about 0.66 in mid-2025. Hedging programs reduce but do not eliminate translation and timing risk. Persistent AUD weakness lifts wholesale cost pass-through to pump prices and can damp retail volumes.
Interest rates and inflation
Higher policy rates — RBA cash rate around 4.35% mid‑2025 — raise Ampol’s financing costs for capex on fuel terminals and convenience rollouts, increasing interest expense on A$‑denominated debt. Inflation running near 4% in 2024–25 lifts wages, utilities and store inputs, squeezing unit economics. Consumers trading down or cutting discretionary driving reduce forecourt footfall and basket sizes. Strong pricing discipline and tight cost control become critical to protect margins.
Transport and industrial demand
Transport and industrial demand for Ampol is driven by mining, aviation, marine and logistics cycles that determine bulk diesel and jet fuel volumes; economic slowdowns reduce diesel and jet offtake while upswings increase throughput and margin opportunity.
Contract structures (fixed pass-through vs. margin-based) affect price pass-through and volume stability; Ampol’s diversified B2B exposure to industrial customers helps smooth retail cyclicality and supports more stable cash flows.
- Drivers: mining, aviation, marine, logistics
- Risk: economic slowdowns cut diesel/jet demand
- Upside: cycles amplify throughput in upturns
- Mitigant: contracts + B2B diversification stabilize volumes
Competition and margin pressure
Rival retailers and supermarkets intensify price wars at the bowser, squeezing Ampol’s margins while its ~1,900-station network and Link loyalty program aim to protect volume and share. Promotions and fuel discounts increasingly drive purchases, and convenience retailing—growing higher-margin FMCG sales—partially offsets fuel margin decline. Network optimisation and analytics (site-level pricing, SKU mix, forecourt throughput) are critical to sustaining profitability.
- Network: ~1,900 sites
- Loyalty: Link drives repeat visits
- Margin defense: convenience mix vs FMCG rivals
- Focus: site analytics & optimisation
Policy swings and 44.2 c/L excise drive fuel price volatility and EV capex shift
Brent US$85–95/bbl and crack spreads US$8–18/bbl in 2024–25 drive Ampol’s wholesale costs and earnings volatility; active hedging mitigates but doesn’t remove risk. AUD/USD ~0.66 (mid‑2025), RBA cash rate ~4.35% and ~4% inflation lift funding and operating costs, pressuring margins; ~1,900 sites and Link loyalty help defend volumes.
| Metric | Value |
|---|---|
| Brent | US$85–95/bbl |
| Crack spread | US$8–18/bbl |
| AUD/USD | ~0.66 (mid‑2025) |
| RBA cash rate | ~4.35% |
| Inflation | ~4% |
| Network | ~1,900 sites |
Same Document Delivered
Ampol PESTLE Analysis
The preview of the Ampol PESTLE Analysis shown here is the exact document you’ll receive after purchase—fully formatted and ready to use. This is the real file with complete content and structure, no placeholders or teasers. After payment you’ll be able to download this identical, professionally structured report instantly.
Original: $10.00
-65%$10.00
$3.50Description
Skip the Research. Get the Strategy.
Unlock how political shifts, economic cycles, and environmental pressures are shaping Ampol’s strategic outlook in our concise PESTLE snapshot. Ideal for investors and strategists, this analysis highlights risks and opportunities you can act on today. Purchase the full PESTLE for detailed, ready-to-use insights and forecasts.
Political factors
Fuel excise and taxes
Australia’s fuel excise (currently 44.2 cents per litre) and past temporary cuts (notably the 22.1 c/L short-term cut in 2022) directly move pump prices and Ampol’s refined margins, with each 10 c/L swing changing retail pump prices materially and fuel gross margin volatility. Temporary excise cuts or indexation reinstatements can lift demand and compress or expand profitability; Ampol must use pricing strategies and hedges to cushion abrupt policy shifts and coordinate with government on pass-through timing to avoid margin lag.
Energy transition policy
Federal net-zero by 2050 and a 43% 2030 emissions target steer investment toward EV charging, biofuels and alternative energy in Australia.
Incentives or mandates can materially accelerate or undermine returns on new-energy projects, while policy clarity shapes capital allocation between refining, imports and low‑carbon solutions.
With EVs ~10% of new-car sales in 2024, Ampol’s credibility hinges on aligning with net-zero roadmaps.
Refining support and fuel security
Government schemes such as the National Fuel Security Framework and state-level refining support directly influence the economics of Ampol’s Lytton refinery by underpinning domestic refining margins and investment signals. Strategic stockholding rules require commercial holders to maintain minimum reserves, shaping working capital needs and storage capex for Ampol. Policy reversals or subsidy changes could compress refining margins or force supply-chain shifts, while active engagement with fuel security frameworks mitigates geopolitical supply risk.
Trade and geopolitics
Relations with key Asian suppliers, notably Singapore refiners, influence Ampol’s import costs and product availability; disruptions can raise costs and margins volatility. Sanctions and chokepoint risks—about 20% of seaborne oil trade transits the Strait of Hormuz—can abruptly disrupt crude and product flows. Tariff and non‑tariff barriers in ASEAN markets reduce sourcing flexibility, while Ampol’s diversified supply chains and active political‑risk monitoring mitigate exposure.
- Supplier concentration risk
- Strait of Hormoz ~20% seaborne oil
- Tariff/non‑tariff constraints
- Diversified sourcing & risk monitoring
State planning and local permits
State planning regimes materially affect Ampol’s station rollouts and upgrades across its ~1,900 Australian and New Zealand sites; local council approvals can add months to timelines for EV charger installs and store refurbishments. Community consultation often dictates site design and operating hours, and delays increase project costs and risk of lost retail and fuel margin revenue.
- Sites impacted: ~1,900
- Net-zero target: 2050
- Approvals can add months
- Delays = higher capex and lost margin
Policy swings and 44.2 c/L excise drive fuel price volatility and EV capex shift
Australia’s 44.2 c/L fuel excise and past 22.1 c/L cut drive pump-price and margin volatility; pricing/hedging needed to manage policy swings.
Net-zero by 2050 and 43% 2030 target shift capex to EV charging, biofuels and low‑carbon projects; EVs ~10% of new-car sales (2024).
~1,900 sites, supply risks via Strait of Hormuz (~20% seaborne oil) and ASEAN trade barriers make supply diversification and govt engagement essential.
| Metric | Value |
|---|---|
| Fuel excise | 44.2 c/L |
| EV share (2024) | ~10% |
| Sites | ~1,900 |
| Strait of Hormuz | ~20% |
| Net-zero | 2050; 43% by 2030 |
What is included in the product
Detailed Word Document
Provides a concise PESTLE assessment of Ampol across Political, Economic, Social, Technological, Environmental and Legal dimensions, grounded in current market and regulatory trends relevant to Australia’s fuels and energy sector. Designed for executives and advisors, it highlights data-backed risks and opportunities with forward-looking insights ready for reports or decks.
Customizable Excel Spreadsheet
A concise, visually segmented Ampol PESTLE summary that can be dropped into presentations, shared across teams, and annotated for local context to streamline strategic planning and external risk discussions.
Economic factors
Oil price volatility
Brent trading around US$85–95/bbl and refined product spreads determine Ampol’s wholesale costs and retail margins. Crack spreads, which varied roughly US$8–18/bbl in 2024–25, and timing of inventory revaluation drive quarterly earnings volatility. Ampol’s hedging and active inventory management help mitigate price shocks. Price swings also shift customer demand elasticity, compressing volumes in sharp upswings.
Exchange rates (AUD/USD)
Imported crude and refined fuel purchases are USD-priced while Ampol's pump sales and commercial revenues are mostly in AUD. FX moves feed quickly into COGS and can compress margins when the AUD weakens; AUD/USD was about 0.66 in mid-2025. Hedging programs reduce but do not eliminate translation and timing risk. Persistent AUD weakness lifts wholesale cost pass-through to pump prices and can damp retail volumes.
Interest rates and inflation
Higher policy rates — RBA cash rate around 4.35% mid‑2025 — raise Ampol’s financing costs for capex on fuel terminals and convenience rollouts, increasing interest expense on A$‑denominated debt. Inflation running near 4% in 2024–25 lifts wages, utilities and store inputs, squeezing unit economics. Consumers trading down or cutting discretionary driving reduce forecourt footfall and basket sizes. Strong pricing discipline and tight cost control become critical to protect margins.
Transport and industrial demand
Transport and industrial demand for Ampol is driven by mining, aviation, marine and logistics cycles that determine bulk diesel and jet fuel volumes; economic slowdowns reduce diesel and jet offtake while upswings increase throughput and margin opportunity.
Contract structures (fixed pass-through vs. margin-based) affect price pass-through and volume stability; Ampol’s diversified B2B exposure to industrial customers helps smooth retail cyclicality and supports more stable cash flows.
- Drivers: mining, aviation, marine, logistics
- Risk: economic slowdowns cut diesel/jet demand
- Upside: cycles amplify throughput in upturns
- Mitigant: contracts + B2B diversification stabilize volumes
Competition and margin pressure
Rival retailers and supermarkets intensify price wars at the bowser, squeezing Ampol’s margins while its ~1,900-station network and Link loyalty program aim to protect volume and share. Promotions and fuel discounts increasingly drive purchases, and convenience retailing—growing higher-margin FMCG sales—partially offsets fuel margin decline. Network optimisation and analytics (site-level pricing, SKU mix, forecourt throughput) are critical to sustaining profitability.
- Network: ~1,900 sites
- Loyalty: Link drives repeat visits
- Margin defense: convenience mix vs FMCG rivals
- Focus: site analytics & optimisation
Policy swings and 44.2 c/L excise drive fuel price volatility and EV capex shift
Brent US$85–95/bbl and crack spreads US$8–18/bbl in 2024–25 drive Ampol’s wholesale costs and earnings volatility; active hedging mitigates but doesn’t remove risk. AUD/USD ~0.66 (mid‑2025), RBA cash rate ~4.35% and ~4% inflation lift funding and operating costs, pressuring margins; ~1,900 sites and Link loyalty help defend volumes.
| Metric | Value |
|---|---|
| Brent | US$85–95/bbl |
| Crack spread | US$8–18/bbl |
| AUD/USD | ~0.66 (mid‑2025) |
| RBA cash rate | ~4.35% |
| Inflation | ~4% |
| Network | ~1,900 sites |
Same Document Delivered
Ampol PESTLE Analysis
The preview of the Ampol PESTLE Analysis shown here is the exact document you’ll receive after purchase—fully formatted and ready to use. This is the real file with complete content and structure, no placeholders or teasers. After payment you’ll be able to download this identical, professionally structured report instantly.











