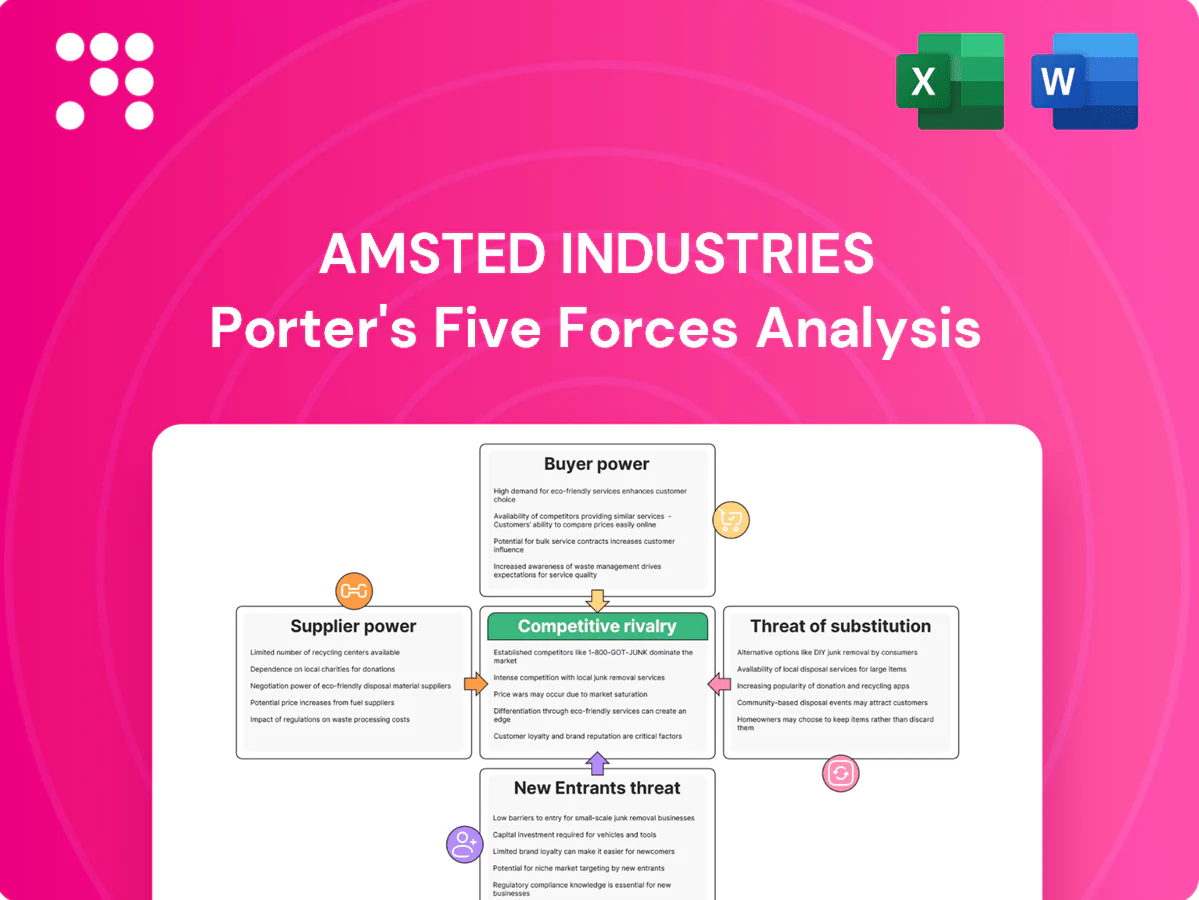
Amsted Industries Porter's Five Forces Analysis

A Must-Have Tool for Decision-Makers
Amsted Industries faces moderate supplier power and high buyer scrutiny amid capital-intensive rail and manufacturing markets, while barriers to entry and rivalry remain significant due to scale and technology. This brief snapshot only scratches the surface. Unlock the full Porter's Five Forces Analysis to explore Amsted Industries’s competitive dynamics, market pressures, and strategic advantages in detail.
Suppliers Bargaining Power

Concentrated specialty metals
Amsted depends on specialty steels, alloys and foundry inputs from a relatively concentrated supplier base, increasing supplier leverage and switching costs. Dual‑sourcing and qualification programs reduce exposure but do not eliminate dependence on a small set of qualified mills. Any 2024 disruption or consolidation in that supplier pool can lengthen lead times and raise input prices. Supplier power therefore remains a material procurement risk for Amsted.
Commodity price volatility
Steel, scrap, energy and resin price swings directly flow through Amsted’s input costs, with 2024 spot movements causing roughly 15–25% variance in feedstock expense and squeezing margins before contract resets. Surcharges and index-linked contracts enable partial pass-through but typically lag by several weeks to quarters. Hedging and multiyear supply agreements dampen volatility, yet basis risk from index mismatches means rapid spikes can compress margins temporarily.

Quality and certification requirements
Suppliers must meet stringent metallurgical and safety-critical specs for rail and heavy-duty components, with qualification cycles often exceeding 12 months, which raises switching costs and supplier stickiness. Nonconformance risks carry severe penalties including order suspension and liability exposure, elevating supplier influence. Amsted’s quarterly audits and supplier development programs help rebalance power.

Logistics and energy dependency
Freight availability, port congestion and energy costs materially raise delivered cost for Amsted; global container rates fell about 65% from 2022 peaks to 2024 but energy prices (US industrial ~ $0.13/kWh in 2024) keep input cost volatility high. Regional foundry inputs and bulk shipments concentrate risk in specific corridors, while nearshoring and 10–15 day inventory buffers cut exposure but lock up working capital. Suppliers with advantaged logistics nodes can command roughly 2–4% better terms.
Technology and tooling lock-in
Special tooling, dies, and heat‑treatment recipes for Amsted are frequently co‑developed with suppliers, embedding tacit IP and process know‑how into the supply base. Industry data in 2024 indicate supplier requalification commonly requires 6–12 months and can cost hundreds of thousands to millions of dollars, raising switching costs. This technical lock‑in strengthens supplier bargaining leverage in price and lead‑time negotiations.
- Co‑developed tooling embeds tacit IP
- Requalification: 6–12 months (2024 industry data)
- Requalification costs: hundreds of thousands to millions
- Result: increased supplier leverage
Concentrated suppliers boost switching costs; input 15–25%, freight -65%
Amsted relies on a concentrated specialty-steel/foundry supplier base, raising supplier leverage and switching costs. 2024 feedstock swings caused ~15–25% input variance; freight fell ~65% vs 2022 while US industrial power ≈ $0.13/kWh. Requalification typically 6–12 months and costly, embedding supplier stickiness and elevating procurement risk.
| Metric | 2024 Value |
|---|---|
| Input variance | 15–25% |
| Freight change (2022→2024) | -65% |
| US industrial power | $0.13/kWh |
| Requalification | 6–12 months; $0.1M–$1M+ |
| Logistics leverage | 2–4% |
What is included in the product
 Detailed Word Document
Uncovers key drivers of competition, customer influence, and market entry risks tailored to Amsted Industries, detailing supplier and buyer power, substitutes, entrant threats, and intra‑industry rivalry with strategic implications for pricing, margins, and defensive positioning.

 Customizable Excel Spreadsheet
A one-sheet Porter's Five Forces for Amsted Industries that maps supplier, buyer, entrant, substitute, and rivalry pressures into a clean radar chart—easy to customize, drop into decks, and update as market data changes to speed strategic decisions.
Customers Bargaining Power

Concentrated OEM and rail customers
Major buyers—including the seven U.S. Class I railroads and large global OEMs—purchase at scale, concentrating spending and elevating bargaining power. They routinely demand volume discounts, strict quality guarantees and service‑level penalties. With North America’s freight‑car fleet near 1.6 million units (2023), losing a key account can leave meaningful capacity underutilization.
High switching costs for engineered parts
Safety and reliability certifications such as ISO 9001 and IRIS make component switches arduous, with validation and field testing typically taking 12–24 months. Tooling and bespoke fixtures often exceed $1 million and require lab and track trials that deter rapid supplier changes. Multi-year platforms embed Amsted parts into vehicle designs, reducing buyer leverage mid-program even for large fleet customers.

Aftermarket vs OEM mix
Aftermarket parts deliver recurring revenue but remain price sensitive and exposed to alternative channels; global industrial aftermarket was estimated near $380 billion in 2024, reinforcing scale but intense competition. OEM programs are negotiated upfront and prove sticky across asset lifecycles, often locking multiyear contracts and reducing churn. Total cost of ownership and validated performance data justify premium pricing and limit buyer leverage. A balanced aftermarket/OEM mix smooths demand swings and moderates customer bargaining power.

Specification-driven procurement
Buyers specify precise technical standards that limit viable suppliers, shifting comparisons from price to demonstrated value-in-use and lifecycle performance; warranties and uptime commitments become central negotiation levers, especially for critical rail components, tempering pure price competition.
- Specification lock-in
- Value-in-use focus
- Warranties & uptime
- Reduced price-only bids
Cyclical demand and inventory strategies
Cyclical end-market swings in freight, construction and industrial activity drive order volatility for Amsted; buyers defer purchases and demand concessions during downturns, pressuring margins. Vendor-managed inventory and long-term agreements smooth volumes but commonly include price re-openers that limit pricing stability. Cycle-aware contracting—linking pricing to freight or construction indices—helps rebalance bargaining power over time; AAR data showed U.S. rail carloads up 4.5% y/y through mid-2024.
- VMI reduces order peaks but embeds price reopeners
- LTAs trade revenue visibility for renegotiation clauses
- Downturns enable buyers to push concessions, lowering realized prices
- Index-linked contracts restore supplier leverage as volumes recover
Concentrated buyers and certification lock-in reshape freight-car aftermarket
Major buyers (seven U.S. Class I railroads, large OEMs) concentrate spend, demand discounts and guarantees; U.S. freight‑car fleet ~1.6M units (2023) boosts account risk. Certification/tooling lock-in (12–24 months; tooling>$1M) limits switching. Aftermarket recurring revenue (~$380B global 2024) is price‑sensitive; AAR carloads +4.5% y/y mid‑2024 moderates buyer leverage.
| Metric | Value |
|---|---|
| Freight‑car fleet (2023) | ~1.6M |
| Global aftermarket (2024) | $380B |
| AAR carloads (mid‑2024) | +4.5% y/y |
Full Version Awaits
Amsted Industries Porter's Five Forces Analysis
This preview shows the exact Porter's Five Forces analysis for Amsted Industries you'll receive—no samples, no placeholders. The file is the final, professionally written and fully formatted document ready for immediate download upon purchase. It covers supplier and buyer power, threat of substitutes, entry barriers and competitive rivalry with actionable insights for strategic decision‑making.

A Must-Have Tool for Decision-Makers
Amsted Industries faces moderate supplier power and high buyer scrutiny amid capital-intensive rail and manufacturing markets, while barriers to entry and rivalry remain significant due to scale and technology. This brief snapshot only scratches the surface. Unlock the full Porter's Five Forces Analysis to explore Amsted Industries’s competitive dynamics, market pressures, and strategic advantages in detail.
Suppliers Bargaining Power
Concentrated specialty metals
Amsted depends on specialty steels, alloys and foundry inputs from a relatively concentrated supplier base, increasing supplier leverage and switching costs. Dual‑sourcing and qualification programs reduce exposure but do not eliminate dependence on a small set of qualified mills. Any 2024 disruption or consolidation in that supplier pool can lengthen lead times and raise input prices. Supplier power therefore remains a material procurement risk for Amsted.
Commodity price volatility
Steel, scrap, energy and resin price swings directly flow through Amsted’s input costs, with 2024 spot movements causing roughly 15–25% variance in feedstock expense and squeezing margins before contract resets. Surcharges and index-linked contracts enable partial pass-through but typically lag by several weeks to quarters. Hedging and multiyear supply agreements dampen volatility, yet basis risk from index mismatches means rapid spikes can compress margins temporarily.
Quality and certification requirements
Suppliers must meet stringent metallurgical and safety-critical specs for rail and heavy-duty components, with qualification cycles often exceeding 12 months, which raises switching costs and supplier stickiness. Nonconformance risks carry severe penalties including order suspension and liability exposure, elevating supplier influence. Amsted’s quarterly audits and supplier development programs help rebalance power.
Logistics and energy dependency
Freight availability, port congestion and energy costs materially raise delivered cost for Amsted; global container rates fell about 65% from 2022 peaks to 2024 but energy prices (US industrial ~ $0.13/kWh in 2024) keep input cost volatility high. Regional foundry inputs and bulk shipments concentrate risk in specific corridors, while nearshoring and 10–15 day inventory buffers cut exposure but lock up working capital. Suppliers with advantaged logistics nodes can command roughly 2–4% better terms.
Technology and tooling lock-in
Special tooling, dies, and heat‑treatment recipes for Amsted are frequently co‑developed with suppliers, embedding tacit IP and process know‑how into the supply base. Industry data in 2024 indicate supplier requalification commonly requires 6–12 months and can cost hundreds of thousands to millions of dollars, raising switching costs. This technical lock‑in strengthens supplier bargaining leverage in price and lead‑time negotiations.
- Co‑developed tooling embeds tacit IP
- Requalification: 6–12 months (2024 industry data)
- Requalification costs: hundreds of thousands to millions
- Result: increased supplier leverage
Concentrated suppliers boost switching costs; input 15–25%, freight -65%
Amsted relies on a concentrated specialty-steel/foundry supplier base, raising supplier leverage and switching costs. 2024 feedstock swings caused ~15–25% input variance; freight fell ~65% vs 2022 while US industrial power ≈ $0.13/kWh. Requalification typically 6–12 months and costly, embedding supplier stickiness and elevating procurement risk.
| Metric | 2024 Value |
|---|---|
| Input variance | 15–25% |
| Freight change (2022→2024) | -65% |
| US industrial power | $0.13/kWh |
| Requalification | 6–12 months; $0.1M–$1M+ |
| Logistics leverage | 2–4% |
What is included in the product
Detailed Word Document
Uncovers key drivers of competition, customer influence, and market entry risks tailored to Amsted Industries, detailing supplier and buyer power, substitutes, entrant threats, and intra‑industry rivalry with strategic implications for pricing, margins, and defensive positioning.
Customizable Excel Spreadsheet
A one-sheet Porter's Five Forces for Amsted Industries that maps supplier, buyer, entrant, substitute, and rivalry pressures into a clean radar chart—easy to customize, drop into decks, and update as market data changes to speed strategic decisions.
Customers Bargaining Power
Concentrated OEM and rail customers
Major buyers—including the seven U.S. Class I railroads and large global OEMs—purchase at scale, concentrating spending and elevating bargaining power. They routinely demand volume discounts, strict quality guarantees and service‑level penalties. With North America’s freight‑car fleet near 1.6 million units (2023), losing a key account can leave meaningful capacity underutilization.
High switching costs for engineered parts
Safety and reliability certifications such as ISO 9001 and IRIS make component switches arduous, with validation and field testing typically taking 12–24 months. Tooling and bespoke fixtures often exceed $1 million and require lab and track trials that deter rapid supplier changes. Multi-year platforms embed Amsted parts into vehicle designs, reducing buyer leverage mid-program even for large fleet customers.
Aftermarket vs OEM mix
Aftermarket parts deliver recurring revenue but remain price sensitive and exposed to alternative channels; global industrial aftermarket was estimated near $380 billion in 2024, reinforcing scale but intense competition. OEM programs are negotiated upfront and prove sticky across asset lifecycles, often locking multiyear contracts and reducing churn. Total cost of ownership and validated performance data justify premium pricing and limit buyer leverage. A balanced aftermarket/OEM mix smooths demand swings and moderates customer bargaining power.
Specification-driven procurement
Buyers specify precise technical standards that limit viable suppliers, shifting comparisons from price to demonstrated value-in-use and lifecycle performance; warranties and uptime commitments become central negotiation levers, especially for critical rail components, tempering pure price competition.
- Specification lock-in
- Value-in-use focus
- Warranties & uptime
- Reduced price-only bids
Cyclical demand and inventory strategies
Cyclical end-market swings in freight, construction and industrial activity drive order volatility for Amsted; buyers defer purchases and demand concessions during downturns, pressuring margins. Vendor-managed inventory and long-term agreements smooth volumes but commonly include price re-openers that limit pricing stability. Cycle-aware contracting—linking pricing to freight or construction indices—helps rebalance bargaining power over time; AAR data showed U.S. rail carloads up 4.5% y/y through mid-2024.
- VMI reduces order peaks but embeds price reopeners
- LTAs trade revenue visibility for renegotiation clauses
- Downturns enable buyers to push concessions, lowering realized prices
- Index-linked contracts restore supplier leverage as volumes recover
Concentrated buyers and certification lock-in reshape freight-car aftermarket
Major buyers (seven U.S. Class I railroads, large OEMs) concentrate spend, demand discounts and guarantees; U.S. freight‑car fleet ~1.6M units (2023) boosts account risk. Certification/tooling lock-in (12–24 months; tooling>$1M) limits switching. Aftermarket recurring revenue (~$380B global 2024) is price‑sensitive; AAR carloads +4.5% y/y mid‑2024 moderates buyer leverage.
| Metric | Value |
|---|---|
| Freight‑car fleet (2023) | ~1.6M |
| Global aftermarket (2024) | $380B |
| AAR carloads (mid‑2024) | +4.5% y/y |
Full Version Awaits
Amsted Industries Porter's Five Forces Analysis
This preview shows the exact Porter's Five Forces analysis for Amsted Industries you'll receive—no samples, no placeholders. The file is the final, professionally written and fully formatted document ready for immediate download upon purchase. It covers supplier and buyer power, threat of substitutes, entry barriers and competitive rivalry with actionable insights for strategic decision‑making.
Description
A Must-Have Tool for Decision-Makers
Amsted Industries faces moderate supplier power and high buyer scrutiny amid capital-intensive rail and manufacturing markets, while barriers to entry and rivalry remain significant due to scale and technology. This brief snapshot only scratches the surface. Unlock the full Porter's Five Forces Analysis to explore Amsted Industries’s competitive dynamics, market pressures, and strategic advantages in detail.
Suppliers Bargaining Power
Concentrated specialty metals
Amsted depends on specialty steels, alloys and foundry inputs from a relatively concentrated supplier base, increasing supplier leverage and switching costs. Dual‑sourcing and qualification programs reduce exposure but do not eliminate dependence on a small set of qualified mills. Any 2024 disruption or consolidation in that supplier pool can lengthen lead times and raise input prices. Supplier power therefore remains a material procurement risk for Amsted.
Commodity price volatility
Steel, scrap, energy and resin price swings directly flow through Amsted’s input costs, with 2024 spot movements causing roughly 15–25% variance in feedstock expense and squeezing margins before contract resets. Surcharges and index-linked contracts enable partial pass-through but typically lag by several weeks to quarters. Hedging and multiyear supply agreements dampen volatility, yet basis risk from index mismatches means rapid spikes can compress margins temporarily.
Quality and certification requirements
Suppliers must meet stringent metallurgical and safety-critical specs for rail and heavy-duty components, with qualification cycles often exceeding 12 months, which raises switching costs and supplier stickiness. Nonconformance risks carry severe penalties including order suspension and liability exposure, elevating supplier influence. Amsted’s quarterly audits and supplier development programs help rebalance power.
Logistics and energy dependency
Freight availability, port congestion and energy costs materially raise delivered cost for Amsted; global container rates fell about 65% from 2022 peaks to 2024 but energy prices (US industrial ~ $0.13/kWh in 2024) keep input cost volatility high. Regional foundry inputs and bulk shipments concentrate risk in specific corridors, while nearshoring and 10–15 day inventory buffers cut exposure but lock up working capital. Suppliers with advantaged logistics nodes can command roughly 2–4% better terms.
Technology and tooling lock-in
Special tooling, dies, and heat‑treatment recipes for Amsted are frequently co‑developed with suppliers, embedding tacit IP and process know‑how into the supply base. Industry data in 2024 indicate supplier requalification commonly requires 6–12 months and can cost hundreds of thousands to millions of dollars, raising switching costs. This technical lock‑in strengthens supplier bargaining leverage in price and lead‑time negotiations.
- Co‑developed tooling embeds tacit IP
- Requalification: 6–12 months (2024 industry data)
- Requalification costs: hundreds of thousands to millions
- Result: increased supplier leverage
Concentrated suppliers boost switching costs; input 15–25%, freight -65%
Amsted relies on a concentrated specialty-steel/foundry supplier base, raising supplier leverage and switching costs. 2024 feedstock swings caused ~15–25% input variance; freight fell ~65% vs 2022 while US industrial power ≈ $0.13/kWh. Requalification typically 6–12 months and costly, embedding supplier stickiness and elevating procurement risk.
| Metric | 2024 Value |
|---|---|
| Input variance | 15–25% |
| Freight change (2022→2024) | -65% |
| US industrial power | $0.13/kWh |
| Requalification | 6–12 months; $0.1M–$1M+ |
| Logistics leverage | 2–4% |
What is included in the product
Detailed Word Document
Uncovers key drivers of competition, customer influence, and market entry risks tailored to Amsted Industries, detailing supplier and buyer power, substitutes, entrant threats, and intra‑industry rivalry with strategic implications for pricing, margins, and defensive positioning.
Customizable Excel Spreadsheet
A one-sheet Porter's Five Forces for Amsted Industries that maps supplier, buyer, entrant, substitute, and rivalry pressures into a clean radar chart—easy to customize, drop into decks, and update as market data changes to speed strategic decisions.
Customers Bargaining Power
Concentrated OEM and rail customers
Major buyers—including the seven U.S. Class I railroads and large global OEMs—purchase at scale, concentrating spending and elevating bargaining power. They routinely demand volume discounts, strict quality guarantees and service‑level penalties. With North America’s freight‑car fleet near 1.6 million units (2023), losing a key account can leave meaningful capacity underutilization.
High switching costs for engineered parts
Safety and reliability certifications such as ISO 9001 and IRIS make component switches arduous, with validation and field testing typically taking 12–24 months. Tooling and bespoke fixtures often exceed $1 million and require lab and track trials that deter rapid supplier changes. Multi-year platforms embed Amsted parts into vehicle designs, reducing buyer leverage mid-program even for large fleet customers.
Aftermarket vs OEM mix
Aftermarket parts deliver recurring revenue but remain price sensitive and exposed to alternative channels; global industrial aftermarket was estimated near $380 billion in 2024, reinforcing scale but intense competition. OEM programs are negotiated upfront and prove sticky across asset lifecycles, often locking multiyear contracts and reducing churn. Total cost of ownership and validated performance data justify premium pricing and limit buyer leverage. A balanced aftermarket/OEM mix smooths demand swings and moderates customer bargaining power.
Specification-driven procurement
Buyers specify precise technical standards that limit viable suppliers, shifting comparisons from price to demonstrated value-in-use and lifecycle performance; warranties and uptime commitments become central negotiation levers, especially for critical rail components, tempering pure price competition.
- Specification lock-in
- Value-in-use focus
- Warranties & uptime
- Reduced price-only bids
Cyclical demand and inventory strategies
Cyclical end-market swings in freight, construction and industrial activity drive order volatility for Amsted; buyers defer purchases and demand concessions during downturns, pressuring margins. Vendor-managed inventory and long-term agreements smooth volumes but commonly include price re-openers that limit pricing stability. Cycle-aware contracting—linking pricing to freight or construction indices—helps rebalance bargaining power over time; AAR data showed U.S. rail carloads up 4.5% y/y through mid-2024.
- VMI reduces order peaks but embeds price reopeners
- LTAs trade revenue visibility for renegotiation clauses
- Downturns enable buyers to push concessions, lowering realized prices
- Index-linked contracts restore supplier leverage as volumes recover
Concentrated buyers and certification lock-in reshape freight-car aftermarket
Major buyers (seven U.S. Class I railroads, large OEMs) concentrate spend, demand discounts and guarantees; U.S. freight‑car fleet ~1.6M units (2023) boosts account risk. Certification/tooling lock-in (12–24 months; tooling>$1M) limits switching. Aftermarket recurring revenue (~$380B global 2024) is price‑sensitive; AAR carloads +4.5% y/y mid‑2024 moderates buyer leverage.
| Metric | Value |
|---|---|
| Freight‑car fleet (2023) | ~1.6M |
| Global aftermarket (2024) | $380B |
| AAR carloads (mid‑2024) | +4.5% y/y |
Full Version Awaits
Amsted Industries Porter's Five Forces Analysis
This preview shows the exact Porter's Five Forces analysis for Amsted Industries you'll receive—no samples, no placeholders. The file is the final, professionally written and fully formatted document ready for immediate download upon purchase. It covers supplier and buyer power, threat of substitutes, entry barriers and competitive rivalry with actionable insights for strategic decision‑making.











