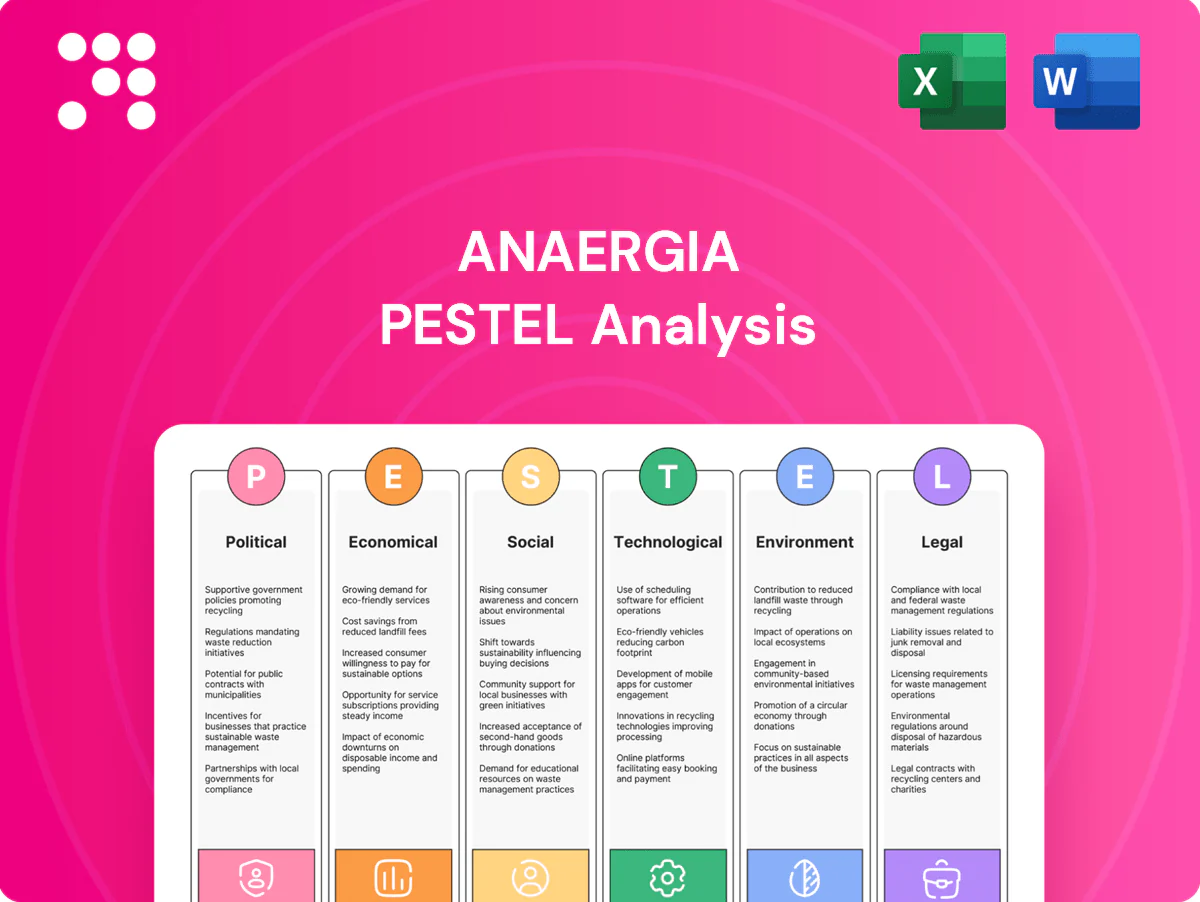
Anaergia PESTLE Analysis

Your Competitive Advantage Starts with This Report
Unlock critical insights with our concise PESTLE analysis of Anaergia—highlighting regulatory, economic, and technological forces shaping its bioenergy strategy. Tailored for investors and strategists, this briefing reveals risks and growth levers. Purchase the full report for the complete, actionable breakdown.
Political factors

Climate policy incentives
National and regional climate targets—eg California SB 1383's 75% organic waste diversion target by 2025—drive subsidies, tax credits and grants that accelerate RNG and organics diversion projects. Anaergia benefits from stable frameworks and prioritization of methane abatement, amplified by the Inflation Reduction Act's roughly $369 billion in clean-energy incentives. Shifts in administrations can reshape credit rates and eligibility. Monitoring multiyear policy cycles reduces exposure to abrupt program changes.
Waste management mandates
Source-separation and landfill diversion mandates (EU recycling targets: 55% by 2025, 60% by 2030, 65% by 2035) expand feedstock for anaerobic digestion, aided by the fact that food waste comprises ~28% of US MSW (EPA). Municipal procurement favoring circular-economy solutions benefits Anaergia, but uneven enforcement across jurisdictions can weaken supply reliability. Proactive engagement with local authorities helps align facility capacity with compliance timelines.

Energy security agendas
Governments seeking domestic low-carbon gas increasingly support RNG interconnections and offtake, with the EU targeting 35 bcm of biomethane by 2030. Geopolitical volatility and supply shocks boost interest in decentralized waste-to-energy solutions. Prioritization has enabled fast-track permitting in some jurisdictions. Fossil fuel lobbying, however, can delay RNG policy maturation.

Infrastructure funding programs
Public–private partnerships and dedicated green infrastructure funds are increasingly used to de-risk Anaergia-scale projects, attracting concessional capital and lowering WACC; multilaterals and development banks expanded biomethane commitments, exceeding $500m globally in 2023–24, but access hinges on local political will and project readiness; transparent, third-party impact metrics (GHG reductions, feedstock traceability) materially strengthen award chances.
- de-risking: PPPs, green funds
- multilaterals: >$500m biomethane 2023–24
- access: political will + readiness
- eligibility: transparent impact metrics
Trade and localization pressures
Local content rules and tariffs can raise equipment costs and delay project timelines; Anaergia must align procurement with domestic-content incentives such as the US Inflation Reduction Act and EU industrial policies that favor local manufacturing. Its global supply chain requires country-specific compliance for tenders and customs, pushing Anaergia toward local partners or licensed manufacturing to win contracts. Standardized modular designs reduce cross-border policy friction and speed deployment.
- local-content compliance
- IRA and EU industrial incentives
- partnering for domestic manufacturing
- modular standardization reduces risk
IRA $369bn and targets unlock RNG investment and EU biomethane scale
National climate targets (eg California SB 1383 75% diversion by 2025) plus the Inflation Reduction Act (~$369bn clean-energy incentives) drive RNG subsidies and project finance. EU source‑separation and recycling targets (55% 2025, 60% 2030, 65% 2035) expand feedstock; food waste ≈28% of US MSW. PPPs and multilaterals (> $500m biomethane 2023–24) de‑risk projects; EU aims 35 bcm biomethane by 2030.
| Tag | Value |
|---|---|
| IRA | $369bn |
| SB 1383 | 75% by 2025 |
| EU biomethane | 35 bcm by 2030 |
| Multilaterals | >$500m (2023–24) |
| Food waste | ~28% US MSW |
What is included in the product
 Detailed Word Document
Explores how macro-environmental factors uniquely affect Anaergia across Political, Economic, Social, Technological, Environmental and Legal dimensions, with data-backed trends and region-specific examples. Designed for executives and investors, it offers forward-looking insights ready for decks, plans and scenario planning.

 Customizable Excel Spreadsheet
A clean, summarized Anaergia PESTLE analysis for quick reference, visually segmented by categories and written in plain language to support fast alignment, presentation-ready slides, and focused discussions on external risks and market positioning.
Economic factors

RNG price dynamics
RNG premiums hinge on policy-driven LCFS credits (California averaged about 120–160 USD/MTCO2e in 2024), RIN D3 prices (roughly 0.6–0.8 USD/gal eq in 2024) and volatile voluntary markets, creating revenue swings that can move project IRRs by several percentage points and stress DSCRs. Hedging and 10–15 year offtakes materially stabilize cash flows, while cross-jurisdictional portfolios in North America and Europe cut revenue concentration risk.
Capex and financing costs
High-rate digestion, upgrading and interconnects are capital-intensive, with project capex often concentrated in upfront equipment and grid works; prevailing short-term interest rates (US Fed funds ~5.25–5.50% in 2024–25) and lender risk appetite directly affect build–own–operate viability. Blended finance and green bonds have reduced WACC by around 1–2 percentage points in recent project financings. Modularization and strict EPC discipline curb overruns and improve bankability.

Feedstock contracting
Tipping fees, typically US$30–80/ton in North America in 2024, and long-term waste-supply contracts underpin Anaergia’s revenue and project financing. Competition for high-energy organics raises feedstock prices and can compress returns. Indexation clauses in contracts protect margins against CPI-driven inflation. Vertical integration with municipalities secures predictable volumes for operations.

Carbon credit monetization
- Market size: 2.1B USD (2023)
- MRV premium: up to 50% for high-integrity credits
- Liquidity: region/registry dependent
- Stacking risk: strict additionality and no-double-count rules required
Operational scalability
Operational scalability at Anaergia drives lower unit costs through economies of scale in O&M, biosolids handling and logistics, while learning-curve gains raise uptime and biogas yields. Standardized equipment reduces spare-part inventories and training time. Centralized monitoring enables performance optimization and faster troubleshooting across sites.
- O&M scale reduces per-unit costs
- Learning curves increase uptime/biogas
- Standard equipment eases spares/training
- Central monitoring boosts fleet performance
IRA $369bn and targets unlock RNG investment and EU biomethane scale
Revenue tied to LCFS credits (CA ~120–160 USD/MTCO2e in 2024) and RIN D3 (~0.6–0.8 USD/gal eq in 2024) creates material IRR/DSCR volatility; hedged 10–15y offtakes and cross-jurisdiction portfolios mitigate risk. High capex and US rates (Fed funds ~5.25–5.50% in 2024–25) raise financing costs; blended finance cuts WACC ~1–2ppt. Tipping fees (US$30–80/ton 2024) and voluntary carbon market size (~2.1B USD 2023) support returns.
| Metric | Value |
|---|---|
| LCFS (CA 2024) | 120–160 USD/MTCO2e |
| RIN D3 (2024) | 0.6–0.8 USD/gal eq |
| Fed funds (2024–25) | 5.25–5.50% |
| Tipping fees (NA 2024) | 30–80 USD/ton |
| Voluntary carbon market (2023) | 2.1B USD |
What You See Is What You Get
Anaergia PESTLE Analysis
The Anaergia PESTLE Analysis provides a concise review of political, economic, social, technological, legal, and environmental factors affecting Anaergia. The preview shown here is the exact document you’ll receive after purchase—fully formatted and ready to use. No placeholders or teasers; the content, layout, and structure visible are the final downloadable file. Use it immediately for strategic or investment decisions.

Your Competitive Advantage Starts with This Report
Unlock critical insights with our concise PESTLE analysis of Anaergia—highlighting regulatory, economic, and technological forces shaping its bioenergy strategy. Tailored for investors and strategists, this briefing reveals risks and growth levers. Purchase the full report for the complete, actionable breakdown.
Political factors
Climate policy incentives
National and regional climate targets—eg California SB 1383's 75% organic waste diversion target by 2025—drive subsidies, tax credits and grants that accelerate RNG and organics diversion projects. Anaergia benefits from stable frameworks and prioritization of methane abatement, amplified by the Inflation Reduction Act's roughly $369 billion in clean-energy incentives. Shifts in administrations can reshape credit rates and eligibility. Monitoring multiyear policy cycles reduces exposure to abrupt program changes.
Waste management mandates
Source-separation and landfill diversion mandates (EU recycling targets: 55% by 2025, 60% by 2030, 65% by 2035) expand feedstock for anaerobic digestion, aided by the fact that food waste comprises ~28% of US MSW (EPA). Municipal procurement favoring circular-economy solutions benefits Anaergia, but uneven enforcement across jurisdictions can weaken supply reliability. Proactive engagement with local authorities helps align facility capacity with compliance timelines.
Energy security agendas
Governments seeking domestic low-carbon gas increasingly support RNG interconnections and offtake, with the EU targeting 35 bcm of biomethane by 2030. Geopolitical volatility and supply shocks boost interest in decentralized waste-to-energy solutions. Prioritization has enabled fast-track permitting in some jurisdictions. Fossil fuel lobbying, however, can delay RNG policy maturation.
Infrastructure funding programs
Public–private partnerships and dedicated green infrastructure funds are increasingly used to de-risk Anaergia-scale projects, attracting concessional capital and lowering WACC; multilaterals and development banks expanded biomethane commitments, exceeding $500m globally in 2023–24, but access hinges on local political will and project readiness; transparent, third-party impact metrics (GHG reductions, feedstock traceability) materially strengthen award chances.
- de-risking: PPPs, green funds
- multilaterals: >$500m biomethane 2023–24
- access: political will + readiness
- eligibility: transparent impact metrics
Trade and localization pressures
Local content rules and tariffs can raise equipment costs and delay project timelines; Anaergia must align procurement with domestic-content incentives such as the US Inflation Reduction Act and EU industrial policies that favor local manufacturing. Its global supply chain requires country-specific compliance for tenders and customs, pushing Anaergia toward local partners or licensed manufacturing to win contracts. Standardized modular designs reduce cross-border policy friction and speed deployment.
- local-content compliance
- IRA and EU industrial incentives
- partnering for domestic manufacturing
- modular standardization reduces risk
IRA $369bn and targets unlock RNG investment and EU biomethane scale
National climate targets (eg California SB 1383 75% diversion by 2025) plus the Inflation Reduction Act (~$369bn clean-energy incentives) drive RNG subsidies and project finance. EU source‑separation and recycling targets (55% 2025, 60% 2030, 65% 2035) expand feedstock; food waste ≈28% of US MSW. PPPs and multilaterals (> $500m biomethane 2023–24) de‑risk projects; EU aims 35 bcm biomethane by 2030.
| Tag | Value |
|---|---|
| IRA | $369bn |
| SB 1383 | 75% by 2025 |
| EU biomethane | 35 bcm by 2030 |
| Multilaterals | >$500m (2023–24) |
| Food waste | ~28% US MSW |
What is included in the product
Detailed Word Document
Explores how macro-environmental factors uniquely affect Anaergia across Political, Economic, Social, Technological, Environmental and Legal dimensions, with data-backed trends and region-specific examples. Designed for executives and investors, it offers forward-looking insights ready for decks, plans and scenario planning.
Customizable Excel Spreadsheet
A clean, summarized Anaergia PESTLE analysis for quick reference, visually segmented by categories and written in plain language to support fast alignment, presentation-ready slides, and focused discussions on external risks and market positioning.
Economic factors
RNG price dynamics
RNG premiums hinge on policy-driven LCFS credits (California averaged about 120–160 USD/MTCO2e in 2024), RIN D3 prices (roughly 0.6–0.8 USD/gal eq in 2024) and volatile voluntary markets, creating revenue swings that can move project IRRs by several percentage points and stress DSCRs. Hedging and 10–15 year offtakes materially stabilize cash flows, while cross-jurisdictional portfolios in North America and Europe cut revenue concentration risk.
Capex and financing costs
High-rate digestion, upgrading and interconnects are capital-intensive, with project capex often concentrated in upfront equipment and grid works; prevailing short-term interest rates (US Fed funds ~5.25–5.50% in 2024–25) and lender risk appetite directly affect build–own–operate viability. Blended finance and green bonds have reduced WACC by around 1–2 percentage points in recent project financings. Modularization and strict EPC discipline curb overruns and improve bankability.
Feedstock contracting
Tipping fees, typically US$30–80/ton in North America in 2024, and long-term waste-supply contracts underpin Anaergia’s revenue and project financing. Competition for high-energy organics raises feedstock prices and can compress returns. Indexation clauses in contracts protect margins against CPI-driven inflation. Vertical integration with municipalities secures predictable volumes for operations.
Carbon credit monetization
- Market size: 2.1B USD (2023)
- MRV premium: up to 50% for high-integrity credits
- Liquidity: region/registry dependent
- Stacking risk: strict additionality and no-double-count rules required
Operational scalability
Operational scalability at Anaergia drives lower unit costs through economies of scale in O&M, biosolids handling and logistics, while learning-curve gains raise uptime and biogas yields. Standardized equipment reduces spare-part inventories and training time. Centralized monitoring enables performance optimization and faster troubleshooting across sites.
- O&M scale reduces per-unit costs
- Learning curves increase uptime/biogas
- Standard equipment eases spares/training
- Central monitoring boosts fleet performance
IRA $369bn and targets unlock RNG investment and EU biomethane scale
Revenue tied to LCFS credits (CA ~120–160 USD/MTCO2e in 2024) and RIN D3 (~0.6–0.8 USD/gal eq in 2024) creates material IRR/DSCR volatility; hedged 10–15y offtakes and cross-jurisdiction portfolios mitigate risk. High capex and US rates (Fed funds ~5.25–5.50% in 2024–25) raise financing costs; blended finance cuts WACC ~1–2ppt. Tipping fees (US$30–80/ton 2024) and voluntary carbon market size (~2.1B USD 2023) support returns.
| Metric | Value |
|---|---|
| LCFS (CA 2024) | 120–160 USD/MTCO2e |
| RIN D3 (2024) | 0.6–0.8 USD/gal eq |
| Fed funds (2024–25) | 5.25–5.50% |
| Tipping fees (NA 2024) | 30–80 USD/ton |
| Voluntary carbon market (2023) | 2.1B USD |
What You See Is What You Get
Anaergia PESTLE Analysis
The Anaergia PESTLE Analysis provides a concise review of political, economic, social, technological, legal, and environmental factors affecting Anaergia. The preview shown here is the exact document you’ll receive after purchase—fully formatted and ready to use. No placeholders or teasers; the content, layout, and structure visible are the final downloadable file. Use it immediately for strategic or investment decisions.
Original: $10.00
-65%$10.00
$3.50Description
Your Competitive Advantage Starts with This Report
Unlock critical insights with our concise PESTLE analysis of Anaergia—highlighting regulatory, economic, and technological forces shaping its bioenergy strategy. Tailored for investors and strategists, this briefing reveals risks and growth levers. Purchase the full report for the complete, actionable breakdown.
Political factors
Climate policy incentives
National and regional climate targets—eg California SB 1383's 75% organic waste diversion target by 2025—drive subsidies, tax credits and grants that accelerate RNG and organics diversion projects. Anaergia benefits from stable frameworks and prioritization of methane abatement, amplified by the Inflation Reduction Act's roughly $369 billion in clean-energy incentives. Shifts in administrations can reshape credit rates and eligibility. Monitoring multiyear policy cycles reduces exposure to abrupt program changes.
Waste management mandates
Source-separation and landfill diversion mandates (EU recycling targets: 55% by 2025, 60% by 2030, 65% by 2035) expand feedstock for anaerobic digestion, aided by the fact that food waste comprises ~28% of US MSW (EPA). Municipal procurement favoring circular-economy solutions benefits Anaergia, but uneven enforcement across jurisdictions can weaken supply reliability. Proactive engagement with local authorities helps align facility capacity with compliance timelines.
Energy security agendas
Governments seeking domestic low-carbon gas increasingly support RNG interconnections and offtake, with the EU targeting 35 bcm of biomethane by 2030. Geopolitical volatility and supply shocks boost interest in decentralized waste-to-energy solutions. Prioritization has enabled fast-track permitting in some jurisdictions. Fossil fuel lobbying, however, can delay RNG policy maturation.
Infrastructure funding programs
Public–private partnerships and dedicated green infrastructure funds are increasingly used to de-risk Anaergia-scale projects, attracting concessional capital and lowering WACC; multilaterals and development banks expanded biomethane commitments, exceeding $500m globally in 2023–24, but access hinges on local political will and project readiness; transparent, third-party impact metrics (GHG reductions, feedstock traceability) materially strengthen award chances.
- de-risking: PPPs, green funds
- multilaterals: >$500m biomethane 2023–24
- access: political will + readiness
- eligibility: transparent impact metrics
Trade and localization pressures
Local content rules and tariffs can raise equipment costs and delay project timelines; Anaergia must align procurement with domestic-content incentives such as the US Inflation Reduction Act and EU industrial policies that favor local manufacturing. Its global supply chain requires country-specific compliance for tenders and customs, pushing Anaergia toward local partners or licensed manufacturing to win contracts. Standardized modular designs reduce cross-border policy friction and speed deployment.
- local-content compliance
- IRA and EU industrial incentives
- partnering for domestic manufacturing
- modular standardization reduces risk
IRA $369bn and targets unlock RNG investment and EU biomethane scale
National climate targets (eg California SB 1383 75% diversion by 2025) plus the Inflation Reduction Act (~$369bn clean-energy incentives) drive RNG subsidies and project finance. EU source‑separation and recycling targets (55% 2025, 60% 2030, 65% 2035) expand feedstock; food waste ≈28% of US MSW. PPPs and multilaterals (> $500m biomethane 2023–24) de‑risk projects; EU aims 35 bcm biomethane by 2030.
| Tag | Value |
|---|---|
| IRA | $369bn |
| SB 1383 | 75% by 2025 |
| EU biomethane | 35 bcm by 2030 |
| Multilaterals | >$500m (2023–24) |
| Food waste | ~28% US MSW |
What is included in the product
Detailed Word Document
Explores how macro-environmental factors uniquely affect Anaergia across Political, Economic, Social, Technological, Environmental and Legal dimensions, with data-backed trends and region-specific examples. Designed for executives and investors, it offers forward-looking insights ready for decks, plans and scenario planning.
Customizable Excel Spreadsheet
A clean, summarized Anaergia PESTLE analysis for quick reference, visually segmented by categories and written in plain language to support fast alignment, presentation-ready slides, and focused discussions on external risks and market positioning.
Economic factors
RNG price dynamics
RNG premiums hinge on policy-driven LCFS credits (California averaged about 120–160 USD/MTCO2e in 2024), RIN D3 prices (roughly 0.6–0.8 USD/gal eq in 2024) and volatile voluntary markets, creating revenue swings that can move project IRRs by several percentage points and stress DSCRs. Hedging and 10–15 year offtakes materially stabilize cash flows, while cross-jurisdictional portfolios in North America and Europe cut revenue concentration risk.
Capex and financing costs
High-rate digestion, upgrading and interconnects are capital-intensive, with project capex often concentrated in upfront equipment and grid works; prevailing short-term interest rates (US Fed funds ~5.25–5.50% in 2024–25) and lender risk appetite directly affect build–own–operate viability. Blended finance and green bonds have reduced WACC by around 1–2 percentage points in recent project financings. Modularization and strict EPC discipline curb overruns and improve bankability.
Feedstock contracting
Tipping fees, typically US$30–80/ton in North America in 2024, and long-term waste-supply contracts underpin Anaergia’s revenue and project financing. Competition for high-energy organics raises feedstock prices and can compress returns. Indexation clauses in contracts protect margins against CPI-driven inflation. Vertical integration with municipalities secures predictable volumes for operations.
Carbon credit monetization
- Market size: 2.1B USD (2023)
- MRV premium: up to 50% for high-integrity credits
- Liquidity: region/registry dependent
- Stacking risk: strict additionality and no-double-count rules required
Operational scalability
Operational scalability at Anaergia drives lower unit costs through economies of scale in O&M, biosolids handling and logistics, while learning-curve gains raise uptime and biogas yields. Standardized equipment reduces spare-part inventories and training time. Centralized monitoring enables performance optimization and faster troubleshooting across sites.
- O&M scale reduces per-unit costs
- Learning curves increase uptime/biogas
- Standard equipment eases spares/training
- Central monitoring boosts fleet performance
IRA $369bn and targets unlock RNG investment and EU biomethane scale
Revenue tied to LCFS credits (CA ~120–160 USD/MTCO2e in 2024) and RIN D3 (~0.6–0.8 USD/gal eq in 2024) creates material IRR/DSCR volatility; hedged 10–15y offtakes and cross-jurisdiction portfolios mitigate risk. High capex and US rates (Fed funds ~5.25–5.50% in 2024–25) raise financing costs; blended finance cuts WACC ~1–2ppt. Tipping fees (US$30–80/ton 2024) and voluntary carbon market size (~2.1B USD 2023) support returns.
| Metric | Value |
|---|---|
| LCFS (CA 2024) | 120–160 USD/MTCO2e |
| RIN D3 (2024) | 0.6–0.8 USD/gal eq |
| Fed funds (2024–25) | 5.25–5.50% |
| Tipping fees (NA 2024) | 30–80 USD/ton |
| Voluntary carbon market (2023) | 2.1B USD |
What You See Is What You Get
Anaergia PESTLE Analysis
The Anaergia PESTLE Analysis provides a concise review of political, economic, social, technological, legal, and environmental factors affecting Anaergia. The preview shown here is the exact document you’ll receive after purchase—fully formatted and ready to use. No placeholders or teasers; the content, layout, and structure visible are the final downloadable file. Use it immediately for strategic or investment decisions.











