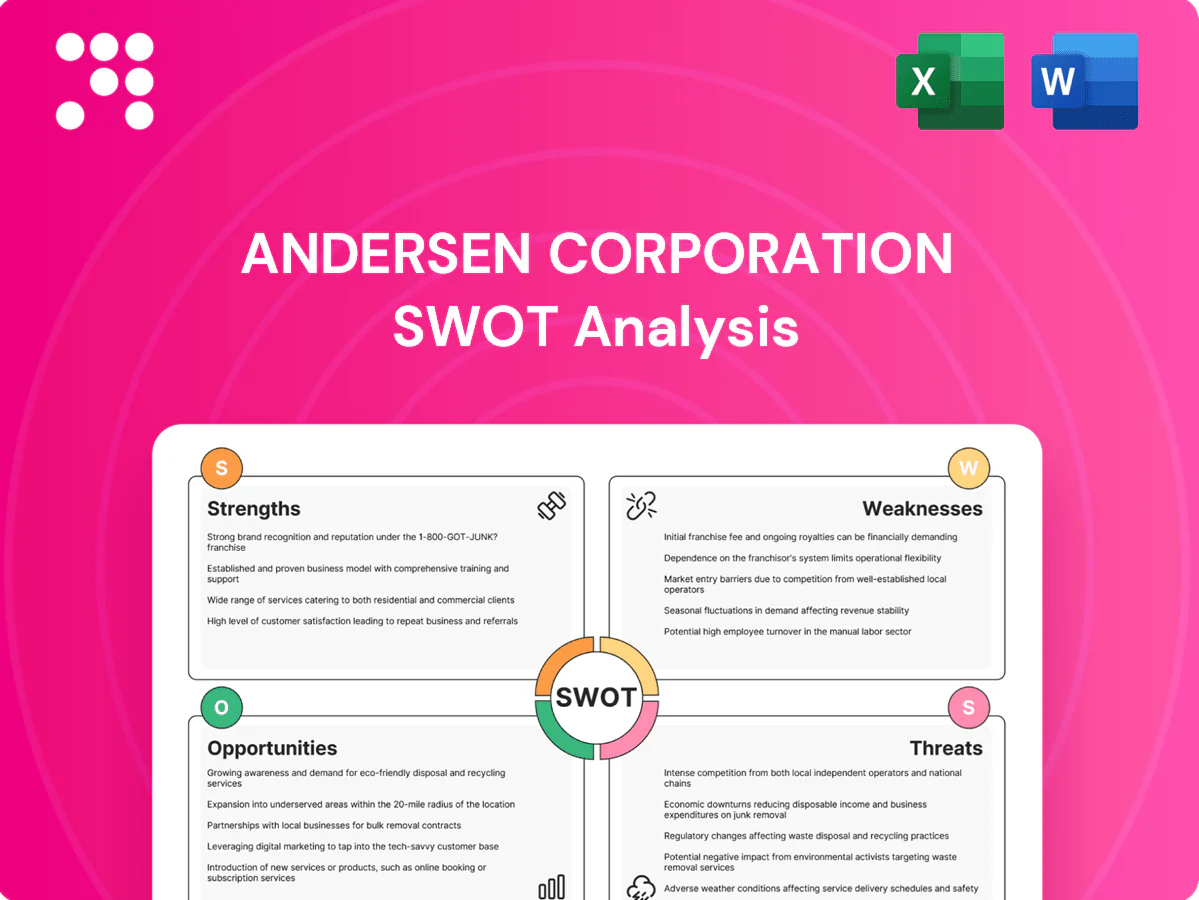
Andersen Corporation SWOT Analysis

Your Strategic Toolkit Starts Here
Explore a concise SWOT snapshot of Andersen Corporation—highlighting strong brand equity, product innovation, supply-chain resilience, and market risks from material costs and regulatory shifts. Want deeper, actionable insights? Purchase the full SWOT analysis for an editable, research-backed report and Excel tools to inform strategy, investment, or competitive planning.
Strengths

Iconic brand recognition
Andersen, founded in 1903, leverages over 120 years of trust among homeowners, builders and architects to sustain top-tier brand recognition in windows and doors. This legacy brand equity underpins pricing power and strong dealer pull-through, lowering customer acquisition costs. Recognition also facilitates cross-selling across Andersen’s product lines and subsidiaries, boosting lifetime customer value.
Diversified product portfolio
Andersen offers wood, composite, fiberglass, vinyl and aluminum across styles and price tiers, serving new construction, remodeling and replacement use-cases; this breadth hedges material and demand shifts and enables specification for varied climates and performance needs. Andersen, founded in 1903, reported revenues exceeding $3.7 billion in 2022 and employs roughly 12,000 people.

Multi-channel distribution
Andersen’s products reach customers through independent dealers, big-box retailers, and its owned brands’ networks, leveraging a multi-channel footprint that supports its century-plus legacy (founded 1903) and roughly 13,000 employees. Multiple routes improve market coverage and resilience to channel-specific downturns. Dealers provide specification support for pros, while retail captures DIY demand, together boosting visibility and sales velocity.

Energy-efficient and premium performance
Andersen emphasizes energy efficiency, durability and broad design options, offering high-performance glazing and frames that meet evolving codes and ENERGY STAR criteria; DOE estimates efficient window upgrades cut heating/cooling energy 7–15%. These products support incentive-driven projects and rebates through 2024–2025 and differentiate Andersen from low-cost imports by commanding premium pricing and higher margins.
- Energy savings: 7–15% (DOE)
- Code alignment: IECC/ENERGY STAR-ready
- Competitive edge: premium vs imports
Portfolio of brands
Operating multiple brands allows Andersen to target distinct segments and price points through differentiated offerings such as Andersen and Renewal by Andersen, enhancing reach across customer cohorts. Brand architecture reduces cannibalization and improves market penetration by clearly positioning premium and value lines. It enables tailored marketing and dealer strategies and provides flexibility for staged innovation rollouts.
- Targeting: distinct segments & price points
- Reduced cannibalization, improved penetration
- Tailored marketing & dealer strategies
- Flexible staged innovation rollouts
Century brand fuels pricing power; $3.7B, 7–15%
Century-long brand (founded 1903) drives pricing power and dealer pull-through. Broad material mix and multi-channel distribution (dealers, big-box, owned brands) diversify demand and reduce risk. Energy-efficient, code-ready products (DOE savings 7–15%) support premium margins; 2022 revenue ~ $3.7B, ~13,000 employees.
| Metric | Value |
|---|---|
| Revenue (2022) | $3.7B |
| Employees | ~13,000 |
| DOE energy savings | 7–15% |
What is included in the product
 Detailed Word Document
Provides a concise SWOT analysis of Andersen Corporation, outlining internal strengths and weaknesses alongside external opportunities and threats to assess its competitive position, growth drivers, and strategic risks.

 Customizable Excel Spreadsheet
Provides a concise SWOT matrix for Andersen Corporation to quickly align strategy across product lines and markets, highlighting strengths in brand and distribution while flagging risks like supply-chain exposure and regulatory pressures for faster, focused decision-making.
Weaknesses

Exposure to cyclical construction
Andersen’s demand tracks housing starts, remodeling and commercial cycles; U.S. housing starts averaged about 1.3M annualized in 2024 and remodeling remained uneven. Shifts in 30-year mortgage rates (around 6.9% in 2024) and swings in consumer confidence have reduced orders. This cyclicality pressures plant utilization and gross margins, and makes forecasting harder in volatile macro conditions.
Premium pricing limits reach
Andersen’s higher-end positioning can deter price-sensitive buyers, limiting penetration into value-driven households; as a privately held leader with approximately 13,000 employees, the firm risks ceding entry-level share to lower-cost rivals. In downturns—when renovation and new-build volumes drop—premium pricing can constrain unit sales. Deep discounting to chase volume risks brand dilution and margin erosion.

Material and input cost sensitivity
Wood, glass, resins and aluminum price swings materially move Andersen’s COGS—lumber and resin spikes in 2020–22 (lumber futures rose sharply, peak-year moves exceeded 50%) and continued volatility into 2024 press margins.
Freight and logistics volatility (container and trucking cost swings of double-digit percent in 2021–24) add further input-cost pressure and unpredictability to sourcing.
Passing costs to customers often lags market spikes, while hedging and supplier concentration introduce execution and supply-risk that can erode profitability.

Complex supply chain and lead times
Complex supply chain: thousands of custom configurations and SKU permutations complicate planning; lead-time variability (commonly 4–12+ weeks) frustrates dealers and installers, while bottlenecks ripple through project schedules and amplify delay risk. Service failures can erode dealer and consumer trust and harm market reputation.
- Thousands of SKUs increase planning complexity
- Lead times 4–12+ weeks frustrate partners
- Bottlenecks delay projects
- Service lapses risk reputational damage
Geographic concentration in North America
Andersen Corporation's sales remain heavily tied to North American markets, concentrating revenue and exposing the firm to regional housing and construction cycles.
Limited global diversification raises regional risk exposure, constrains currency and overseas growth optionality, and reduces natural hedges against local downturns.
- Geographic concentration: North America-dependent
- Risk exposure: regional housing cycle sensitivity
- Growth constraint: limited international optionality
- Hedge deficit: minimal natural offset for local downturns
Premium windows face demand squeeze as U.S. starts ~1.3M, 30-yr ~6.9%
Andersen is highly cyclical—U.S. housing starts ~1.3M annualized in 2024 and 30-year mortgage ~6.9% in 2024—pressuring orders, utilization and margins. Premium positioning and ~13,000 employees limit penetration into value segments and can force margin-eroding discounts in downturns. Input cost volatility (lumber/resin spikes >50% peak moves) plus freight swings and complex SKUs lengthen lead times and raise service risk.
| Metric | 2024/Recent |
|---|---|
| U.S. housing starts | ~1.3M |
| 30-yr mortgage rate | ~6.9% |
| Employees | ~13,000 |
| Lumber/resin moves | peak >50% |
What You See Is What You Get
Andersen Corporation SWOT Analysis
This is the actual SWOT analysis document you’ll receive upon purchase—no surprises, just professional quality. The preview below is taken directly from the full SWOT report you'll get, with the same structured strengths, weaknesses, opportunities and threats for Andersen Corporation. Purchase unlocks the complete, editable version ready for immediate download.

Your Strategic Toolkit Starts Here
Explore a concise SWOT snapshot of Andersen Corporation—highlighting strong brand equity, product innovation, supply-chain resilience, and market risks from material costs and regulatory shifts. Want deeper, actionable insights? Purchase the full SWOT analysis for an editable, research-backed report and Excel tools to inform strategy, investment, or competitive planning.
Strengths
Iconic brand recognition
Andersen, founded in 1903, leverages over 120 years of trust among homeowners, builders and architects to sustain top-tier brand recognition in windows and doors. This legacy brand equity underpins pricing power and strong dealer pull-through, lowering customer acquisition costs. Recognition also facilitates cross-selling across Andersen’s product lines and subsidiaries, boosting lifetime customer value.
Diversified product portfolio
Andersen offers wood, composite, fiberglass, vinyl and aluminum across styles and price tiers, serving new construction, remodeling and replacement use-cases; this breadth hedges material and demand shifts and enables specification for varied climates and performance needs. Andersen, founded in 1903, reported revenues exceeding $3.7 billion in 2022 and employs roughly 12,000 people.
Multi-channel distribution
Andersen’s products reach customers through independent dealers, big-box retailers, and its owned brands’ networks, leveraging a multi-channel footprint that supports its century-plus legacy (founded 1903) and roughly 13,000 employees. Multiple routes improve market coverage and resilience to channel-specific downturns. Dealers provide specification support for pros, while retail captures DIY demand, together boosting visibility and sales velocity.
Energy-efficient and premium performance
Andersen emphasizes energy efficiency, durability and broad design options, offering high-performance glazing and frames that meet evolving codes and ENERGY STAR criteria; DOE estimates efficient window upgrades cut heating/cooling energy 7–15%. These products support incentive-driven projects and rebates through 2024–2025 and differentiate Andersen from low-cost imports by commanding premium pricing and higher margins.
- Energy savings: 7–15% (DOE)
- Code alignment: IECC/ENERGY STAR-ready
- Competitive edge: premium vs imports
Portfolio of brands
Operating multiple brands allows Andersen to target distinct segments and price points through differentiated offerings such as Andersen and Renewal by Andersen, enhancing reach across customer cohorts. Brand architecture reduces cannibalization and improves market penetration by clearly positioning premium and value lines. It enables tailored marketing and dealer strategies and provides flexibility for staged innovation rollouts.
- Targeting: distinct segments & price points
- Reduced cannibalization, improved penetration
- Tailored marketing & dealer strategies
- Flexible staged innovation rollouts
Century brand fuels pricing power; $3.7B, 7–15%
Century-long brand (founded 1903) drives pricing power and dealer pull-through. Broad material mix and multi-channel distribution (dealers, big-box, owned brands) diversify demand and reduce risk. Energy-efficient, code-ready products (DOE savings 7–15%) support premium margins; 2022 revenue ~ $3.7B, ~13,000 employees.
| Metric | Value |
|---|---|
| Revenue (2022) | $3.7B |
| Employees | ~13,000 |
| DOE energy savings | 7–15% |
What is included in the product
Detailed Word Document
Provides a concise SWOT analysis of Andersen Corporation, outlining internal strengths and weaknesses alongside external opportunities and threats to assess its competitive position, growth drivers, and strategic risks.
Customizable Excel Spreadsheet
Provides a concise SWOT matrix for Andersen Corporation to quickly align strategy across product lines and markets, highlighting strengths in brand and distribution while flagging risks like supply-chain exposure and regulatory pressures for faster, focused decision-making.
Weaknesses
Exposure to cyclical construction
Andersen’s demand tracks housing starts, remodeling and commercial cycles; U.S. housing starts averaged about 1.3M annualized in 2024 and remodeling remained uneven. Shifts in 30-year mortgage rates (around 6.9% in 2024) and swings in consumer confidence have reduced orders. This cyclicality pressures plant utilization and gross margins, and makes forecasting harder in volatile macro conditions.
Premium pricing limits reach
Andersen’s higher-end positioning can deter price-sensitive buyers, limiting penetration into value-driven households; as a privately held leader with approximately 13,000 employees, the firm risks ceding entry-level share to lower-cost rivals. In downturns—when renovation and new-build volumes drop—premium pricing can constrain unit sales. Deep discounting to chase volume risks brand dilution and margin erosion.
Material and input cost sensitivity
Wood, glass, resins and aluminum price swings materially move Andersen’s COGS—lumber and resin spikes in 2020–22 (lumber futures rose sharply, peak-year moves exceeded 50%) and continued volatility into 2024 press margins.
Freight and logistics volatility (container and trucking cost swings of double-digit percent in 2021–24) add further input-cost pressure and unpredictability to sourcing.
Passing costs to customers often lags market spikes, while hedging and supplier concentration introduce execution and supply-risk that can erode profitability.
Complex supply chain and lead times
Complex supply chain: thousands of custom configurations and SKU permutations complicate planning; lead-time variability (commonly 4–12+ weeks) frustrates dealers and installers, while bottlenecks ripple through project schedules and amplify delay risk. Service failures can erode dealer and consumer trust and harm market reputation.
- Thousands of SKUs increase planning complexity
- Lead times 4–12+ weeks frustrate partners
- Bottlenecks delay projects
- Service lapses risk reputational damage
Geographic concentration in North America
Andersen Corporation's sales remain heavily tied to North American markets, concentrating revenue and exposing the firm to regional housing and construction cycles.
Limited global diversification raises regional risk exposure, constrains currency and overseas growth optionality, and reduces natural hedges against local downturns.
- Geographic concentration: North America-dependent
- Risk exposure: regional housing cycle sensitivity
- Growth constraint: limited international optionality
- Hedge deficit: minimal natural offset for local downturns
Premium windows face demand squeeze as U.S. starts ~1.3M, 30-yr ~6.9%
Andersen is highly cyclical—U.S. housing starts ~1.3M annualized in 2024 and 30-year mortgage ~6.9% in 2024—pressuring orders, utilization and margins. Premium positioning and ~13,000 employees limit penetration into value segments and can force margin-eroding discounts in downturns. Input cost volatility (lumber/resin spikes >50% peak moves) plus freight swings and complex SKUs lengthen lead times and raise service risk.
| Metric | 2024/Recent |
|---|---|
| U.S. housing starts | ~1.3M |
| 30-yr mortgage rate | ~6.9% |
| Employees | ~13,000 |
| Lumber/resin moves | peak >50% |
What You See Is What You Get
Andersen Corporation SWOT Analysis
This is the actual SWOT analysis document you’ll receive upon purchase—no surprises, just professional quality. The preview below is taken directly from the full SWOT report you'll get, with the same structured strengths, weaknesses, opportunities and threats for Andersen Corporation. Purchase unlocks the complete, editable version ready for immediate download.
Original: $10.00
-65%$10.00
$3.50Description
Your Strategic Toolkit Starts Here
Explore a concise SWOT snapshot of Andersen Corporation—highlighting strong brand equity, product innovation, supply-chain resilience, and market risks from material costs and regulatory shifts. Want deeper, actionable insights? Purchase the full SWOT analysis for an editable, research-backed report and Excel tools to inform strategy, investment, or competitive planning.
Strengths
Iconic brand recognition
Andersen, founded in 1903, leverages over 120 years of trust among homeowners, builders and architects to sustain top-tier brand recognition in windows and doors. This legacy brand equity underpins pricing power and strong dealer pull-through, lowering customer acquisition costs. Recognition also facilitates cross-selling across Andersen’s product lines and subsidiaries, boosting lifetime customer value.
Diversified product portfolio
Andersen offers wood, composite, fiberglass, vinyl and aluminum across styles and price tiers, serving new construction, remodeling and replacement use-cases; this breadth hedges material and demand shifts and enables specification for varied climates and performance needs. Andersen, founded in 1903, reported revenues exceeding $3.7 billion in 2022 and employs roughly 12,000 people.
Multi-channel distribution
Andersen’s products reach customers through independent dealers, big-box retailers, and its owned brands’ networks, leveraging a multi-channel footprint that supports its century-plus legacy (founded 1903) and roughly 13,000 employees. Multiple routes improve market coverage and resilience to channel-specific downturns. Dealers provide specification support for pros, while retail captures DIY demand, together boosting visibility and sales velocity.
Energy-efficient and premium performance
Andersen emphasizes energy efficiency, durability and broad design options, offering high-performance glazing and frames that meet evolving codes and ENERGY STAR criteria; DOE estimates efficient window upgrades cut heating/cooling energy 7–15%. These products support incentive-driven projects and rebates through 2024–2025 and differentiate Andersen from low-cost imports by commanding premium pricing and higher margins.
- Energy savings: 7–15% (DOE)
- Code alignment: IECC/ENERGY STAR-ready
- Competitive edge: premium vs imports
Portfolio of brands
Operating multiple brands allows Andersen to target distinct segments and price points through differentiated offerings such as Andersen and Renewal by Andersen, enhancing reach across customer cohorts. Brand architecture reduces cannibalization and improves market penetration by clearly positioning premium and value lines. It enables tailored marketing and dealer strategies and provides flexibility for staged innovation rollouts.
- Targeting: distinct segments & price points
- Reduced cannibalization, improved penetration
- Tailored marketing & dealer strategies
- Flexible staged innovation rollouts
Century brand fuels pricing power; $3.7B, 7–15%
Century-long brand (founded 1903) drives pricing power and dealer pull-through. Broad material mix and multi-channel distribution (dealers, big-box, owned brands) diversify demand and reduce risk. Energy-efficient, code-ready products (DOE savings 7–15%) support premium margins; 2022 revenue ~ $3.7B, ~13,000 employees.
| Metric | Value |
|---|---|
| Revenue (2022) | $3.7B |
| Employees | ~13,000 |
| DOE energy savings | 7–15% |
What is included in the product
Detailed Word Document
Provides a concise SWOT analysis of Andersen Corporation, outlining internal strengths and weaknesses alongside external opportunities and threats to assess its competitive position, growth drivers, and strategic risks.
Customizable Excel Spreadsheet
Provides a concise SWOT matrix for Andersen Corporation to quickly align strategy across product lines and markets, highlighting strengths in brand and distribution while flagging risks like supply-chain exposure and regulatory pressures for faster, focused decision-making.
Weaknesses
Exposure to cyclical construction
Andersen’s demand tracks housing starts, remodeling and commercial cycles; U.S. housing starts averaged about 1.3M annualized in 2024 and remodeling remained uneven. Shifts in 30-year mortgage rates (around 6.9% in 2024) and swings in consumer confidence have reduced orders. This cyclicality pressures plant utilization and gross margins, and makes forecasting harder in volatile macro conditions.
Premium pricing limits reach
Andersen’s higher-end positioning can deter price-sensitive buyers, limiting penetration into value-driven households; as a privately held leader with approximately 13,000 employees, the firm risks ceding entry-level share to lower-cost rivals. In downturns—when renovation and new-build volumes drop—premium pricing can constrain unit sales. Deep discounting to chase volume risks brand dilution and margin erosion.
Material and input cost sensitivity
Wood, glass, resins and aluminum price swings materially move Andersen’s COGS—lumber and resin spikes in 2020–22 (lumber futures rose sharply, peak-year moves exceeded 50%) and continued volatility into 2024 press margins.
Freight and logistics volatility (container and trucking cost swings of double-digit percent in 2021–24) add further input-cost pressure and unpredictability to sourcing.
Passing costs to customers often lags market spikes, while hedging and supplier concentration introduce execution and supply-risk that can erode profitability.
Complex supply chain and lead times
Complex supply chain: thousands of custom configurations and SKU permutations complicate planning; lead-time variability (commonly 4–12+ weeks) frustrates dealers and installers, while bottlenecks ripple through project schedules and amplify delay risk. Service failures can erode dealer and consumer trust and harm market reputation.
- Thousands of SKUs increase planning complexity
- Lead times 4–12+ weeks frustrate partners
- Bottlenecks delay projects
- Service lapses risk reputational damage
Geographic concentration in North America
Andersen Corporation's sales remain heavily tied to North American markets, concentrating revenue and exposing the firm to regional housing and construction cycles.
Limited global diversification raises regional risk exposure, constrains currency and overseas growth optionality, and reduces natural hedges against local downturns.
- Geographic concentration: North America-dependent
- Risk exposure: regional housing cycle sensitivity
- Growth constraint: limited international optionality
- Hedge deficit: minimal natural offset for local downturns
Premium windows face demand squeeze as U.S. starts ~1.3M, 30-yr ~6.9%
Andersen is highly cyclical—U.S. housing starts ~1.3M annualized in 2024 and 30-year mortgage ~6.9% in 2024—pressuring orders, utilization and margins. Premium positioning and ~13,000 employees limit penetration into value segments and can force margin-eroding discounts in downturns. Input cost volatility (lumber/resin spikes >50% peak moves) plus freight swings and complex SKUs lengthen lead times and raise service risk.
| Metric | 2024/Recent |
|---|---|
| U.S. housing starts | ~1.3M |
| 30-yr mortgage rate | ~6.9% |
| Employees | ~13,000 |
| Lumber/resin moves | peak >50% |
What You See Is What You Get
Andersen Corporation SWOT Analysis
This is the actual SWOT analysis document you’ll receive upon purchase—no surprises, just professional quality. The preview below is taken directly from the full SWOT report you'll get, with the same structured strengths, weaknesses, opportunities and threats for Andersen Corporation. Purchase unlocks the complete, editable version ready for immediate download.











