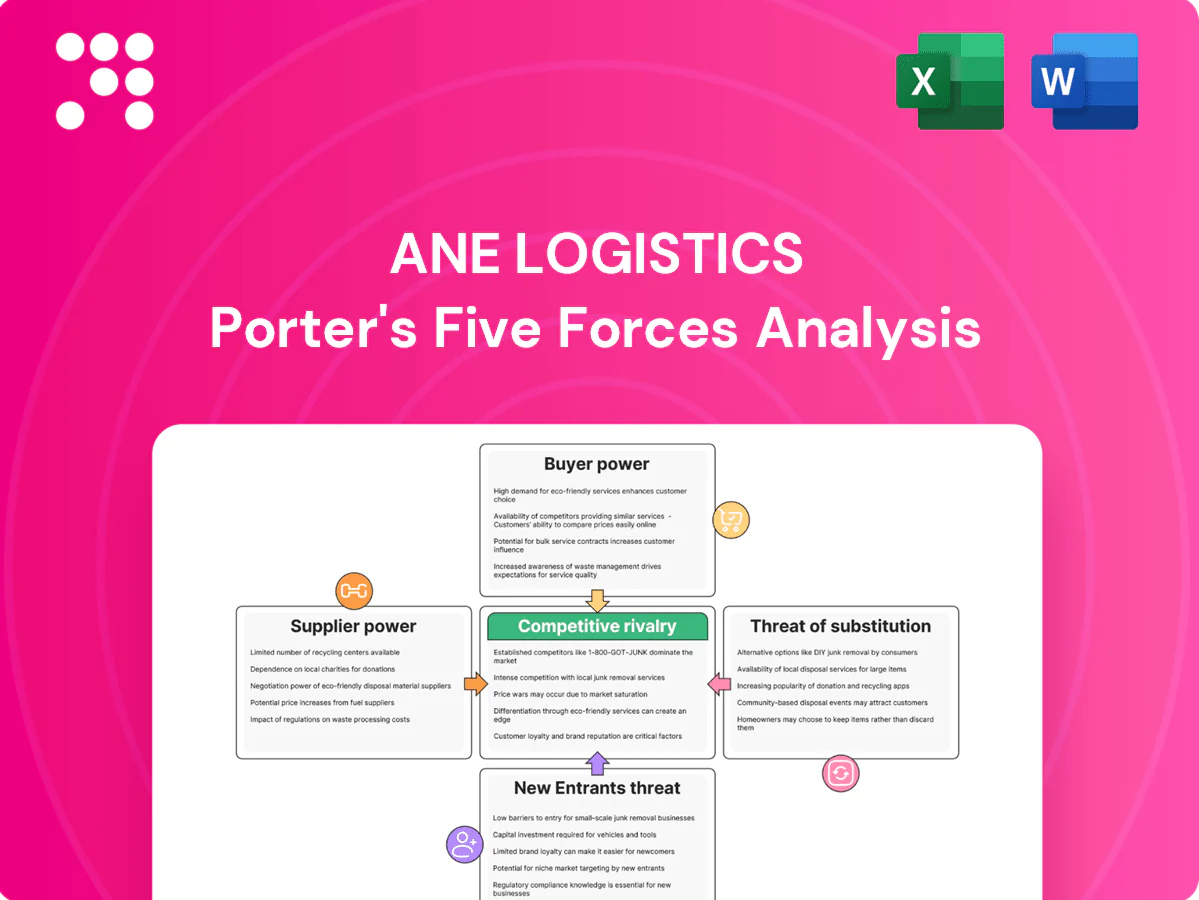
ANE Logistics Porter's Five Forces Analysis

Go Beyond the Preview—Access the Full Strategic Report
ANE Logistics faces moderate supplier leverage, intensifying rivalry among regional carriers, and growing buyer sophistication that pressures margins; threat of new entrants is tempered by scale and regulatory hurdles while substitutes (multimodal options) pose targeted risks. This snapshot highlights key competitive pressures and strategic levers. Unlock the full Porter's Five Forces Analysis for force-by-force ratings, visuals, and actionable recommendations.
Suppliers Bargaining Power

Fuel and energy dependency
ANE Logistics’ operating costs remain highly exposed to diesel and energy prices set by a concentrated refining and OPEC+ influenced market; Brent crude averaged about 85 USD/bbl in 2024, keeping diesel elevated. Fuel surcharges mitigate but do not eliminate volatility, and suppliers gain leverage during tight supply cycles. Hedging programs and efficiency initiatives have partially rebalanced supplier power.
Truck OEMs and parts concentration
Truck OEMs and key component suppliers remain concentrated, with the top five OEMs holding roughly 70% of global heavy‑duty market share in 2024 and top tire/axle/telematics vendors controlling about 60% of supply; lead times of 3–9 months for trucks and critical parts in 2024 have tightened fleet availability and pushed up pricing; ANE mitigates exposure via bulk purchasing (typically 5–15% savings), multi‑sourcing, preventive maintenance and standardized fleets to strengthen negotiating leverage.

Terminal real estate and leaseholders
Hub-and-spoke networks need strategically located cross-dock terminals, but desirable nodes are controlled by a limited set of landlords, boosting supplier bargaining power. Long-term leases and build-to-suit deals, typically 5–15 years, lock in terms and reduce operational flexibility. Network optimization tools can substitute locations and have been shown in industry studies to trim real-estate spend by up to 15%, easing rent pressure.

Driver and labor market dynamics
LTL operations rely heavily on dock workers and linehaul/P&D drivers; local labor tightness elevates supplier leverage, with the American Trucking Associations estimating a ~80,000 driver shortfall in 2023–24 and industry wage inflation of roughly 6–8% pushing labor costs higher. Robust training pipelines, retention programs, and rising automation/dock redesign have begun to blunt that leverage by lowering dependence on scarce labor.
- Driver shortfall: ATA ~80,000 (2023–24)
- Wage inflation: ~6–8% (2023–24)
- Turnover mitigation: training/retention programs
- Capital mitigation: automation and dock redesign reduce reliance
IT, telematics, and SaaS vendors
- Vendor power: high due to integration costs
- Substitutability: improving via API-first stacks
- Negotiation: volume licensing and co-innovation lower effective prices
Supplier power: fuel 85 USD/bbl, drivers short 80k
ANE faces elevated supplier power from fuel (Brent ~85 USD/bbl in 2024), concentrated OEMs (top 5 ~70% HD market), scarce labor (ATA ~80,000 driver shortfall; wage inflation ~6–8% in 2023–24) and mission‑critical TMS vendors (global TMS ~$3.2B in 2024); mitigation includes hedging, bulk purchasing (5–15% savings), multi‑sourcing, long leases and tech-led substitutability.
| Metric | 2024/2023–24 |
|---|---|
| Brent crude | ~85 USD/bbl |
| Top 5 OEM share | ~70% |
| Driver shortfall | ~80,000 |
| Wage inflation | ~6–8% |
| TMS market | ~3.2B USD |
What is included in the product
 Detailed Word Document
Uncovers key drivers of competition, buyer and supplier power, entry barriers, substitutes and disruptive threats specific to ANE Logistics, with strategic commentary for investor decks, business plans, or internal strategy.

 Customizable Excel Spreadsheet
A concise one-sheet Porter's Five Forces for ANE Logistics that instantly highlights competitive pain points and relieves decision bottlenecks; customize pressure levels, swap in your data, and drop the chart directly into decks or dashboards without macros.
Customers Bargaining Power

Diverse B2B shipper base
ANE serves multiple industries, moderating reliance on any single customer, while the global 3PL market in 2024 is ~1.37 trillion USD, underscoring broad demand; large enterprise shippers still aggregate volume and extract aggressive concessions; ANE uses tiered pricing and customized SLAs to trade margin for stickiness; systematic segmentation by customer profitability preserves pricing discipline and protects overall margins.
Price transparency and benchmarking
Spot and contract rates for LTL are widely benchmarked across carriers and 3PLs, with buyers routinely soliciting multi-quote comparisons from 10+ providers via eProcurement platforms that shorten sourcing cycles and reveal margin windows. This transparency lets shippers squeeze carrier margins on commoditized lanes, while differentiated service metrics — on-time delivery and claims rates — allow carriers to command premiums where reliability is critical.

Switching costs and service stickiness
Operational switching costs for shippers are moderate: standardized pallets, labels and widespread EDI reduce entry barriers, yet deep integrations, claims-handling knowledge and ANE’s network coverage create tangible friction.
Performance-based contracts and KPIs—common in 2024 3PL agreements as the global 3PL market approached $1.46 trillion—entrench relationships.
Proactive exception management and localized account expertise further raise perceived switching costs and customer inertia.

Consolidators and 3PL intermediation
3PLs and freight brokers pooled demand drives price pressure — the global 3PL market was about $1.2 trillion in 2024, enabling brokers to extract volume discounts and compress carrier yields by an estimated 2–5 percentage points. ANE can offset leverage by offering white‑label capacity, value‑add services and trading forecasting data to win 5–15% better rates through improved load planning.
- Scale: 3PL market ~$1.2T (2024)
- Yield impact: carrier margins compressed ~2–5 pp
- ANE levers: white‑label, premium services, data-for-rate swaps (5–15% rate upside)
Service-level sensitivity
Time-definite, damage-sensitive freight drives buyer dependence on high-quality carriers; 2024 industry surveys report median OTIF around 92% and claims rates concentrated under 1.5%, elevating service premiums. In commoditized lanes price dominates, increasing buyer power, while differentiation via OTIF, low claims and real-time visibility tempers that power. Lane-level profitability analytics (margin per lane) in 2024 is critical to protect sensitive-freight margins.
- OTIF ~92% (2024)
- Claims ≤1.5% (2024)
- Price wins in commoditized lanes
- Lane-level margin analytics protect sensitive freight
Service quality and data-driven services offset brokered demand yield compression
ANE faces strong buyer bargaining in commoditized lanes due to benchmarking and eProcurement, but diversified industry exposure and tiered SLAs preserve pricing discipline. Service-sensitive freight (OTIF ~92%, claims ≤1.5% in 2024) reduces buyer power and supports premiums. Brokered pooled demand compresses yields (~2–5 pp) while ANE can recapture 5–15% via data, white‑label and premium services.
| Metric | 2024 Value |
|---|---|
| Global 3PL market | ~1.2–1.46T USD |
| OTIF | ~92% |
| Claims rate | ≤1.5% |
| Yield compression | ~2–5 pp |
| ANE rate upside | ~5–15% |
Full Version Awaits
ANE Logistics Porter's Five Forces Analysis
This Porter's Five Forces analysis of ANE Logistics examines competitive rivalry, supplier and buyer power, threat of new entrants and substitutes, and industry dynamics to inform strategic decisions. This preview is the exact document you’ll receive upon purchase—fully formatted, professional, and ready for immediate download. No placeholders or samples: what you see is what you get.

Go Beyond the Preview—Access the Full Strategic Report
ANE Logistics faces moderate supplier leverage, intensifying rivalry among regional carriers, and growing buyer sophistication that pressures margins; threat of new entrants is tempered by scale and regulatory hurdles while substitutes (multimodal options) pose targeted risks. This snapshot highlights key competitive pressures and strategic levers. Unlock the full Porter's Five Forces Analysis for force-by-force ratings, visuals, and actionable recommendations.
Suppliers Bargaining Power
Fuel and energy dependency
ANE Logistics’ operating costs remain highly exposed to diesel and energy prices set by a concentrated refining and OPEC+ influenced market; Brent crude averaged about 85 USD/bbl in 2024, keeping diesel elevated. Fuel surcharges mitigate but do not eliminate volatility, and suppliers gain leverage during tight supply cycles. Hedging programs and efficiency initiatives have partially rebalanced supplier power.
Truck OEMs and parts concentration
Truck OEMs and key component suppliers remain concentrated, with the top five OEMs holding roughly 70% of global heavy‑duty market share in 2024 and top tire/axle/telematics vendors controlling about 60% of supply; lead times of 3–9 months for trucks and critical parts in 2024 have tightened fleet availability and pushed up pricing; ANE mitigates exposure via bulk purchasing (typically 5–15% savings), multi‑sourcing, preventive maintenance and standardized fleets to strengthen negotiating leverage.
Terminal real estate and leaseholders
Hub-and-spoke networks need strategically located cross-dock terminals, but desirable nodes are controlled by a limited set of landlords, boosting supplier bargaining power. Long-term leases and build-to-suit deals, typically 5–15 years, lock in terms and reduce operational flexibility. Network optimization tools can substitute locations and have been shown in industry studies to trim real-estate spend by up to 15%, easing rent pressure.
Driver and labor market dynamics
LTL operations rely heavily on dock workers and linehaul/P&D drivers; local labor tightness elevates supplier leverage, with the American Trucking Associations estimating a ~80,000 driver shortfall in 2023–24 and industry wage inflation of roughly 6–8% pushing labor costs higher. Robust training pipelines, retention programs, and rising automation/dock redesign have begun to blunt that leverage by lowering dependence on scarce labor.
- Driver shortfall: ATA ~80,000 (2023–24)
- Wage inflation: ~6–8% (2023–24)
- Turnover mitigation: training/retention programs
- Capital mitigation: automation and dock redesign reduce reliance
IT, telematics, and SaaS vendors
- Vendor power: high due to integration costs
- Substitutability: improving via API-first stacks
- Negotiation: volume licensing and co-innovation lower effective prices
Supplier power: fuel 85 USD/bbl, drivers short 80k
ANE faces elevated supplier power from fuel (Brent ~85 USD/bbl in 2024), concentrated OEMs (top 5 ~70% HD market), scarce labor (ATA ~80,000 driver shortfall; wage inflation ~6–8% in 2023–24) and mission‑critical TMS vendors (global TMS ~$3.2B in 2024); mitigation includes hedging, bulk purchasing (5–15% savings), multi‑sourcing, long leases and tech-led substitutability.
| Metric | 2024/2023–24 |
|---|---|
| Brent crude | ~85 USD/bbl |
| Top 5 OEM share | ~70% |
| Driver shortfall | ~80,000 |
| Wage inflation | ~6–8% |
| TMS market | ~3.2B USD |
What is included in the product
Detailed Word Document
Uncovers key drivers of competition, buyer and supplier power, entry barriers, substitutes and disruptive threats specific to ANE Logistics, with strategic commentary for investor decks, business plans, or internal strategy.
Customizable Excel Spreadsheet
A concise one-sheet Porter's Five Forces for ANE Logistics that instantly highlights competitive pain points and relieves decision bottlenecks; customize pressure levels, swap in your data, and drop the chart directly into decks or dashboards without macros.
Customers Bargaining Power
Diverse B2B shipper base
ANE serves multiple industries, moderating reliance on any single customer, while the global 3PL market in 2024 is ~1.37 trillion USD, underscoring broad demand; large enterprise shippers still aggregate volume and extract aggressive concessions; ANE uses tiered pricing and customized SLAs to trade margin for stickiness; systematic segmentation by customer profitability preserves pricing discipline and protects overall margins.
Price transparency and benchmarking
Spot and contract rates for LTL are widely benchmarked across carriers and 3PLs, with buyers routinely soliciting multi-quote comparisons from 10+ providers via eProcurement platforms that shorten sourcing cycles and reveal margin windows. This transparency lets shippers squeeze carrier margins on commoditized lanes, while differentiated service metrics — on-time delivery and claims rates — allow carriers to command premiums where reliability is critical.
Switching costs and service stickiness
Operational switching costs for shippers are moderate: standardized pallets, labels and widespread EDI reduce entry barriers, yet deep integrations, claims-handling knowledge and ANE’s network coverage create tangible friction.
Performance-based contracts and KPIs—common in 2024 3PL agreements as the global 3PL market approached $1.46 trillion—entrench relationships.
Proactive exception management and localized account expertise further raise perceived switching costs and customer inertia.
Consolidators and 3PL intermediation
3PLs and freight brokers pooled demand drives price pressure — the global 3PL market was about $1.2 trillion in 2024, enabling brokers to extract volume discounts and compress carrier yields by an estimated 2–5 percentage points. ANE can offset leverage by offering white‑label capacity, value‑add services and trading forecasting data to win 5–15% better rates through improved load planning.
- Scale: 3PL market ~$1.2T (2024)
- Yield impact: carrier margins compressed ~2–5 pp
- ANE levers: white‑label, premium services, data-for-rate swaps (5–15% rate upside)
Service-level sensitivity
Time-definite, damage-sensitive freight drives buyer dependence on high-quality carriers; 2024 industry surveys report median OTIF around 92% and claims rates concentrated under 1.5%, elevating service premiums. In commoditized lanes price dominates, increasing buyer power, while differentiation via OTIF, low claims and real-time visibility tempers that power. Lane-level profitability analytics (margin per lane) in 2024 is critical to protect sensitive-freight margins.
- OTIF ~92% (2024)
- Claims ≤1.5% (2024)
- Price wins in commoditized lanes
- Lane-level margin analytics protect sensitive freight
Service quality and data-driven services offset brokered demand yield compression
ANE faces strong buyer bargaining in commoditized lanes due to benchmarking and eProcurement, but diversified industry exposure and tiered SLAs preserve pricing discipline. Service-sensitive freight (OTIF ~92%, claims ≤1.5% in 2024) reduces buyer power and supports premiums. Brokered pooled demand compresses yields (~2–5 pp) while ANE can recapture 5–15% via data, white‑label and premium services.
| Metric | 2024 Value |
|---|---|
| Global 3PL market | ~1.2–1.46T USD |
| OTIF | ~92% |
| Claims rate | ≤1.5% |
| Yield compression | ~2–5 pp |
| ANE rate upside | ~5–15% |
Full Version Awaits
ANE Logistics Porter's Five Forces Analysis
This Porter's Five Forces analysis of ANE Logistics examines competitive rivalry, supplier and buyer power, threat of new entrants and substitutes, and industry dynamics to inform strategic decisions. This preview is the exact document you’ll receive upon purchase—fully formatted, professional, and ready for immediate download. No placeholders or samples: what you see is what you get.
Original: $10.00
-65%$10.00
$3.50Description
Go Beyond the Preview—Access the Full Strategic Report
ANE Logistics faces moderate supplier leverage, intensifying rivalry among regional carriers, and growing buyer sophistication that pressures margins; threat of new entrants is tempered by scale and regulatory hurdles while substitutes (multimodal options) pose targeted risks. This snapshot highlights key competitive pressures and strategic levers. Unlock the full Porter's Five Forces Analysis for force-by-force ratings, visuals, and actionable recommendations.
Suppliers Bargaining Power
Fuel and energy dependency
ANE Logistics’ operating costs remain highly exposed to diesel and energy prices set by a concentrated refining and OPEC+ influenced market; Brent crude averaged about 85 USD/bbl in 2024, keeping diesel elevated. Fuel surcharges mitigate but do not eliminate volatility, and suppliers gain leverage during tight supply cycles. Hedging programs and efficiency initiatives have partially rebalanced supplier power.
Truck OEMs and parts concentration
Truck OEMs and key component suppliers remain concentrated, with the top five OEMs holding roughly 70% of global heavy‑duty market share in 2024 and top tire/axle/telematics vendors controlling about 60% of supply; lead times of 3–9 months for trucks and critical parts in 2024 have tightened fleet availability and pushed up pricing; ANE mitigates exposure via bulk purchasing (typically 5–15% savings), multi‑sourcing, preventive maintenance and standardized fleets to strengthen negotiating leverage.
Terminal real estate and leaseholders
Hub-and-spoke networks need strategically located cross-dock terminals, but desirable nodes are controlled by a limited set of landlords, boosting supplier bargaining power. Long-term leases and build-to-suit deals, typically 5–15 years, lock in terms and reduce operational flexibility. Network optimization tools can substitute locations and have been shown in industry studies to trim real-estate spend by up to 15%, easing rent pressure.
Driver and labor market dynamics
LTL operations rely heavily on dock workers and linehaul/P&D drivers; local labor tightness elevates supplier leverage, with the American Trucking Associations estimating a ~80,000 driver shortfall in 2023–24 and industry wage inflation of roughly 6–8% pushing labor costs higher. Robust training pipelines, retention programs, and rising automation/dock redesign have begun to blunt that leverage by lowering dependence on scarce labor.
- Driver shortfall: ATA ~80,000 (2023–24)
- Wage inflation: ~6–8% (2023–24)
- Turnover mitigation: training/retention programs
- Capital mitigation: automation and dock redesign reduce reliance
IT, telematics, and SaaS vendors
- Vendor power: high due to integration costs
- Substitutability: improving via API-first stacks
- Negotiation: volume licensing and co-innovation lower effective prices
Supplier power: fuel 85 USD/bbl, drivers short 80k
ANE faces elevated supplier power from fuel (Brent ~85 USD/bbl in 2024), concentrated OEMs (top 5 ~70% HD market), scarce labor (ATA ~80,000 driver shortfall; wage inflation ~6–8% in 2023–24) and mission‑critical TMS vendors (global TMS ~$3.2B in 2024); mitigation includes hedging, bulk purchasing (5–15% savings), multi‑sourcing, long leases and tech-led substitutability.
| Metric | 2024/2023–24 |
|---|---|
| Brent crude | ~85 USD/bbl |
| Top 5 OEM share | ~70% |
| Driver shortfall | ~80,000 |
| Wage inflation | ~6–8% |
| TMS market | ~3.2B USD |
What is included in the product
Detailed Word Document
Uncovers key drivers of competition, buyer and supplier power, entry barriers, substitutes and disruptive threats specific to ANE Logistics, with strategic commentary for investor decks, business plans, or internal strategy.
Customizable Excel Spreadsheet
A concise one-sheet Porter's Five Forces for ANE Logistics that instantly highlights competitive pain points and relieves decision bottlenecks; customize pressure levels, swap in your data, and drop the chart directly into decks or dashboards without macros.
Customers Bargaining Power
Diverse B2B shipper base
ANE serves multiple industries, moderating reliance on any single customer, while the global 3PL market in 2024 is ~1.37 trillion USD, underscoring broad demand; large enterprise shippers still aggregate volume and extract aggressive concessions; ANE uses tiered pricing and customized SLAs to trade margin for stickiness; systematic segmentation by customer profitability preserves pricing discipline and protects overall margins.
Price transparency and benchmarking
Spot and contract rates for LTL are widely benchmarked across carriers and 3PLs, with buyers routinely soliciting multi-quote comparisons from 10+ providers via eProcurement platforms that shorten sourcing cycles and reveal margin windows. This transparency lets shippers squeeze carrier margins on commoditized lanes, while differentiated service metrics — on-time delivery and claims rates — allow carriers to command premiums where reliability is critical.
Switching costs and service stickiness
Operational switching costs for shippers are moderate: standardized pallets, labels and widespread EDI reduce entry barriers, yet deep integrations, claims-handling knowledge and ANE’s network coverage create tangible friction.
Performance-based contracts and KPIs—common in 2024 3PL agreements as the global 3PL market approached $1.46 trillion—entrench relationships.
Proactive exception management and localized account expertise further raise perceived switching costs and customer inertia.
Consolidators and 3PL intermediation
3PLs and freight brokers pooled demand drives price pressure — the global 3PL market was about $1.2 trillion in 2024, enabling brokers to extract volume discounts and compress carrier yields by an estimated 2–5 percentage points. ANE can offset leverage by offering white‑label capacity, value‑add services and trading forecasting data to win 5–15% better rates through improved load planning.
- Scale: 3PL market ~$1.2T (2024)
- Yield impact: carrier margins compressed ~2–5 pp
- ANE levers: white‑label, premium services, data-for-rate swaps (5–15% rate upside)
Service-level sensitivity
Time-definite, damage-sensitive freight drives buyer dependence on high-quality carriers; 2024 industry surveys report median OTIF around 92% and claims rates concentrated under 1.5%, elevating service premiums. In commoditized lanes price dominates, increasing buyer power, while differentiation via OTIF, low claims and real-time visibility tempers that power. Lane-level profitability analytics (margin per lane) in 2024 is critical to protect sensitive-freight margins.
- OTIF ~92% (2024)
- Claims ≤1.5% (2024)
- Price wins in commoditized lanes
- Lane-level margin analytics protect sensitive freight
Service quality and data-driven services offset brokered demand yield compression
ANE faces strong buyer bargaining in commoditized lanes due to benchmarking and eProcurement, but diversified industry exposure and tiered SLAs preserve pricing discipline. Service-sensitive freight (OTIF ~92%, claims ≤1.5% in 2024) reduces buyer power and supports premiums. Brokered pooled demand compresses yields (~2–5 pp) while ANE can recapture 5–15% via data, white‑label and premium services.
| Metric | 2024 Value |
|---|---|
| Global 3PL market | ~1.2–1.46T USD |
| OTIF | ~92% |
| Claims rate | ≤1.5% |
| Yield compression | ~2–5 pp |
| ANE rate upside | ~5–15% |
Full Version Awaits
ANE Logistics Porter's Five Forces Analysis
This Porter's Five Forces analysis of ANE Logistics examines competitive rivalry, supplier and buyer power, threat of new entrants and substitutes, and industry dynamics to inform strategic decisions. This preview is the exact document you’ll receive upon purchase—fully formatted, professional, and ready for immediate download. No placeholders or samples: what you see is what you get.











