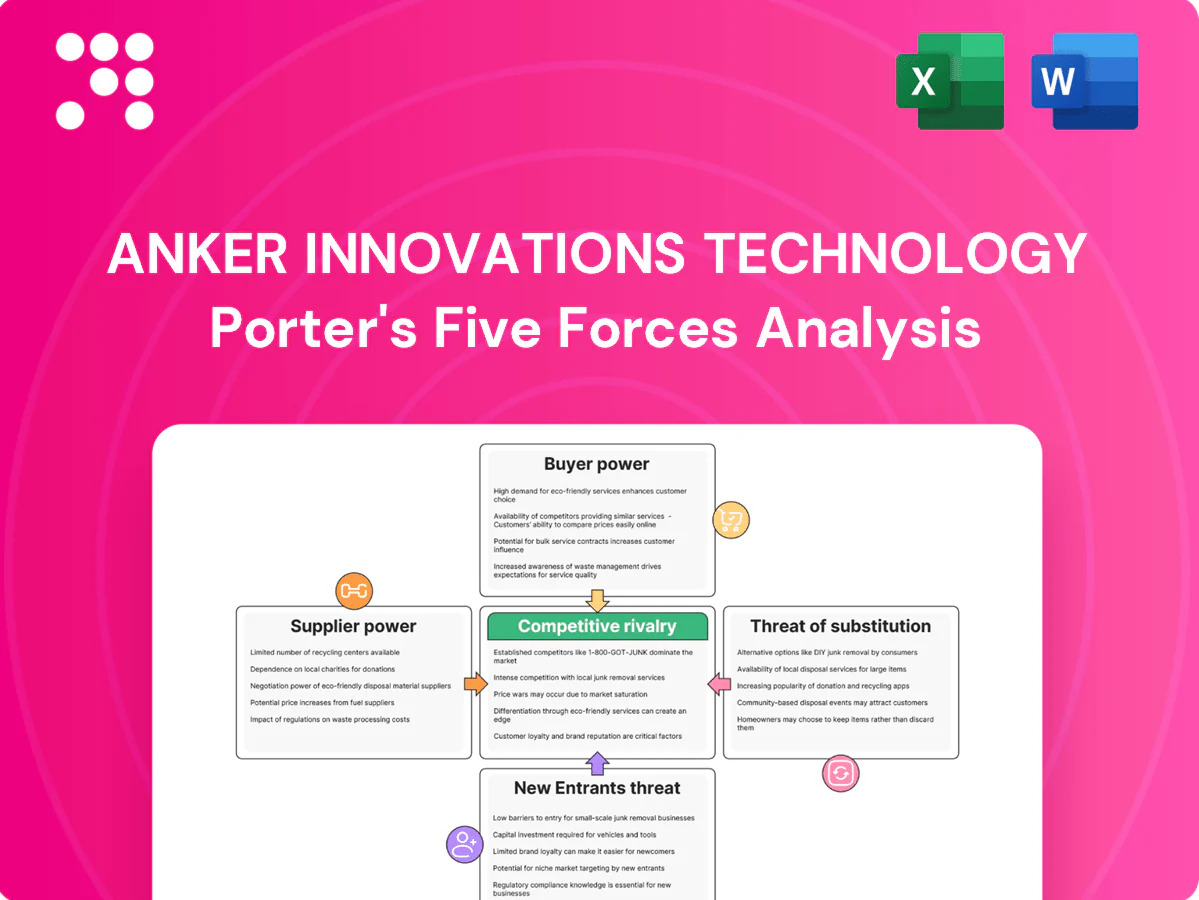
Anker Innovations Technology Porter's Five Forces Analysis

A Must-Have Tool for Decision-Makers
Anker Innovations faces intense buyer bargaining, strong substitute threats in consumer electronics, concentrated supplier leverage for key components, moderate new-entrant barriers, and fierce rivalry among branded and white-label players; this snapshot highlights strategic pressure points. Unlock the full Porter's Five Forces Analysis to explore detailed force ratings, visuals, and actionable recommendations.
Suppliers Bargaining Power

Concentrated critical components
High-spec batteries, GaN power ICs and advanced chipsets are sourced from a concentrated supplier base—top global cell producers and leading GaN vendors dominate capacity—giving suppliers strong leverage. Supply shocks or node constraints drive longer lead times and higher prices; qualification cycles often take 6–12 months, slowing substitution. Dual-sourcing and design-for-substitution mitigate risk, while multi-year contracts stabilize availability and cost.
Dependence on EMS/ODM partners
Manufacturing flexibility for Anker depends on a small set of capable EMS/ODM partners that drive quality and yield, with 2024 industry reports indicating top EMS often allocate roughly 60–70% of capacity to their largest customers, squeezing smaller runs. Capacity prioritization thus raises pricing and lead-time pressure on Anker for niche SKUs. Tight process IP and compressed NPI timelines increase switching frictions and cost. Co-location and joint planning with EMS partners materially reduce disruption risk.

Compliance and certification gatekeeping
Suppliers for Anker must clear UL, CE, FCC, Qi2 and USB-IF testing, limiting substitute sources; 2024 certification costs typically range $5k–$50k per standard and USB-IF/Qi logo testing often $5k–$15k, creating vendor stickiness through retesting fees and lead times. Any supplier lapse can trigger recalls or de‑certification with multi‑million-dollar impact, while approved‑vendor lists further narrow choices and raise supplier power.

Logistics and commodity volatility
Freight rates, after 2021–22 peaks, fell roughly 60–70% by 2024 but remain volatile, directly affecting logistics COGS and supplier payment terms; lithium spot costs collapsed about 50–60% from 2022 highs into 2024, while LME copper and aluminium averaged near $9,000/ton and $2,200/ton in 2024, moving component costs. Upstream volatility enables pass-through pricing; forward contracts and hedging only partially buffer shocks, and regionalizing supply reduces exposure but adds complexity and higher operating costs.
- Freight rates: large swing 2021–24, high volatility
- Lithium: ≈50–60% decline from 2022 to 2024
- Copper/Aluminium: LME ~ $9,000/t and $2,200/t in 2024
- Hedging: partial buffer, residual exposure
- Regionalization: lowers risk, raises complexity/costs
Switching costs and tooling
Molds, test fixtures and firmware tuning embed sunk costs often ranging from $50k–$300k for injection molds, $5k–$50k for fixtures and $30k–$150k for firmware validation (2024 industry ranges), creating high switching costs for Anker. Requalification and reliability testing typically add 3–9 months and $20k–$100k in certification expenses. PCB respins for component alternates can cost $5k–$50k and further delay time-to-market, giving suppliers measurable negotiating leverage and driving potential BOM cost increases of 5–15%.
- Tooling sunk costs: $50k–$300k
- Fixtures: $5k–$50k
- Firmware validation: $30k–$150k
- Requal timeline: 3–9 months
- Certification: $20k–$100k
- PCB respin: $5k–$50k
- Estimated BOM impact: 5–15%
Supplier dominance — 60–70% share; 6–12m lead times; high switching costs
Supplier power is high: battery/GaN/chip capacity concentrated (top vendors ~60–70% share), creating leverage and longer lead times (qualification 6–12 months). Certification, tooling and respin costs ($5k–$300k) and tight EMS capacity raise switching costs. Commodity moves (Cu $9,000/t, Al $2,200/t, lithium down 50–60% from 2022) enable pass-through pricing.
| Metric | 2024 value |
|---|---|
| Top supplier share | 60–70% |
| Qualification lead time | 6–12 months |
| Certification cost | $5k–$50k |
| Tooling | $50k–$300k |
| Copper/Al | $9,000/t / $2,200/t |
What is included in the product
 Detailed Word Document
Tailored Porter’s Five Forces analysis of Anker Innovations Technology uncovering key competitive drivers, supplier and buyer power, substitution threats, and barriers to entry—highlighting strategic vulnerabilities and opportunities to defend market share and pricing power.

 Customizable Excel Spreadsheet
A concise one-sheet Porter's Five Forces for Anker Innovations that visualizes competitive pressure with an interactive spider chart and customizable force levels—ideal for quick decisions and slide-ready presentation.
Customers Bargaining Power

Platform-dominant channels
Platform-dominant channels concentrate demand and data—Amazon controls roughly 40% of US e-commerce, amplifying buyer power over brands like Anker. Algorithmic merchandising and marketplace fees (average take rates near 15%) squeeze gross margins and force promotional cadence. Strict platform policy compliance can trigger delisting or penalties that constrain pricing flexibility. Diversifying into DTC and traditional retail reduces platform dependence and data risk.
High price transparency
High price transparency — driven by reviews, comparison tools and flash deals — makes Anker product price/features instantly comparable; 2024 consumer surveys show ~76% use comparison tools before purchase, enabling easy brand switching and compressing premiums on commoditized SKUs. Low switching friction forces tighter ASPs on core chargers and cables. Value-added bundles and extended warranties have been used to defend ASPs and margins.

Low switching costs
Chargers, cables, earbuds and cameras have minimal lock-in, with the EU USB-C mandate effective 2024 and broad Bluetooth standards making fit and replacement easy, so price and promotions drive churn despite some brand loyalty. Differentiation therefore must come from proven reliability, standout design, and superior after-sales service to retain customers.

Retail and distributor bargaining
Large retailers demand slotting, co-op marketing (typically 2-4% of sell-through) and generous returns allowances, pressuring Anker's margins; volume commitments secure price concessions of roughly 3-8% in CE. Inventory turns and chargebacks, commonly 1-3% of revenue, materially reduce net margins. Regional distributors often extract territorial exclusivity for 1-3 percentage-point better gross margins.
- Slotting/co-op: 2-4%
- Price concessions: 3-8%
- Chargebacks: 1-3%
- Exclusivity lift: +1-3pp gross margin
Service expectations and returns
Fast replacements, ongoing firmware updates and robust warranties became baseline by 2024; BrightLocal reports ~84% of consumers trust online reviews, so service lapses rapidly lower conversion. High DOA/return rates give corporate buyers leverage to demand credits and volume concessions; proactive QA and transparent support lower that bargaining power.
- Baseline: fast RMA, firmware, warranty
- 84% trust reviews (BrightLocal 2024)
- High DOA → credit demands
- Proactive QA cuts buyer leverage
Buyers dominate: largest platform ~40% share, marketplace take ~15%, reviews drive churn
Buyers wield high power: platform concentration (Amazon ~40% US e‑commerce) and ~15% marketplace take rates compress margins. 76% use comparison tools (2024) and 84% trust reviews, raising price transparency and churn. Retailers' slotting/co‑op (2–4%) plus returns (1–3%) further pressure ASPs; DTC and service differentiation mitigate risk.
| Metric | 2024 Value |
|---|---|
| Amazon share | ~40% |
| Marketplace take | ~15% |
| Comparison tool use | 76% |
| Trust reviews | 84% |
| Co‑op/slotting | 2–4% |
| Returns/chargebacks | 1–3% |
Preview the Actual Deliverable
Anker Innovations Technology Porter's Five Forces Analysis
This preview displays the exact Anker Innovations Technology Porter’s Five Forces analysis you’ll receive—no samples or placeholders. The document is fully formatted, professional, and ready for immediate download upon purchase. What you see here is the final deliverable, complete and usable for decision-making or presentation purposes.

A Must-Have Tool for Decision-Makers
Anker Innovations faces intense buyer bargaining, strong substitute threats in consumer electronics, concentrated supplier leverage for key components, moderate new-entrant barriers, and fierce rivalry among branded and white-label players; this snapshot highlights strategic pressure points. Unlock the full Porter's Five Forces Analysis to explore detailed force ratings, visuals, and actionable recommendations.
Suppliers Bargaining Power
Concentrated critical components
High-spec batteries, GaN power ICs and advanced chipsets are sourced from a concentrated supplier base—top global cell producers and leading GaN vendors dominate capacity—giving suppliers strong leverage. Supply shocks or node constraints drive longer lead times and higher prices; qualification cycles often take 6–12 months, slowing substitution. Dual-sourcing and design-for-substitution mitigate risk, while multi-year contracts stabilize availability and cost.
Dependence on EMS/ODM partners
Manufacturing flexibility for Anker depends on a small set of capable EMS/ODM partners that drive quality and yield, with 2024 industry reports indicating top EMS often allocate roughly 60–70% of capacity to their largest customers, squeezing smaller runs. Capacity prioritization thus raises pricing and lead-time pressure on Anker for niche SKUs. Tight process IP and compressed NPI timelines increase switching frictions and cost. Co-location and joint planning with EMS partners materially reduce disruption risk.
Compliance and certification gatekeeping
Suppliers for Anker must clear UL, CE, FCC, Qi2 and USB-IF testing, limiting substitute sources; 2024 certification costs typically range $5k–$50k per standard and USB-IF/Qi logo testing often $5k–$15k, creating vendor stickiness through retesting fees and lead times. Any supplier lapse can trigger recalls or de‑certification with multi‑million-dollar impact, while approved‑vendor lists further narrow choices and raise supplier power.
Logistics and commodity volatility
Freight rates, after 2021–22 peaks, fell roughly 60–70% by 2024 but remain volatile, directly affecting logistics COGS and supplier payment terms; lithium spot costs collapsed about 50–60% from 2022 highs into 2024, while LME copper and aluminium averaged near $9,000/ton and $2,200/ton in 2024, moving component costs. Upstream volatility enables pass-through pricing; forward contracts and hedging only partially buffer shocks, and regionalizing supply reduces exposure but adds complexity and higher operating costs.
- Freight rates: large swing 2021–24, high volatility
- Lithium: ≈50–60% decline from 2022 to 2024
- Copper/Aluminium: LME ~ $9,000/t and $2,200/t in 2024
- Hedging: partial buffer, residual exposure
- Regionalization: lowers risk, raises complexity/costs
Switching costs and tooling
Molds, test fixtures and firmware tuning embed sunk costs often ranging from $50k–$300k for injection molds, $5k–$50k for fixtures and $30k–$150k for firmware validation (2024 industry ranges), creating high switching costs for Anker. Requalification and reliability testing typically add 3–9 months and $20k–$100k in certification expenses. PCB respins for component alternates can cost $5k–$50k and further delay time-to-market, giving suppliers measurable negotiating leverage and driving potential BOM cost increases of 5–15%.
- Tooling sunk costs: $50k–$300k
- Fixtures: $5k–$50k
- Firmware validation: $30k–$150k
- Requal timeline: 3–9 months
- Certification: $20k–$100k
- PCB respin: $5k–$50k
- Estimated BOM impact: 5–15%
Supplier dominance — 60–70% share; 6–12m lead times; high switching costs
Supplier power is high: battery/GaN/chip capacity concentrated (top vendors ~60–70% share), creating leverage and longer lead times (qualification 6–12 months). Certification, tooling and respin costs ($5k–$300k) and tight EMS capacity raise switching costs. Commodity moves (Cu $9,000/t, Al $2,200/t, lithium down 50–60% from 2022) enable pass-through pricing.
| Metric | 2024 value |
|---|---|
| Top supplier share | 60–70% |
| Qualification lead time | 6–12 months |
| Certification cost | $5k–$50k |
| Tooling | $50k–$300k |
| Copper/Al | $9,000/t / $2,200/t |
What is included in the product
Detailed Word Document
Tailored Porter’s Five Forces analysis of Anker Innovations Technology uncovering key competitive drivers, supplier and buyer power, substitution threats, and barriers to entry—highlighting strategic vulnerabilities and opportunities to defend market share and pricing power.
Customizable Excel Spreadsheet
A concise one-sheet Porter's Five Forces for Anker Innovations that visualizes competitive pressure with an interactive spider chart and customizable force levels—ideal for quick decisions and slide-ready presentation.
Customers Bargaining Power
Platform-dominant channels
Platform-dominant channels concentrate demand and data—Amazon controls roughly 40% of US e-commerce, amplifying buyer power over brands like Anker. Algorithmic merchandising and marketplace fees (average take rates near 15%) squeeze gross margins and force promotional cadence. Strict platform policy compliance can trigger delisting or penalties that constrain pricing flexibility. Diversifying into DTC and traditional retail reduces platform dependence and data risk.
High price transparency
High price transparency — driven by reviews, comparison tools and flash deals — makes Anker product price/features instantly comparable; 2024 consumer surveys show ~76% use comparison tools before purchase, enabling easy brand switching and compressing premiums on commoditized SKUs. Low switching friction forces tighter ASPs on core chargers and cables. Value-added bundles and extended warranties have been used to defend ASPs and margins.
Low switching costs
Chargers, cables, earbuds and cameras have minimal lock-in, with the EU USB-C mandate effective 2024 and broad Bluetooth standards making fit and replacement easy, so price and promotions drive churn despite some brand loyalty. Differentiation therefore must come from proven reliability, standout design, and superior after-sales service to retain customers.
Retail and distributor bargaining
Large retailers demand slotting, co-op marketing (typically 2-4% of sell-through) and generous returns allowances, pressuring Anker's margins; volume commitments secure price concessions of roughly 3-8% in CE. Inventory turns and chargebacks, commonly 1-3% of revenue, materially reduce net margins. Regional distributors often extract territorial exclusivity for 1-3 percentage-point better gross margins.
- Slotting/co-op: 2-4%
- Price concessions: 3-8%
- Chargebacks: 1-3%
- Exclusivity lift: +1-3pp gross margin
Service expectations and returns
Fast replacements, ongoing firmware updates and robust warranties became baseline by 2024; BrightLocal reports ~84% of consumers trust online reviews, so service lapses rapidly lower conversion. High DOA/return rates give corporate buyers leverage to demand credits and volume concessions; proactive QA and transparent support lower that bargaining power.
- Baseline: fast RMA, firmware, warranty
- 84% trust reviews (BrightLocal 2024)
- High DOA → credit demands
- Proactive QA cuts buyer leverage
Buyers dominate: largest platform ~40% share, marketplace take ~15%, reviews drive churn
Buyers wield high power: platform concentration (Amazon ~40% US e‑commerce) and ~15% marketplace take rates compress margins. 76% use comparison tools (2024) and 84% trust reviews, raising price transparency and churn. Retailers' slotting/co‑op (2–4%) plus returns (1–3%) further pressure ASPs; DTC and service differentiation mitigate risk.
| Metric | 2024 Value |
|---|---|
| Amazon share | ~40% |
| Marketplace take | ~15% |
| Comparison tool use | 76% |
| Trust reviews | 84% |
| Co‑op/slotting | 2–4% |
| Returns/chargebacks | 1–3% |
Preview the Actual Deliverable
Anker Innovations Technology Porter's Five Forces Analysis
This preview displays the exact Anker Innovations Technology Porter’s Five Forces analysis you’ll receive—no samples or placeholders. The document is fully formatted, professional, and ready for immediate download upon purchase. What you see here is the final deliverable, complete and usable for decision-making or presentation purposes.
Original: $10.00
-65%$10.00
$3.50Description
A Must-Have Tool for Decision-Makers
Anker Innovations faces intense buyer bargaining, strong substitute threats in consumer electronics, concentrated supplier leverage for key components, moderate new-entrant barriers, and fierce rivalry among branded and white-label players; this snapshot highlights strategic pressure points. Unlock the full Porter's Five Forces Analysis to explore detailed force ratings, visuals, and actionable recommendations.
Suppliers Bargaining Power
Concentrated critical components
High-spec batteries, GaN power ICs and advanced chipsets are sourced from a concentrated supplier base—top global cell producers and leading GaN vendors dominate capacity—giving suppliers strong leverage. Supply shocks or node constraints drive longer lead times and higher prices; qualification cycles often take 6–12 months, slowing substitution. Dual-sourcing and design-for-substitution mitigate risk, while multi-year contracts stabilize availability and cost.
Dependence on EMS/ODM partners
Manufacturing flexibility for Anker depends on a small set of capable EMS/ODM partners that drive quality and yield, with 2024 industry reports indicating top EMS often allocate roughly 60–70% of capacity to their largest customers, squeezing smaller runs. Capacity prioritization thus raises pricing and lead-time pressure on Anker for niche SKUs. Tight process IP and compressed NPI timelines increase switching frictions and cost. Co-location and joint planning with EMS partners materially reduce disruption risk.
Compliance and certification gatekeeping
Suppliers for Anker must clear UL, CE, FCC, Qi2 and USB-IF testing, limiting substitute sources; 2024 certification costs typically range $5k–$50k per standard and USB-IF/Qi logo testing often $5k–$15k, creating vendor stickiness through retesting fees and lead times. Any supplier lapse can trigger recalls or de‑certification with multi‑million-dollar impact, while approved‑vendor lists further narrow choices and raise supplier power.
Logistics and commodity volatility
Freight rates, after 2021–22 peaks, fell roughly 60–70% by 2024 but remain volatile, directly affecting logistics COGS and supplier payment terms; lithium spot costs collapsed about 50–60% from 2022 highs into 2024, while LME copper and aluminium averaged near $9,000/ton and $2,200/ton in 2024, moving component costs. Upstream volatility enables pass-through pricing; forward contracts and hedging only partially buffer shocks, and regionalizing supply reduces exposure but adds complexity and higher operating costs.
- Freight rates: large swing 2021–24, high volatility
- Lithium: ≈50–60% decline from 2022 to 2024
- Copper/Aluminium: LME ~ $9,000/t and $2,200/t in 2024
- Hedging: partial buffer, residual exposure
- Regionalization: lowers risk, raises complexity/costs
Switching costs and tooling
Molds, test fixtures and firmware tuning embed sunk costs often ranging from $50k–$300k for injection molds, $5k–$50k for fixtures and $30k–$150k for firmware validation (2024 industry ranges), creating high switching costs for Anker. Requalification and reliability testing typically add 3–9 months and $20k–$100k in certification expenses. PCB respins for component alternates can cost $5k–$50k and further delay time-to-market, giving suppliers measurable negotiating leverage and driving potential BOM cost increases of 5–15%.
- Tooling sunk costs: $50k–$300k
- Fixtures: $5k–$50k
- Firmware validation: $30k–$150k
- Requal timeline: 3–9 months
- Certification: $20k–$100k
- PCB respin: $5k–$50k
- Estimated BOM impact: 5–15%
Supplier dominance — 60–70% share; 6–12m lead times; high switching costs
Supplier power is high: battery/GaN/chip capacity concentrated (top vendors ~60–70% share), creating leverage and longer lead times (qualification 6–12 months). Certification, tooling and respin costs ($5k–$300k) and tight EMS capacity raise switching costs. Commodity moves (Cu $9,000/t, Al $2,200/t, lithium down 50–60% from 2022) enable pass-through pricing.
| Metric | 2024 value |
|---|---|
| Top supplier share | 60–70% |
| Qualification lead time | 6–12 months |
| Certification cost | $5k–$50k |
| Tooling | $50k–$300k |
| Copper/Al | $9,000/t / $2,200/t |
What is included in the product
Detailed Word Document
Tailored Porter’s Five Forces analysis of Anker Innovations Technology uncovering key competitive drivers, supplier and buyer power, substitution threats, and barriers to entry—highlighting strategic vulnerabilities and opportunities to defend market share and pricing power.
Customizable Excel Spreadsheet
A concise one-sheet Porter's Five Forces for Anker Innovations that visualizes competitive pressure with an interactive spider chart and customizable force levels—ideal for quick decisions and slide-ready presentation.
Customers Bargaining Power
Platform-dominant channels
Platform-dominant channels concentrate demand and data—Amazon controls roughly 40% of US e-commerce, amplifying buyer power over brands like Anker. Algorithmic merchandising and marketplace fees (average take rates near 15%) squeeze gross margins and force promotional cadence. Strict platform policy compliance can trigger delisting or penalties that constrain pricing flexibility. Diversifying into DTC and traditional retail reduces platform dependence and data risk.
High price transparency
High price transparency — driven by reviews, comparison tools and flash deals — makes Anker product price/features instantly comparable; 2024 consumer surveys show ~76% use comparison tools before purchase, enabling easy brand switching and compressing premiums on commoditized SKUs. Low switching friction forces tighter ASPs on core chargers and cables. Value-added bundles and extended warranties have been used to defend ASPs and margins.
Low switching costs
Chargers, cables, earbuds and cameras have minimal lock-in, with the EU USB-C mandate effective 2024 and broad Bluetooth standards making fit and replacement easy, so price and promotions drive churn despite some brand loyalty. Differentiation therefore must come from proven reliability, standout design, and superior after-sales service to retain customers.
Retail and distributor bargaining
Large retailers demand slotting, co-op marketing (typically 2-4% of sell-through) and generous returns allowances, pressuring Anker's margins; volume commitments secure price concessions of roughly 3-8% in CE. Inventory turns and chargebacks, commonly 1-3% of revenue, materially reduce net margins. Regional distributors often extract territorial exclusivity for 1-3 percentage-point better gross margins.
- Slotting/co-op: 2-4%
- Price concessions: 3-8%
- Chargebacks: 1-3%
- Exclusivity lift: +1-3pp gross margin
Service expectations and returns
Fast replacements, ongoing firmware updates and robust warranties became baseline by 2024; BrightLocal reports ~84% of consumers trust online reviews, so service lapses rapidly lower conversion. High DOA/return rates give corporate buyers leverage to demand credits and volume concessions; proactive QA and transparent support lower that bargaining power.
- Baseline: fast RMA, firmware, warranty
- 84% trust reviews (BrightLocal 2024)
- High DOA → credit demands
- Proactive QA cuts buyer leverage
Buyers dominate: largest platform ~40% share, marketplace take ~15%, reviews drive churn
Buyers wield high power: platform concentration (Amazon ~40% US e‑commerce) and ~15% marketplace take rates compress margins. 76% use comparison tools (2024) and 84% trust reviews, raising price transparency and churn. Retailers' slotting/co‑op (2–4%) plus returns (1–3%) further pressure ASPs; DTC and service differentiation mitigate risk.
| Metric | 2024 Value |
|---|---|
| Amazon share | ~40% |
| Marketplace take | ~15% |
| Comparison tool use | 76% |
| Trust reviews | 84% |
| Co‑op/slotting | 2–4% |
| Returns/chargebacks | 1–3% |
Preview the Actual Deliverable
Anker Innovations Technology Porter's Five Forces Analysis
This preview displays the exact Anker Innovations Technology Porter’s Five Forces analysis you’ll receive—no samples or placeholders. The document is fully formatted, professional, and ready for immediate download upon purchase. What you see here is the final deliverable, complete and usable for decision-making or presentation purposes.











