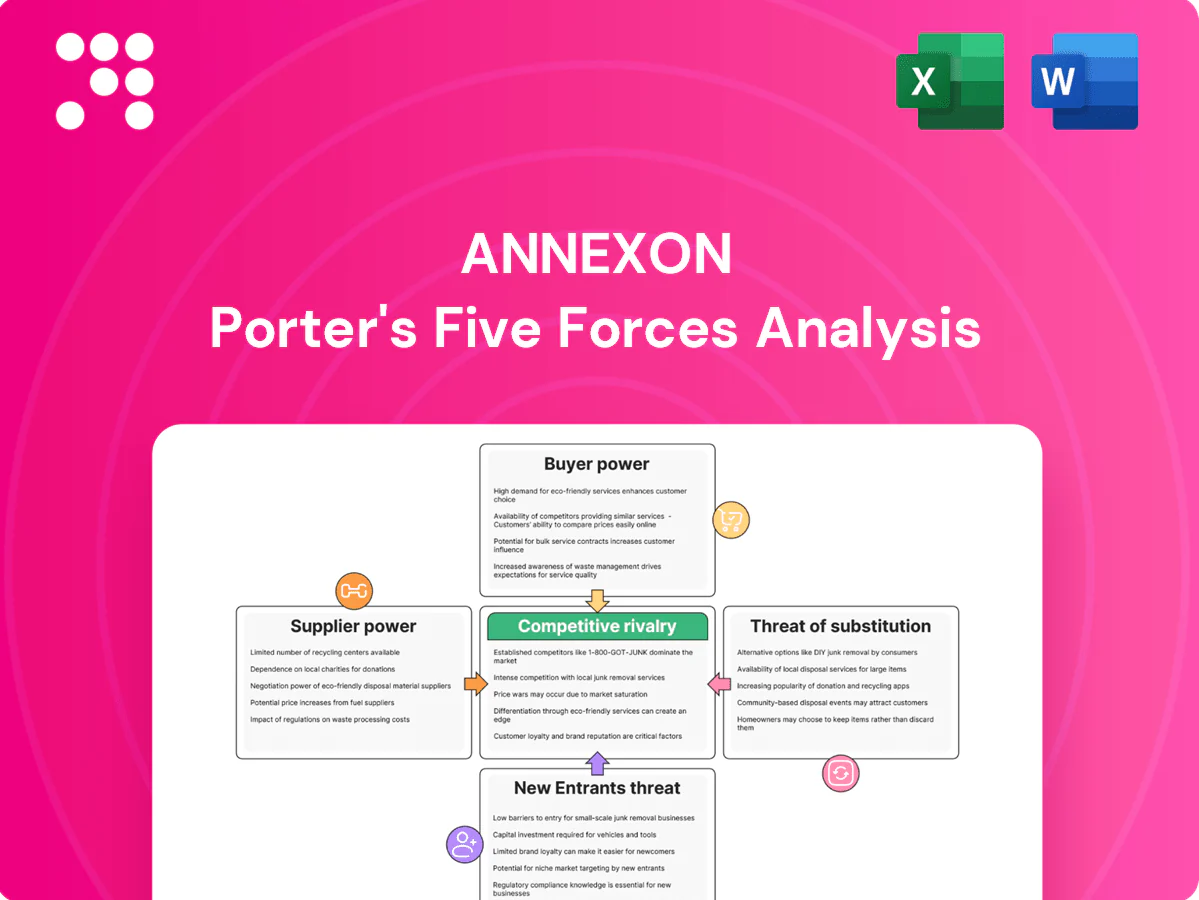
Annexon Porter's Five Forces Analysis

Don't Miss the Bigger Picture
Annexon Porter's Five Forces snapshot highlights competitive rivalry, supplier and buyer power, threat of entrants and substitutes, and regulatory pressures shaping its market position. This brief overview only scratches the surface. Unlock the full Porter's Five Forces Analysis to explore Annexon’s competitive dynamics, market pressures, and strategic advantages in detail.
Suppliers Bargaining Power

Specialized biologics CDMOs
Manufacturing anti-C1q biologics needs high-spec CDMOs with limited global capacity, driving high switching costs and multi-month lead times; industry reports showed biologics CDMO capacity utilization above 80% in 2024. Process transfer and validation further amplify dependency and add months of cost and risk. Capacity crunches have shifted pricing power to suppliers, with contract premiums rising into the mid-teens in 2023–24, while long-term contracts and dual-sourcing partially mitigate supply risk.
Critical raw materials and assays
Upstream inputs like GMP-grade media, specialty resins and C1q/C1 pathway assay kits are highly niche and concentrated among roughly 3–5 specialized suppliers, giving suppliers considerable leverage. Supply disruptions or quality issues can pause development, with qualification of alternates typically requiring 6–12 months and often costing low six figures. At clinical-stage scale volume discounts are minimal, generally under 10% versus commercial volumes, preserving supplier pricing power.

Clinical trial services and sites
CROs, specialized neuro-immunology sites and imaging/biomarker labs exercised notable leverage in 2024 as the global CRO market reached roughly $59 billion, concentrating expertise scarce for Annexon programs; competition for high-performing sites pushed site-startup timelines and budgets materially higher, with industry reports citing average startup delays around several months in 2024. Performance variability raised rework and data-cleanup risk, while preferred-provider frameworks improved predictability but did not eliminate supplier power.

Key talent and know-how
Experienced CMC biology and biologics talent is scarce, pushing compensation and retention costs higher; industry hiring data showed biotech turnover around 18% in 2023–24, tightening labor supply and raising replacement costs. Tacit process know-how concentrates bargaining power with few experts, and turnover risks program timelines and product quality. Equity incentives (typical senior CMC grants ~0.2–1.0% in 2024) partially offset this supplier-like power.
- Scarcity: high demand, limited supply
- Compensation: rising retention costs
- Concentration: tacit knowledge = bargaining leverage
- Risk: ~18% turnover 2023–24 impacts timelines/quality
- Mitigation: equity grants ~0.2–1.0% (2024)
Device/drug delivery partners
High supplier power: CDMO utilization >80%, mid-teens premiums, slow CRO timelines
Supplier power is high: biologics CDMO capacity >80% (2024) and contract premiums mid-teens (2023–24) raise switching costs and lead times; alternate qualification 6–12 months and low-six-figure costs. Niche inputs from ~3–5 suppliers, CRO market ~$59B (2024) with site delays of several months, and 18% biotech turnover (2023–24) concentrate leverage; long-term contracts, dual-sourcing and equity (0.2–1.0% senior CMC, 2024) partially mitigate.
| Metric | Value |
|---|---|
| CDMO utilization | >80% (2024) |
| Contract premiums | Mid-teens (2023–24) |
| CRO market | $59B (2024) |
What is included in the product
 Detailed Word Document
Uncovers key competitive drivers, supplier and buyer power, barriers to entry, substitutes, and rivalry specific to Annexon, highlighting disruptive threats and strategic levers to protect market share; fully editable for investor decks, business plans, and internal strategy work.

 Customizable Excel Spreadsheet
Clear one-sheet Annexon Five Forces summary to quickly spot competitive pain points and relieve strategic uncertainty with customizable pressure levels and a ready-to-copy radar chart for decks.
Customers Bargaining Power

Payers and HTA bodies
Reimbursement decision-makers wield strong power in rare and neurodegenerative diseases, with HTA bodies demanding clear comparative effectiveness and durable outcomes to justify premium pricing. NICE typically applies £20,000–30,000 per QALY (with HST pathways allowing much higher thresholds up to ~£100,000/QALY) as benchmarks. Budget impact and value-based contracts increasingly dictate net price and access. Real-world evidence will be pivotal post-launch to sustain reimbursement and outcomes-based payments.
Specialist prescribers
Specialist prescribers—neurologists, ophthalmologists and immunologists—wield strong bargaining power as protocol choices drive adoption; there are roughly 19,000 practicing neurologists in the US and specialists often set clinic-level formularies. Guideline inclusion and KOL advocacy materially accelerate uptake, while exclusion can stall launches. Training and ease-of-use for complex biologics raise switching costs, and safety/monitoring burdens further constrain prescribing decisions; biologics comprised about 30% of global pharma sales in 2024.

Providers and specialty pharmacies
Providers and specialty pharmacies control logistics and negotiate admin/acquisition fees, with buy-and-bill margins commonly 6–20% by therapy and payer. Specialty drugs were ~55% of US drug spend in 2024 (IQVIA), amplifying buyer influence. Prior authorization often delays starts—median turnaround ~5 days, denials >20% in some areas. Strong manufacturer hub and patient-support services can blunt their leverage.

Patient advocacy and rare disease communities
Engaged rare disease communities (about 300 million people globally) can amplify demand but also pressure for access and affordability, affecting pricing power. Trial design and endpoint relevance face intense scrutiny from advocacy groups, while expectations for compassionate use and co-pay support can erode economics. Transparent communication and stakeholder alignment can mitigate conflict and preserve uptake.
- Demand amplification vs price pressure
- Trial/endpoints under advocacy scrutiny
- Compassionate use and co-pay expectations
- Transparent communication aligns interests
Global government purchasers
- Single-payer/tenders: concentrated demand
- External reference pricing: 100+ countries (2024)
- Managed entry agreements: 20+ countries (2024)
- Discounts/tenders: up to 70% in select procurements
Payers demand durability; biologics (30%) face access and pricing pressure
Reimbursement bodies exert strong leverage, demanding clear comparative effectiveness and real-world durability to justify premium pricing. Specialist prescribers and KOLs drive adoption; biologics ≈30% of global pharma sales (2024). Providers/specialty pharmacies control logistics and ~55% of US drug spend, while rare disease communities (~300M) amplify access pressure.
| Buyer | Metric | 2024 data |
|---|---|---|
| HTA/Payers | QALY thresholds | £20–30k; HST up to ~£100k |
| Providers | Drug spend share | 55% US |
| Advocacy | Population | ~300M |
What You See Is What You Get
Annexon Porter's Five Forces Analysis
This preview shows the exact Annexon Porter’s Five Forces Analysis you’ll receive—no placeholders or samples. The full, professionally formatted document is ready for immediate download and use the moment you purchase. What you see here is precisely the deliverable you’ll get, complete and final.

Don't Miss the Bigger Picture
Annexon Porter's Five Forces snapshot highlights competitive rivalry, supplier and buyer power, threat of entrants and substitutes, and regulatory pressures shaping its market position. This brief overview only scratches the surface. Unlock the full Porter's Five Forces Analysis to explore Annexon’s competitive dynamics, market pressures, and strategic advantages in detail.
Suppliers Bargaining Power
Specialized biologics CDMOs
Manufacturing anti-C1q biologics needs high-spec CDMOs with limited global capacity, driving high switching costs and multi-month lead times; industry reports showed biologics CDMO capacity utilization above 80% in 2024. Process transfer and validation further amplify dependency and add months of cost and risk. Capacity crunches have shifted pricing power to suppliers, with contract premiums rising into the mid-teens in 2023–24, while long-term contracts and dual-sourcing partially mitigate supply risk.
Critical raw materials and assays
Upstream inputs like GMP-grade media, specialty resins and C1q/C1 pathway assay kits are highly niche and concentrated among roughly 3–5 specialized suppliers, giving suppliers considerable leverage. Supply disruptions or quality issues can pause development, with qualification of alternates typically requiring 6–12 months and often costing low six figures. At clinical-stage scale volume discounts are minimal, generally under 10% versus commercial volumes, preserving supplier pricing power.
Clinical trial services and sites
CROs, specialized neuro-immunology sites and imaging/biomarker labs exercised notable leverage in 2024 as the global CRO market reached roughly $59 billion, concentrating expertise scarce for Annexon programs; competition for high-performing sites pushed site-startup timelines and budgets materially higher, with industry reports citing average startup delays around several months in 2024. Performance variability raised rework and data-cleanup risk, while preferred-provider frameworks improved predictability but did not eliminate supplier power.
Key talent and know-how
Experienced CMC biology and biologics talent is scarce, pushing compensation and retention costs higher; industry hiring data showed biotech turnover around 18% in 2023–24, tightening labor supply and raising replacement costs. Tacit process know-how concentrates bargaining power with few experts, and turnover risks program timelines and product quality. Equity incentives (typical senior CMC grants ~0.2–1.0% in 2024) partially offset this supplier-like power.
- Scarcity: high demand, limited supply
- Compensation: rising retention costs
- Concentration: tacit knowledge = bargaining leverage
- Risk: ~18% turnover 2023–24 impacts timelines/quality
- Mitigation: equity grants ~0.2–1.0% (2024)
Device/drug delivery partners
High supplier power: CDMO utilization >80%, mid-teens premiums, slow CRO timelines
Supplier power is high: biologics CDMO capacity >80% (2024) and contract premiums mid-teens (2023–24) raise switching costs and lead times; alternate qualification 6–12 months and low-six-figure costs. Niche inputs from ~3–5 suppliers, CRO market ~$59B (2024) with site delays of several months, and 18% biotech turnover (2023–24) concentrate leverage; long-term contracts, dual-sourcing and equity (0.2–1.0% senior CMC, 2024) partially mitigate.
| Metric | Value |
|---|---|
| CDMO utilization | >80% (2024) |
| Contract premiums | Mid-teens (2023–24) |
| CRO market | $59B (2024) |
What is included in the product
Detailed Word Document
Uncovers key competitive drivers, supplier and buyer power, barriers to entry, substitutes, and rivalry specific to Annexon, highlighting disruptive threats and strategic levers to protect market share; fully editable for investor decks, business plans, and internal strategy work.
Customizable Excel Spreadsheet
Clear one-sheet Annexon Five Forces summary to quickly spot competitive pain points and relieve strategic uncertainty with customizable pressure levels and a ready-to-copy radar chart for decks.
Customers Bargaining Power
Payers and HTA bodies
Reimbursement decision-makers wield strong power in rare and neurodegenerative diseases, with HTA bodies demanding clear comparative effectiveness and durable outcomes to justify premium pricing. NICE typically applies £20,000–30,000 per QALY (with HST pathways allowing much higher thresholds up to ~£100,000/QALY) as benchmarks. Budget impact and value-based contracts increasingly dictate net price and access. Real-world evidence will be pivotal post-launch to sustain reimbursement and outcomes-based payments.
Specialist prescribers
Specialist prescribers—neurologists, ophthalmologists and immunologists—wield strong bargaining power as protocol choices drive adoption; there are roughly 19,000 practicing neurologists in the US and specialists often set clinic-level formularies. Guideline inclusion and KOL advocacy materially accelerate uptake, while exclusion can stall launches. Training and ease-of-use for complex biologics raise switching costs, and safety/monitoring burdens further constrain prescribing decisions; biologics comprised about 30% of global pharma sales in 2024.
Providers and specialty pharmacies
Providers and specialty pharmacies control logistics and negotiate admin/acquisition fees, with buy-and-bill margins commonly 6–20% by therapy and payer. Specialty drugs were ~55% of US drug spend in 2024 (IQVIA), amplifying buyer influence. Prior authorization often delays starts—median turnaround ~5 days, denials >20% in some areas. Strong manufacturer hub and patient-support services can blunt their leverage.
Patient advocacy and rare disease communities
Engaged rare disease communities (about 300 million people globally) can amplify demand but also pressure for access and affordability, affecting pricing power. Trial design and endpoint relevance face intense scrutiny from advocacy groups, while expectations for compassionate use and co-pay support can erode economics. Transparent communication and stakeholder alignment can mitigate conflict and preserve uptake.
- Demand amplification vs price pressure
- Trial/endpoints under advocacy scrutiny
- Compassionate use and co-pay expectations
- Transparent communication aligns interests
Global government purchasers
- Single-payer/tenders: concentrated demand
- External reference pricing: 100+ countries (2024)
- Managed entry agreements: 20+ countries (2024)
- Discounts/tenders: up to 70% in select procurements
Payers demand durability; biologics (30%) face access and pricing pressure
Reimbursement bodies exert strong leverage, demanding clear comparative effectiveness and real-world durability to justify premium pricing. Specialist prescribers and KOLs drive adoption; biologics ≈30% of global pharma sales (2024). Providers/specialty pharmacies control logistics and ~55% of US drug spend, while rare disease communities (~300M) amplify access pressure.
| Buyer | Metric | 2024 data |
|---|---|---|
| HTA/Payers | QALY thresholds | £20–30k; HST up to ~£100k |
| Providers | Drug spend share | 55% US |
| Advocacy | Population | ~300M |
What You See Is What You Get
Annexon Porter's Five Forces Analysis
This preview shows the exact Annexon Porter’s Five Forces Analysis you’ll receive—no placeholders or samples. The full, professionally formatted document is ready for immediate download and use the moment you purchase. What you see here is precisely the deliverable you’ll get, complete and final.
Original: $10.00
-65%$10.00
$3.50Description
Don't Miss the Bigger Picture
Annexon Porter's Five Forces snapshot highlights competitive rivalry, supplier and buyer power, threat of entrants and substitutes, and regulatory pressures shaping its market position. This brief overview only scratches the surface. Unlock the full Porter's Five Forces Analysis to explore Annexon’s competitive dynamics, market pressures, and strategic advantages in detail.
Suppliers Bargaining Power
Specialized biologics CDMOs
Manufacturing anti-C1q biologics needs high-spec CDMOs with limited global capacity, driving high switching costs and multi-month lead times; industry reports showed biologics CDMO capacity utilization above 80% in 2024. Process transfer and validation further amplify dependency and add months of cost and risk. Capacity crunches have shifted pricing power to suppliers, with contract premiums rising into the mid-teens in 2023–24, while long-term contracts and dual-sourcing partially mitigate supply risk.
Critical raw materials and assays
Upstream inputs like GMP-grade media, specialty resins and C1q/C1 pathway assay kits are highly niche and concentrated among roughly 3–5 specialized suppliers, giving suppliers considerable leverage. Supply disruptions or quality issues can pause development, with qualification of alternates typically requiring 6–12 months and often costing low six figures. At clinical-stage scale volume discounts are minimal, generally under 10% versus commercial volumes, preserving supplier pricing power.
Clinical trial services and sites
CROs, specialized neuro-immunology sites and imaging/biomarker labs exercised notable leverage in 2024 as the global CRO market reached roughly $59 billion, concentrating expertise scarce for Annexon programs; competition for high-performing sites pushed site-startup timelines and budgets materially higher, with industry reports citing average startup delays around several months in 2024. Performance variability raised rework and data-cleanup risk, while preferred-provider frameworks improved predictability but did not eliminate supplier power.
Key talent and know-how
Experienced CMC biology and biologics talent is scarce, pushing compensation and retention costs higher; industry hiring data showed biotech turnover around 18% in 2023–24, tightening labor supply and raising replacement costs. Tacit process know-how concentrates bargaining power with few experts, and turnover risks program timelines and product quality. Equity incentives (typical senior CMC grants ~0.2–1.0% in 2024) partially offset this supplier-like power.
- Scarcity: high demand, limited supply
- Compensation: rising retention costs
- Concentration: tacit knowledge = bargaining leverage
- Risk: ~18% turnover 2023–24 impacts timelines/quality
- Mitigation: equity grants ~0.2–1.0% (2024)
Device/drug delivery partners
High supplier power: CDMO utilization >80%, mid-teens premiums, slow CRO timelines
Supplier power is high: biologics CDMO capacity >80% (2024) and contract premiums mid-teens (2023–24) raise switching costs and lead times; alternate qualification 6–12 months and low-six-figure costs. Niche inputs from ~3–5 suppliers, CRO market ~$59B (2024) with site delays of several months, and 18% biotech turnover (2023–24) concentrate leverage; long-term contracts, dual-sourcing and equity (0.2–1.0% senior CMC, 2024) partially mitigate.
| Metric | Value |
|---|---|
| CDMO utilization | >80% (2024) |
| Contract premiums | Mid-teens (2023–24) |
| CRO market | $59B (2024) |
What is included in the product
Detailed Word Document
Uncovers key competitive drivers, supplier and buyer power, barriers to entry, substitutes, and rivalry specific to Annexon, highlighting disruptive threats and strategic levers to protect market share; fully editable for investor decks, business plans, and internal strategy work.
Customizable Excel Spreadsheet
Clear one-sheet Annexon Five Forces summary to quickly spot competitive pain points and relieve strategic uncertainty with customizable pressure levels and a ready-to-copy radar chart for decks.
Customers Bargaining Power
Payers and HTA bodies
Reimbursement decision-makers wield strong power in rare and neurodegenerative diseases, with HTA bodies demanding clear comparative effectiveness and durable outcomes to justify premium pricing. NICE typically applies £20,000–30,000 per QALY (with HST pathways allowing much higher thresholds up to ~£100,000/QALY) as benchmarks. Budget impact and value-based contracts increasingly dictate net price and access. Real-world evidence will be pivotal post-launch to sustain reimbursement and outcomes-based payments.
Specialist prescribers
Specialist prescribers—neurologists, ophthalmologists and immunologists—wield strong bargaining power as protocol choices drive adoption; there are roughly 19,000 practicing neurologists in the US and specialists often set clinic-level formularies. Guideline inclusion and KOL advocacy materially accelerate uptake, while exclusion can stall launches. Training and ease-of-use for complex biologics raise switching costs, and safety/monitoring burdens further constrain prescribing decisions; biologics comprised about 30% of global pharma sales in 2024.
Providers and specialty pharmacies
Providers and specialty pharmacies control logistics and negotiate admin/acquisition fees, with buy-and-bill margins commonly 6–20% by therapy and payer. Specialty drugs were ~55% of US drug spend in 2024 (IQVIA), amplifying buyer influence. Prior authorization often delays starts—median turnaround ~5 days, denials >20% in some areas. Strong manufacturer hub and patient-support services can blunt their leverage.
Patient advocacy and rare disease communities
Engaged rare disease communities (about 300 million people globally) can amplify demand but also pressure for access and affordability, affecting pricing power. Trial design and endpoint relevance face intense scrutiny from advocacy groups, while expectations for compassionate use and co-pay support can erode economics. Transparent communication and stakeholder alignment can mitigate conflict and preserve uptake.
- Demand amplification vs price pressure
- Trial/endpoints under advocacy scrutiny
- Compassionate use and co-pay expectations
- Transparent communication aligns interests
Global government purchasers
- Single-payer/tenders: concentrated demand
- External reference pricing: 100+ countries (2024)
- Managed entry agreements: 20+ countries (2024)
- Discounts/tenders: up to 70% in select procurements
Payers demand durability; biologics (30%) face access and pricing pressure
Reimbursement bodies exert strong leverage, demanding clear comparative effectiveness and real-world durability to justify premium pricing. Specialist prescribers and KOLs drive adoption; biologics ≈30% of global pharma sales (2024). Providers/specialty pharmacies control logistics and ~55% of US drug spend, while rare disease communities (~300M) amplify access pressure.
| Buyer | Metric | 2024 data |
|---|---|---|
| HTA/Payers | QALY thresholds | £20–30k; HST up to ~£100k |
| Providers | Drug spend share | 55% US |
| Advocacy | Population | ~300M |
What You See Is What You Get
Annexon Porter's Five Forces Analysis
This preview shows the exact Annexon Porter’s Five Forces Analysis you’ll receive—no placeholders or samples. The full, professionally formatted document is ready for immediate download and use the moment you purchase. What you see here is precisely the deliverable you’ll get, complete and final.











