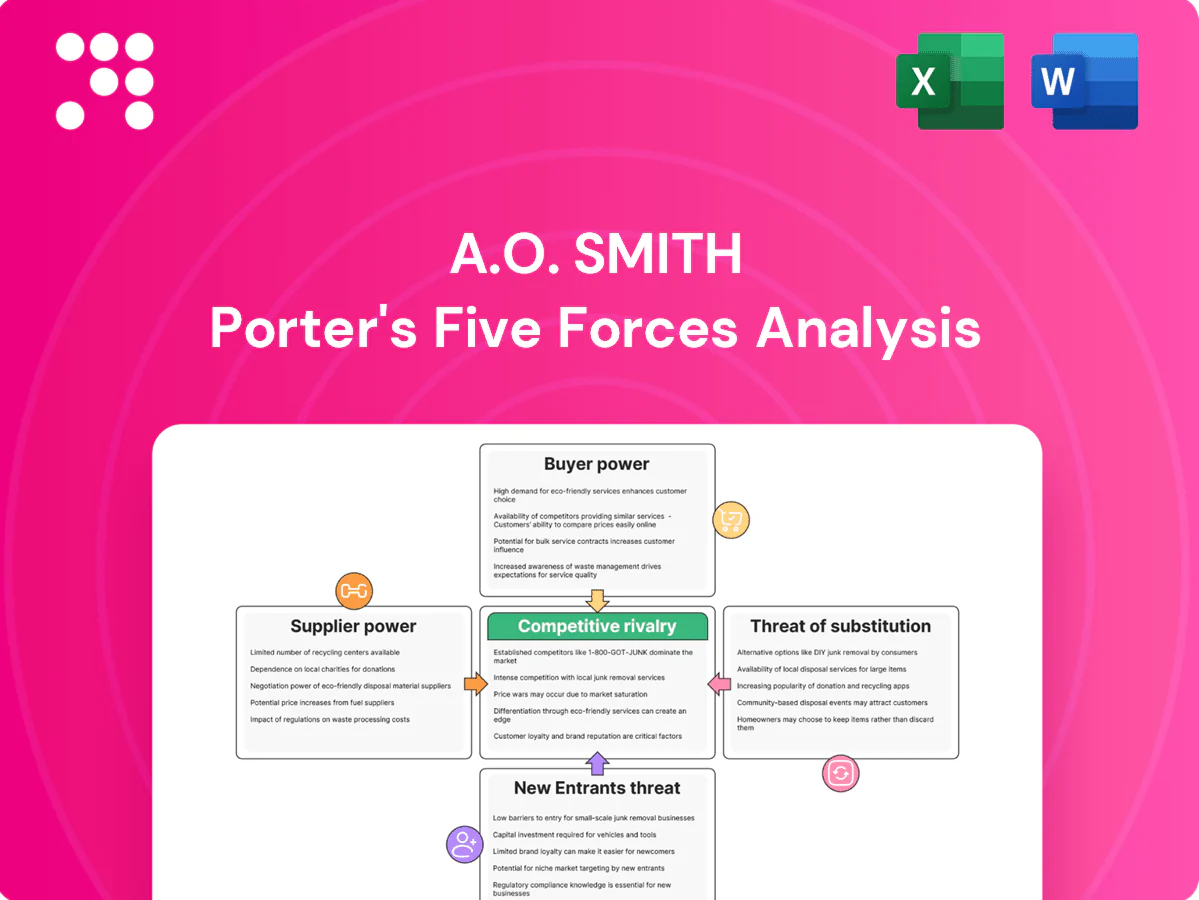
A.O. Smith Porter's Five Forces Analysis

Don't Miss the Bigger Picture
A.O. Smith faces moderate buyer power, steady supplier relationships, and rising substitute pressures from energy‑efficient alternatives, while scale and brand limit new entrants and rivalry centers on innovation and cost. This brief snapshot only scratches the surface. Unlock the full Porter's Five Forces Analysis to explore A.O. Smith’s competitive dynamics, market pressures, and strategic advantages in detail.
Suppliers Bargaining Power

Commodity inputs volatility
Steel, copper, aluminum, resins and electronic components are core inputs for tanks, elements and controls; in 2024 LME copper traded roughly $9,000–10,000/ton and benchmark steel and resin markets showed continued volatility, squeezing margins and forcing repricing. Hedging and multi-sourcing blunt but do not eliminate spike risk. Global freight and tariffs — with container rates still well below 2021 peaks but elevated versus pre‑pandemic levels — add another cost layer.
Specialized components
Heat pump compressors, advanced controls and RO membranes are sourced from a concentrated supplier base, giving vendors leverage over pricing and availability.
Lengthy qualification cycles and safety approvals raise switching costs and extend time-to-market for replacements.
Long lead times can create bottlenecks during demand surges, and dual-qualifying vendors mitigates but does not eliminate dependency.

Scale and contracting leverage
A.O. Smith’s scale enables multi-year supplier contracts and VA/VE initiatives that management cited in its 2024 Form 10-K as key drivers of margin resilience; regional sourcing and supplier consolidation programs reduced logistics and currency exposure in 2024. The company’s stronger procurement leverage in North America—where a majority of revenue is earned—contrasts with weaker bargaining power in fragmented emerging markets.

Quality and compliance requirements
- Standards: ASME, CSA, UL, NSF/ANSI 61
- Risks: recalls, warranty, brand impact
- Effect: greater vendor negotiating leverage
- Controls: continuous audits, PPAP-like processes
Geopolitical and trade exposure
China-centric electronics and metals supply chains expose A. O. Smith to U.S. Section 301 tariffs that target roughly $250 billion of Chinese goods and to expanding export controls on advanced technologies introduced since 2022, raising input-cost and compliance risk. Currency swings compress margins and constrain local pricing flexibility. Localization in India and the U.S. reduces but does not eliminate exposure; diversification and nearshoring remain active mitigants.
- Tariffs: Section 301 covers ~$250B of Chinese goods
- Export controls: tightened since 2022 on advanced tech
- Localization: manufacturing footprints in India and U.S. lower but not remove risk
- Mitigations: diversification and nearshoring ongoing
Copper $9,000–10,000/ton, supplier concentration and China tariff risks
Core inputs (copper $9,000–10,000/ton in 2024; volatile steel/resin) and concentrated suppliers for compressors/controls give vendors pricing leverage; long qualification cycles and safety standards (ASME, CSA, UL, NSF/ANSI 61) raise switching costs. Long lead times and China-centric supply chains expose A.O. Smith to Section 301 tariffs (~$250B) and export controls; scale, multi-year contracts and regional sourcing (India/U.S.) partially mitigate.
| Metric | 2024 datapoint |
|---|---|
| Copper (LME) | $9,000–10,000/ton |
| Section 301 scope | ~$250B |
| Standards limiting suppliers | ASME, CSA, UL, NSF/ANSI 61 |
What is included in the product
 Detailed Word Document
Comprehensive Porter’s Five Forces assessment tailored to A.O. Smith, examining competitive rivalry, supplier and buyer power, threats from new entrants and substitutes, and strategic barriers that protect its market position.

 Customizable Excel Spreadsheet
A clear one-sheet summary of A.O. Smith's Porter’s Five Forces for quick strategic decisions; customize pressure levels with current market data and visualize impacts instantly via a spider/radar chart—ready to drop into decks or Excel dashboards.
Customers Bargaining Power

Channel concentration
Big-box retailers and large distributors like Home Depot and Lowe's (combined FY2023 net sales about $254 billion) command volume and shelf influence and press A.O. Smith on pricing, rebates and marketing support. They negotiate aggressively, using category placement and promotional programs to extract terms. Plumbers and contractors value availability and service but can and do switch brands for price or supply reliability. Losing a key distributor or national account can materially dent regional share and sales cadence.
End-user fragmentation
Residential buyers number in the millions and hold little individual leverage, but online reviews and broad price transparency concentrate collective power and accelerate switching. Commercial specifiers and builders routinely bundle bids to extract concessions. Total cost of ownership narratives and efficiency metrics support A. O. Smith in defending premium pricing.

Switching costs and compatibility
Retrofits hinge on venting, fuel type, footprint and local codes, creating moderate switching frictions for A.O. Smith customers; installer familiarity and a nationwide service network further anchor choices and preserve share.
Warranty depth—A.O. Smith offers up to 10-year residential warranties—plus installer loyalty reduce churn; cartridge filters replaced roughly every 3 months generate recurring revenue and stickiness.
Conversions to tankless or heat pump systems raise up-front costs, often ranging from several hundred to several thousand dollars, tempering rapid customer switching.

Price sensitivity vs performance
Utility bills (2024 EIA average 16.3¢/kWh), efficiency rebates and 2–6 year paybacks now drive A.O. Smith buyers; upfront price is weighed against projected energy savings, reliability and warranty length. Promotions can cause deal-driven switching in commoditized SKUs, while clear performance differentiation reduces pure price-based bargaining.
- Utility bills: 16.3¢/kWh (2024 EIA)
- Rebates: commonly $200–$1,000 (2024 programs)
- Payback: 2–6 years
- Switching: promotions boost short-term churn
Digital and e-commerce influence
Online marketplaces broaden choice and intensify price comparison—global retail e-commerce reached about 22% penetration in 2024, increasing customer leverage. D2C water-treatment entrants raise expectations for fast delivery and seamless returns, while installer platforms can steer selection at point of service. AO Smith’s omni-channel presence and branded service network help mitigate this shift by preserving direct customer touchpoints and margin control.
- Marketplace price transparency ↑ (22% e‑commerce share, 2024)
- D2C raises delivery/convenience expectations
- Installer platforms influence final purchase
- AO Smith omni-channel presence offsets bargaining power
Retailer/installers pressure, e-commerce 22%, rebates and 2-6 yr paybacks
Large retailers (Home Depot/Lowe's combined FY2023 sales ~254B) and installers exert strong price/placement pressure; e‑commerce (22% global retail, 2024) and online review transparency raise collective customer leverage. Utility costs (16.3¢/kWh, 2024 EIA), rebates ($200–$1,000, 2024) and 2–6 year paybacks shape purchase decisions; 10‑year warranties and installer networks limit churn.
| Metric | Value |
|---|---|
| Home Depot+Lowe's FY2023 | $254B |
| E‑commerce share (2024) | 22% |
| Electricity (2024) | 16.3¢/kWh |
| Rebates (2024) | $200–$1,000 |
| Payback | 2–6 yrs |
| Residential warranty | Up to 10 yrs |
Preview Before You Purchase
A.O. Smith Porter's Five Forces Analysis
This A.O. Smith Porter's Five Forces Analysis provides a concise evaluation of competitive rivalry, supplier and buyer power, threats of new entrants and substitutes, and industry dynamics affecting margins and strategy. This preview shows the exact document you'll receive immediately after purchase—no surprises, no placeholders.

Don't Miss the Bigger Picture
A.O. Smith faces moderate buyer power, steady supplier relationships, and rising substitute pressures from energy‑efficient alternatives, while scale and brand limit new entrants and rivalry centers on innovation and cost. This brief snapshot only scratches the surface. Unlock the full Porter's Five Forces Analysis to explore A.O. Smith’s competitive dynamics, market pressures, and strategic advantages in detail.
Suppliers Bargaining Power
Commodity inputs volatility
Steel, copper, aluminum, resins and electronic components are core inputs for tanks, elements and controls; in 2024 LME copper traded roughly $9,000–10,000/ton and benchmark steel and resin markets showed continued volatility, squeezing margins and forcing repricing. Hedging and multi-sourcing blunt but do not eliminate spike risk. Global freight and tariffs — with container rates still well below 2021 peaks but elevated versus pre‑pandemic levels — add another cost layer.
Specialized components
Heat pump compressors, advanced controls and RO membranes are sourced from a concentrated supplier base, giving vendors leverage over pricing and availability.
Lengthy qualification cycles and safety approvals raise switching costs and extend time-to-market for replacements.
Long lead times can create bottlenecks during demand surges, and dual-qualifying vendors mitigates but does not eliminate dependency.
Scale and contracting leverage
A.O. Smith’s scale enables multi-year supplier contracts and VA/VE initiatives that management cited in its 2024 Form 10-K as key drivers of margin resilience; regional sourcing and supplier consolidation programs reduced logistics and currency exposure in 2024. The company’s stronger procurement leverage in North America—where a majority of revenue is earned—contrasts with weaker bargaining power in fragmented emerging markets.
Quality and compliance requirements
- Standards: ASME, CSA, UL, NSF/ANSI 61
- Risks: recalls, warranty, brand impact
- Effect: greater vendor negotiating leverage
- Controls: continuous audits, PPAP-like processes
Geopolitical and trade exposure
China-centric electronics and metals supply chains expose A. O. Smith to U.S. Section 301 tariffs that target roughly $250 billion of Chinese goods and to expanding export controls on advanced technologies introduced since 2022, raising input-cost and compliance risk. Currency swings compress margins and constrain local pricing flexibility. Localization in India and the U.S. reduces but does not eliminate exposure; diversification and nearshoring remain active mitigants.
- Tariffs: Section 301 covers ~$250B of Chinese goods
- Export controls: tightened since 2022 on advanced tech
- Localization: manufacturing footprints in India and U.S. lower but not remove risk
- Mitigations: diversification and nearshoring ongoing
Copper $9,000–10,000/ton, supplier concentration and China tariff risks
Core inputs (copper $9,000–10,000/ton in 2024; volatile steel/resin) and concentrated suppliers for compressors/controls give vendors pricing leverage; long qualification cycles and safety standards (ASME, CSA, UL, NSF/ANSI 61) raise switching costs. Long lead times and China-centric supply chains expose A.O. Smith to Section 301 tariffs (~$250B) and export controls; scale, multi-year contracts and regional sourcing (India/U.S.) partially mitigate.
| Metric | 2024 datapoint |
|---|---|
| Copper (LME) | $9,000–10,000/ton |
| Section 301 scope | ~$250B |
| Standards limiting suppliers | ASME, CSA, UL, NSF/ANSI 61 |
What is included in the product
Detailed Word Document
Comprehensive Porter’s Five Forces assessment tailored to A.O. Smith, examining competitive rivalry, supplier and buyer power, threats from new entrants and substitutes, and strategic barriers that protect its market position.
Customizable Excel Spreadsheet
A clear one-sheet summary of A.O. Smith's Porter’s Five Forces for quick strategic decisions; customize pressure levels with current market data and visualize impacts instantly via a spider/radar chart—ready to drop into decks or Excel dashboards.
Customers Bargaining Power
Channel concentration
Big-box retailers and large distributors like Home Depot and Lowe's (combined FY2023 net sales about $254 billion) command volume and shelf influence and press A.O. Smith on pricing, rebates and marketing support. They negotiate aggressively, using category placement and promotional programs to extract terms. Plumbers and contractors value availability and service but can and do switch brands for price or supply reliability. Losing a key distributor or national account can materially dent regional share and sales cadence.
End-user fragmentation
Residential buyers number in the millions and hold little individual leverage, but online reviews and broad price transparency concentrate collective power and accelerate switching. Commercial specifiers and builders routinely bundle bids to extract concessions. Total cost of ownership narratives and efficiency metrics support A. O. Smith in defending premium pricing.
Switching costs and compatibility
Retrofits hinge on venting, fuel type, footprint and local codes, creating moderate switching frictions for A.O. Smith customers; installer familiarity and a nationwide service network further anchor choices and preserve share.
Warranty depth—A.O. Smith offers up to 10-year residential warranties—plus installer loyalty reduce churn; cartridge filters replaced roughly every 3 months generate recurring revenue and stickiness.
Conversions to tankless or heat pump systems raise up-front costs, often ranging from several hundred to several thousand dollars, tempering rapid customer switching.
Price sensitivity vs performance
Utility bills (2024 EIA average 16.3¢/kWh), efficiency rebates and 2–6 year paybacks now drive A.O. Smith buyers; upfront price is weighed against projected energy savings, reliability and warranty length. Promotions can cause deal-driven switching in commoditized SKUs, while clear performance differentiation reduces pure price-based bargaining.
- Utility bills: 16.3¢/kWh (2024 EIA)
- Rebates: commonly $200–$1,000 (2024 programs)
- Payback: 2–6 years
- Switching: promotions boost short-term churn
Digital and e-commerce influence
Online marketplaces broaden choice and intensify price comparison—global retail e-commerce reached about 22% penetration in 2024, increasing customer leverage. D2C water-treatment entrants raise expectations for fast delivery and seamless returns, while installer platforms can steer selection at point of service. AO Smith’s omni-channel presence and branded service network help mitigate this shift by preserving direct customer touchpoints and margin control.
- Marketplace price transparency ↑ (22% e‑commerce share, 2024)
- D2C raises delivery/convenience expectations
- Installer platforms influence final purchase
- AO Smith omni-channel presence offsets bargaining power
Retailer/installers pressure, e-commerce 22%, rebates and 2-6 yr paybacks
Large retailers (Home Depot/Lowe's combined FY2023 sales ~254B) and installers exert strong price/placement pressure; e‑commerce (22% global retail, 2024) and online review transparency raise collective customer leverage. Utility costs (16.3¢/kWh, 2024 EIA), rebates ($200–$1,000, 2024) and 2–6 year paybacks shape purchase decisions; 10‑year warranties and installer networks limit churn.
| Metric | Value |
|---|---|
| Home Depot+Lowe's FY2023 | $254B |
| E‑commerce share (2024) | 22% |
| Electricity (2024) | 16.3¢/kWh |
| Rebates (2024) | $200–$1,000 |
| Payback | 2–6 yrs |
| Residential warranty | Up to 10 yrs |
Preview Before You Purchase
A.O. Smith Porter's Five Forces Analysis
This A.O. Smith Porter's Five Forces Analysis provides a concise evaluation of competitive rivalry, supplier and buyer power, threats of new entrants and substitutes, and industry dynamics affecting margins and strategy. This preview shows the exact document you'll receive immediately after purchase—no surprises, no placeholders.
Original: $10.00
-65%$10.00
$3.50Description
Don't Miss the Bigger Picture
A.O. Smith faces moderate buyer power, steady supplier relationships, and rising substitute pressures from energy‑efficient alternatives, while scale and brand limit new entrants and rivalry centers on innovation and cost. This brief snapshot only scratches the surface. Unlock the full Porter's Five Forces Analysis to explore A.O. Smith’s competitive dynamics, market pressures, and strategic advantages in detail.
Suppliers Bargaining Power
Commodity inputs volatility
Steel, copper, aluminum, resins and electronic components are core inputs for tanks, elements and controls; in 2024 LME copper traded roughly $9,000–10,000/ton and benchmark steel and resin markets showed continued volatility, squeezing margins and forcing repricing. Hedging and multi-sourcing blunt but do not eliminate spike risk. Global freight and tariffs — with container rates still well below 2021 peaks but elevated versus pre‑pandemic levels — add another cost layer.
Specialized components
Heat pump compressors, advanced controls and RO membranes are sourced from a concentrated supplier base, giving vendors leverage over pricing and availability.
Lengthy qualification cycles and safety approvals raise switching costs and extend time-to-market for replacements.
Long lead times can create bottlenecks during demand surges, and dual-qualifying vendors mitigates but does not eliminate dependency.
Scale and contracting leverage
A.O. Smith’s scale enables multi-year supplier contracts and VA/VE initiatives that management cited in its 2024 Form 10-K as key drivers of margin resilience; regional sourcing and supplier consolidation programs reduced logistics and currency exposure in 2024. The company’s stronger procurement leverage in North America—where a majority of revenue is earned—contrasts with weaker bargaining power in fragmented emerging markets.
Quality and compliance requirements
- Standards: ASME, CSA, UL, NSF/ANSI 61
- Risks: recalls, warranty, brand impact
- Effect: greater vendor negotiating leverage
- Controls: continuous audits, PPAP-like processes
Geopolitical and trade exposure
China-centric electronics and metals supply chains expose A. O. Smith to U.S. Section 301 tariffs that target roughly $250 billion of Chinese goods and to expanding export controls on advanced technologies introduced since 2022, raising input-cost and compliance risk. Currency swings compress margins and constrain local pricing flexibility. Localization in India and the U.S. reduces but does not eliminate exposure; diversification and nearshoring remain active mitigants.
- Tariffs: Section 301 covers ~$250B of Chinese goods
- Export controls: tightened since 2022 on advanced tech
- Localization: manufacturing footprints in India and U.S. lower but not remove risk
- Mitigations: diversification and nearshoring ongoing
Copper $9,000–10,000/ton, supplier concentration and China tariff risks
Core inputs (copper $9,000–10,000/ton in 2024; volatile steel/resin) and concentrated suppliers for compressors/controls give vendors pricing leverage; long qualification cycles and safety standards (ASME, CSA, UL, NSF/ANSI 61) raise switching costs. Long lead times and China-centric supply chains expose A.O. Smith to Section 301 tariffs (~$250B) and export controls; scale, multi-year contracts and regional sourcing (India/U.S.) partially mitigate.
| Metric | 2024 datapoint |
|---|---|
| Copper (LME) | $9,000–10,000/ton |
| Section 301 scope | ~$250B |
| Standards limiting suppliers | ASME, CSA, UL, NSF/ANSI 61 |
What is included in the product
Detailed Word Document
Comprehensive Porter’s Five Forces assessment tailored to A.O. Smith, examining competitive rivalry, supplier and buyer power, threats from new entrants and substitutes, and strategic barriers that protect its market position.
Customizable Excel Spreadsheet
A clear one-sheet summary of A.O. Smith's Porter’s Five Forces for quick strategic decisions; customize pressure levels with current market data and visualize impacts instantly via a spider/radar chart—ready to drop into decks or Excel dashboards.
Customers Bargaining Power
Channel concentration
Big-box retailers and large distributors like Home Depot and Lowe's (combined FY2023 net sales about $254 billion) command volume and shelf influence and press A.O. Smith on pricing, rebates and marketing support. They negotiate aggressively, using category placement and promotional programs to extract terms. Plumbers and contractors value availability and service but can and do switch brands for price or supply reliability. Losing a key distributor or national account can materially dent regional share and sales cadence.
End-user fragmentation
Residential buyers number in the millions and hold little individual leverage, but online reviews and broad price transparency concentrate collective power and accelerate switching. Commercial specifiers and builders routinely bundle bids to extract concessions. Total cost of ownership narratives and efficiency metrics support A. O. Smith in defending premium pricing.
Switching costs and compatibility
Retrofits hinge on venting, fuel type, footprint and local codes, creating moderate switching frictions for A.O. Smith customers; installer familiarity and a nationwide service network further anchor choices and preserve share.
Warranty depth—A.O. Smith offers up to 10-year residential warranties—plus installer loyalty reduce churn; cartridge filters replaced roughly every 3 months generate recurring revenue and stickiness.
Conversions to tankless or heat pump systems raise up-front costs, often ranging from several hundred to several thousand dollars, tempering rapid customer switching.
Price sensitivity vs performance
Utility bills (2024 EIA average 16.3¢/kWh), efficiency rebates and 2–6 year paybacks now drive A.O. Smith buyers; upfront price is weighed against projected energy savings, reliability and warranty length. Promotions can cause deal-driven switching in commoditized SKUs, while clear performance differentiation reduces pure price-based bargaining.
- Utility bills: 16.3¢/kWh (2024 EIA)
- Rebates: commonly $200–$1,000 (2024 programs)
- Payback: 2–6 years
- Switching: promotions boost short-term churn
Digital and e-commerce influence
Online marketplaces broaden choice and intensify price comparison—global retail e-commerce reached about 22% penetration in 2024, increasing customer leverage. D2C water-treatment entrants raise expectations for fast delivery and seamless returns, while installer platforms can steer selection at point of service. AO Smith’s omni-channel presence and branded service network help mitigate this shift by preserving direct customer touchpoints and margin control.
- Marketplace price transparency ↑ (22% e‑commerce share, 2024)
- D2C raises delivery/convenience expectations
- Installer platforms influence final purchase
- AO Smith omni-channel presence offsets bargaining power
Retailer/installers pressure, e-commerce 22%, rebates and 2-6 yr paybacks
Large retailers (Home Depot/Lowe's combined FY2023 sales ~254B) and installers exert strong price/placement pressure; e‑commerce (22% global retail, 2024) and online review transparency raise collective customer leverage. Utility costs (16.3¢/kWh, 2024 EIA), rebates ($200–$1,000, 2024) and 2–6 year paybacks shape purchase decisions; 10‑year warranties and installer networks limit churn.
| Metric | Value |
|---|---|
| Home Depot+Lowe's FY2023 | $254B |
| E‑commerce share (2024) | 22% |
| Electricity (2024) | 16.3¢/kWh |
| Rebates (2024) | $200–$1,000 |
| Payback | 2–6 yrs |
| Residential warranty | Up to 10 yrs |
Preview Before You Purchase
A.O. Smith Porter's Five Forces Analysis
This A.O. Smith Porter's Five Forces Analysis provides a concise evaluation of competitive rivalry, supplier and buyer power, threats of new entrants and substitutes, and industry dynamics affecting margins and strategy. This preview shows the exact document you'll receive immediately after purchase—no surprises, no placeholders.











