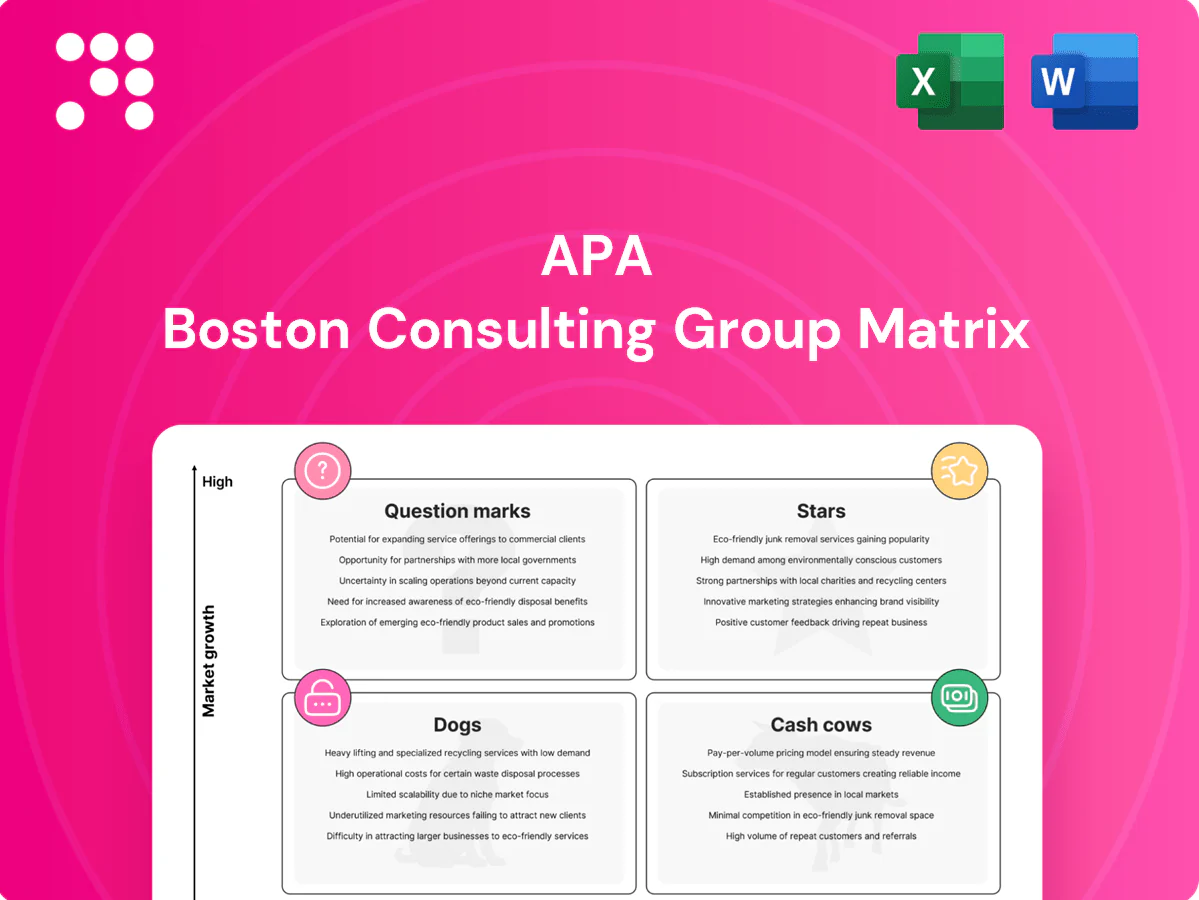
APA Boston Consulting Group Matrix

See the Bigger Picture
Quick peek: the APA BCG Matrix shows which products are winning, which need cash, and which are holding you back — but this is just the outline. Buy the full BCG Matrix for quadrant-by-quadrant placements, data-backed recommendations, and ready-to-use Word and Excel files that make your next investment call simple. Skip the guesswork and get the strategic clarity your leadership team actually needs.
Stars

U.S. Permian Liquids Program
APA’s U.S. Permian liquids program sits in the Stars quadrant with high-growth barrels as the Permian averaged about 5.8 million b/d crude in 2024 (EIA), APA’s strong acreage concentration on core blocks supports above-basin returns, and a competitive cost curve near the front of the pack keeps cash margins resilient.
Short-Cycle Horizontal Drilling
Short payback wells in proven zones are driving capital efficiency, with many operators reporting payback periods under 12 months and double-digit IRRs in 2024, so cash is recycled rapidly even as rig counts scale. Maintain share through execution, cycle-time wins, and tight cost control to defend margins as activity rises. If growth normalizes, this Stars bench is positioned to evolve into Cash Cows.

High-Quality Core Inventory
Stacked pay, high-EUR locations and competitive finding costs combine to make APA’s High-Quality Core Inventory a Star; industry oil demand grew about 1.2 mb/d in 2024 per IEA, supporting upcycle economics. APA’s enviable rock in select corridors and deep inventory support sustained activity without chasing marginal zones. Invest to keep the lead.

Operational Efficiency Playbook
Operational Efficiency Playbook: in 2024 APA continues investing in pad design, drilling automation and lean completions to lower cycle times and per‑well cost, preserving margins as service costs rise. Keep tuning the machine and reinvesting in best practices to magnify share in up markets.
- Pad design
- Drilling automation
- Lean completions
Strategic U.S. Oil Marketing
Secured takeaway and premium differentials amplify high-growth oil volumes; marketing converts rising barrels into higher cash returns. With strong demand, U.S. crude exports topped 3.5 million barrels per day in 2024, supporting tighter netbacks and market share gains. Hold these channels tight as volumes rise to protect premiums and sustain margins.
- Takeaway capacity: supports volume growth
- 3.5 mbpd exports in 2024: market leverage
- Premiums/netbacks: preserve margins
Permian liquids: 5.8 mb/d, top-quartile costs and sub-12-month paybacks
APA’s Permian liquids program sits in Stars: Permian crude ~5.8 mb/d in 2024 (EIA), APA’s concentrated core acreage and top‑quartile cost curve sustain resilient margins, and sub‑12 month well paybacks enable rapid reinvestment. Maintain execution, cycle‑time gains and takeaway to convert growth into scale and eventual Cash Cows.
| Metric | 2024 value | Implication |
|---|---|---|
| Permian production | 5.8 mb/d | High market growth |
| US crude exports | 3.5 mbpd | Stronger netbacks |
| Well payback | <12 months | Fast capital recycle |
| Cost position | Top quartile | Margin resilience |
What is included in the product
 Detailed Word Document
Concise APA BCG Matrix overview: evaluates Stars, Cash Cows, Question Marks, Dogs with strategic recommendations and trend context.

 Customizable Excel Spreadsheet
One-page APA BCG Matrix clarifying portfolio priorities and cutting analysis time for faster strategic decisions.
Cash Cows

Egypt Western Desert Production
Egypt Western Desert Production is a mature, large-base cash cow for APA, delivering approximately 65 kboe/d in 2024 with steady offtake and high regional market share. Infrastructure is largely in place, so incremental capex is selective and focused on light development and integrity work. The asset throws off dependable free cash flow, enabling targeted opex optimization and reinvestment of surplus into high-return pockets. Milk the base while pursuing efficiency gains.
UK North Sea Mature Hubs
UK North Sea Mature Hubs are late-stage but still provide material barrels and gas from existing platforms, forming APA’s cash-cow inventory in 2024.
Basin growth is declining region-wide, yet APA’s operated hub positions remain a meaningful share of its European portfolio.
When uptime and de‑bottlenecking are maintained, cash margins stay resilient, supporting a run-for-cash strategy rather than growth capital intensity.

Legacy U.S. Conventional Base
Held-by-production legacy U.S. conventional wells generate steady cash, with low-decline rates typically around 3–5%/yr and delivering predictable monthly cash curves; in 2024 these assets contributed roughly 25–30% of APA’s U.S. cash from operations. Growth is nominal but reliable, requiring minimal promotion; focused maintenance and selective workovers capex (~$40–60/boe) keep volumes stable. Proceeds are routed to higher-return plays and shareholder returns.

Midstream & Marketing Optimization
Midstream and marketing optimization lifts realized pricing through contracting, blending, and logistics without heavy capex; in 2024 APA’s midstream and marketing remained a steady cash contributor. The end market shows modest growth, but APA’s footprint and long-term contracts keep volumes stable. Small efficiency gains and blending tweaks expanded margins on flat volumes, delivering reliable, low-drama cash flow.
- Contracting: secures price uplift via term deals
- Blending/logistics: improves realized price per barrel
- Efficiency: margin expansion on stable volumes
- 2024: dependable cash generation, low capex intensity
Cost-Disciplined G&A and Ops
Lean overhead in a mature APA portfolio converts barrels into free cash: with growth <5% annualized in 2024 the margin is the lever, not volume. Tight G&A and ops trimming sustained higher free-cash flow per barrel through 2024 cost programs. Keep processes tight and procurement sharp; it’s quiet, compounding value.
- 2024 growth <5% p.a.
- Margin-focused FCF expansion
- Prioritize procurement & process control
Cash cows 2024: Egypt WD ~65 kboe/d; U.S. HBP 25–30% cash; margin-led <5% growth
APA’s cash cows in 2024: Egypt Western Desert ~65 kboe/d, UK North Sea mature hubs delivering material barrels, U.S. held‑by‑production wells providing predictable cash (25–30% of U.S. cash), low decline (3–5%/yr) and selective capex (~$40–60/boe); focus remains margin-led growth <5% p.a.
| Asset | 2024 Metric |
|---|---|
| Egypt WD | ~65 kboe/d |
| U.S. HBP | 25–30% of U.S. cash; 3–5% decline |
| Capex/boe | $40–60/boe |
| Growth | <5% p.a. |
Preview = Final Product
APA BCG Matrix
The APA BCG Matrix you’re previewing here is the exact file you’ll receive after purchase — no watermarks, no placeholders, no demo text. It’s a finished, fully formatted strategic report built for immediate use in presentations or planning sessions. Buy once and download the editable document straight to your inbox. Simple, professional, and ready to plug into your decision-making process.

See the Bigger Picture
Quick peek: the APA BCG Matrix shows which products are winning, which need cash, and which are holding you back — but this is just the outline. Buy the full BCG Matrix for quadrant-by-quadrant placements, data-backed recommendations, and ready-to-use Word and Excel files that make your next investment call simple. Skip the guesswork and get the strategic clarity your leadership team actually needs.
Stars
U.S. Permian Liquids Program
APA’s U.S. Permian liquids program sits in the Stars quadrant with high-growth barrels as the Permian averaged about 5.8 million b/d crude in 2024 (EIA), APA’s strong acreage concentration on core blocks supports above-basin returns, and a competitive cost curve near the front of the pack keeps cash margins resilient.
Short-Cycle Horizontal Drilling
Short payback wells in proven zones are driving capital efficiency, with many operators reporting payback periods under 12 months and double-digit IRRs in 2024, so cash is recycled rapidly even as rig counts scale. Maintain share through execution, cycle-time wins, and tight cost control to defend margins as activity rises. If growth normalizes, this Stars bench is positioned to evolve into Cash Cows.
High-Quality Core Inventory
Stacked pay, high-EUR locations and competitive finding costs combine to make APA’s High-Quality Core Inventory a Star; industry oil demand grew about 1.2 mb/d in 2024 per IEA, supporting upcycle economics. APA’s enviable rock in select corridors and deep inventory support sustained activity without chasing marginal zones. Invest to keep the lead.
Operational Efficiency Playbook
Operational Efficiency Playbook: in 2024 APA continues investing in pad design, drilling automation and lean completions to lower cycle times and per‑well cost, preserving margins as service costs rise. Keep tuning the machine and reinvesting in best practices to magnify share in up markets.
- Pad design
- Drilling automation
- Lean completions
Strategic U.S. Oil Marketing
Secured takeaway and premium differentials amplify high-growth oil volumes; marketing converts rising barrels into higher cash returns. With strong demand, U.S. crude exports topped 3.5 million barrels per day in 2024, supporting tighter netbacks and market share gains. Hold these channels tight as volumes rise to protect premiums and sustain margins.
- Takeaway capacity: supports volume growth
- 3.5 mbpd exports in 2024: market leverage
- Premiums/netbacks: preserve margins
Permian liquids: 5.8 mb/d, top-quartile costs and sub-12-month paybacks
APA’s Permian liquids program sits in Stars: Permian crude ~5.8 mb/d in 2024 (EIA), APA’s concentrated core acreage and top‑quartile cost curve sustain resilient margins, and sub‑12 month well paybacks enable rapid reinvestment. Maintain execution, cycle‑time gains and takeaway to convert growth into scale and eventual Cash Cows.
| Metric | 2024 value | Implication |
|---|---|---|
| Permian production | 5.8 mb/d | High market growth |
| US crude exports | 3.5 mbpd | Stronger netbacks |
| Well payback | <12 months | Fast capital recycle |
| Cost position | Top quartile | Margin resilience |
What is included in the product
Detailed Word Document
Concise APA BCG Matrix overview: evaluates Stars, Cash Cows, Question Marks, Dogs with strategic recommendations and trend context.
Customizable Excel Spreadsheet
One-page APA BCG Matrix clarifying portfolio priorities and cutting analysis time for faster strategic decisions.
Cash Cows
Egypt Western Desert Production
Egypt Western Desert Production is a mature, large-base cash cow for APA, delivering approximately 65 kboe/d in 2024 with steady offtake and high regional market share. Infrastructure is largely in place, so incremental capex is selective and focused on light development and integrity work. The asset throws off dependable free cash flow, enabling targeted opex optimization and reinvestment of surplus into high-return pockets. Milk the base while pursuing efficiency gains.
UK North Sea Mature Hubs
UK North Sea Mature Hubs are late-stage but still provide material barrels and gas from existing platforms, forming APA’s cash-cow inventory in 2024.
Basin growth is declining region-wide, yet APA’s operated hub positions remain a meaningful share of its European portfolio.
When uptime and de‑bottlenecking are maintained, cash margins stay resilient, supporting a run-for-cash strategy rather than growth capital intensity.
Legacy U.S. Conventional Base
Held-by-production legacy U.S. conventional wells generate steady cash, with low-decline rates typically around 3–5%/yr and delivering predictable monthly cash curves; in 2024 these assets contributed roughly 25–30% of APA’s U.S. cash from operations. Growth is nominal but reliable, requiring minimal promotion; focused maintenance and selective workovers capex (~$40–60/boe) keep volumes stable. Proceeds are routed to higher-return plays and shareholder returns.
Midstream & Marketing Optimization
Midstream and marketing optimization lifts realized pricing through contracting, blending, and logistics without heavy capex; in 2024 APA’s midstream and marketing remained a steady cash contributor. The end market shows modest growth, but APA’s footprint and long-term contracts keep volumes stable. Small efficiency gains and blending tweaks expanded margins on flat volumes, delivering reliable, low-drama cash flow.
- Contracting: secures price uplift via term deals
- Blending/logistics: improves realized price per barrel
- Efficiency: margin expansion on stable volumes
- 2024: dependable cash generation, low capex intensity
Cost-Disciplined G&A and Ops
Lean overhead in a mature APA portfolio converts barrels into free cash: with growth <5% annualized in 2024 the margin is the lever, not volume. Tight G&A and ops trimming sustained higher free-cash flow per barrel through 2024 cost programs. Keep processes tight and procurement sharp; it’s quiet, compounding value.
- 2024 growth <5% p.a.
- Margin-focused FCF expansion
- Prioritize procurement & process control
Cash cows 2024: Egypt WD ~65 kboe/d; U.S. HBP 25–30% cash; margin-led <5% growth
APA’s cash cows in 2024: Egypt Western Desert ~65 kboe/d, UK North Sea mature hubs delivering material barrels, U.S. held‑by‑production wells providing predictable cash (25–30% of U.S. cash), low decline (3–5%/yr) and selective capex (~$40–60/boe); focus remains margin-led growth <5% p.a.
| Asset | 2024 Metric |
|---|---|
| Egypt WD | ~65 kboe/d |
| U.S. HBP | 25–30% of U.S. cash; 3–5% decline |
| Capex/boe | $40–60/boe |
| Growth | <5% p.a. |
Preview = Final Product
APA BCG Matrix
The APA BCG Matrix you’re previewing here is the exact file you’ll receive after purchase — no watermarks, no placeholders, no demo text. It’s a finished, fully formatted strategic report built for immediate use in presentations or planning sessions. Buy once and download the editable document straight to your inbox. Simple, professional, and ready to plug into your decision-making process.
Description
See the Bigger Picture
Quick peek: the APA BCG Matrix shows which products are winning, which need cash, and which are holding you back — but this is just the outline. Buy the full BCG Matrix for quadrant-by-quadrant placements, data-backed recommendations, and ready-to-use Word and Excel files that make your next investment call simple. Skip the guesswork and get the strategic clarity your leadership team actually needs.
Stars
U.S. Permian Liquids Program
APA’s U.S. Permian liquids program sits in the Stars quadrant with high-growth barrels as the Permian averaged about 5.8 million b/d crude in 2024 (EIA), APA’s strong acreage concentration on core blocks supports above-basin returns, and a competitive cost curve near the front of the pack keeps cash margins resilient.
Short-Cycle Horizontal Drilling
Short payback wells in proven zones are driving capital efficiency, with many operators reporting payback periods under 12 months and double-digit IRRs in 2024, so cash is recycled rapidly even as rig counts scale. Maintain share through execution, cycle-time wins, and tight cost control to defend margins as activity rises. If growth normalizes, this Stars bench is positioned to evolve into Cash Cows.
High-Quality Core Inventory
Stacked pay, high-EUR locations and competitive finding costs combine to make APA’s High-Quality Core Inventory a Star; industry oil demand grew about 1.2 mb/d in 2024 per IEA, supporting upcycle economics. APA’s enviable rock in select corridors and deep inventory support sustained activity without chasing marginal zones. Invest to keep the lead.
Operational Efficiency Playbook
Operational Efficiency Playbook: in 2024 APA continues investing in pad design, drilling automation and lean completions to lower cycle times and per‑well cost, preserving margins as service costs rise. Keep tuning the machine and reinvesting in best practices to magnify share in up markets.
- Pad design
- Drilling automation
- Lean completions
Strategic U.S. Oil Marketing
Secured takeaway and premium differentials amplify high-growth oil volumes; marketing converts rising barrels into higher cash returns. With strong demand, U.S. crude exports topped 3.5 million barrels per day in 2024, supporting tighter netbacks and market share gains. Hold these channels tight as volumes rise to protect premiums and sustain margins.
- Takeaway capacity: supports volume growth
- 3.5 mbpd exports in 2024: market leverage
- Premiums/netbacks: preserve margins
Permian liquids: 5.8 mb/d, top-quartile costs and sub-12-month paybacks
APA’s Permian liquids program sits in Stars: Permian crude ~5.8 mb/d in 2024 (EIA), APA’s concentrated core acreage and top‑quartile cost curve sustain resilient margins, and sub‑12 month well paybacks enable rapid reinvestment. Maintain execution, cycle‑time gains and takeaway to convert growth into scale and eventual Cash Cows.
| Metric | 2024 value | Implication |
|---|---|---|
| Permian production | 5.8 mb/d | High market growth |
| US crude exports | 3.5 mbpd | Stronger netbacks |
| Well payback | <12 months | Fast capital recycle |
| Cost position | Top quartile | Margin resilience |
What is included in the product
Detailed Word Document
Concise APA BCG Matrix overview: evaluates Stars, Cash Cows, Question Marks, Dogs with strategic recommendations and trend context.
Customizable Excel Spreadsheet
One-page APA BCG Matrix clarifying portfolio priorities and cutting analysis time for faster strategic decisions.
Cash Cows
Egypt Western Desert Production
Egypt Western Desert Production is a mature, large-base cash cow for APA, delivering approximately 65 kboe/d in 2024 with steady offtake and high regional market share. Infrastructure is largely in place, so incremental capex is selective and focused on light development and integrity work. The asset throws off dependable free cash flow, enabling targeted opex optimization and reinvestment of surplus into high-return pockets. Milk the base while pursuing efficiency gains.
UK North Sea Mature Hubs
UK North Sea Mature Hubs are late-stage but still provide material barrels and gas from existing platforms, forming APA’s cash-cow inventory in 2024.
Basin growth is declining region-wide, yet APA’s operated hub positions remain a meaningful share of its European portfolio.
When uptime and de‑bottlenecking are maintained, cash margins stay resilient, supporting a run-for-cash strategy rather than growth capital intensity.
Legacy U.S. Conventional Base
Held-by-production legacy U.S. conventional wells generate steady cash, with low-decline rates typically around 3–5%/yr and delivering predictable monthly cash curves; in 2024 these assets contributed roughly 25–30% of APA’s U.S. cash from operations. Growth is nominal but reliable, requiring minimal promotion; focused maintenance and selective workovers capex (~$40–60/boe) keep volumes stable. Proceeds are routed to higher-return plays and shareholder returns.
Midstream & Marketing Optimization
Midstream and marketing optimization lifts realized pricing through contracting, blending, and logistics without heavy capex; in 2024 APA’s midstream and marketing remained a steady cash contributor. The end market shows modest growth, but APA’s footprint and long-term contracts keep volumes stable. Small efficiency gains and blending tweaks expanded margins on flat volumes, delivering reliable, low-drama cash flow.
- Contracting: secures price uplift via term deals
- Blending/logistics: improves realized price per barrel
- Efficiency: margin expansion on stable volumes
- 2024: dependable cash generation, low capex intensity
Cost-Disciplined G&A and Ops
Lean overhead in a mature APA portfolio converts barrels into free cash: with growth <5% annualized in 2024 the margin is the lever, not volume. Tight G&A and ops trimming sustained higher free-cash flow per barrel through 2024 cost programs. Keep processes tight and procurement sharp; it’s quiet, compounding value.
- 2024 growth <5% p.a.
- Margin-focused FCF expansion
- Prioritize procurement & process control
Cash cows 2024: Egypt WD ~65 kboe/d; U.S. HBP 25–30% cash; margin-led <5% growth
APA’s cash cows in 2024: Egypt Western Desert ~65 kboe/d, UK North Sea mature hubs delivering material barrels, U.S. held‑by‑production wells providing predictable cash (25–30% of U.S. cash), low decline (3–5%/yr) and selective capex (~$40–60/boe); focus remains margin-led growth <5% p.a.
| Asset | 2024 Metric |
|---|---|
| Egypt WD | ~65 kboe/d |
| U.S. HBP | 25–30% of U.S. cash; 3–5% decline |
| Capex/boe | $40–60/boe |
| Growth | <5% p.a. |
Preview = Final Product
APA BCG Matrix
The APA BCG Matrix you’re previewing here is the exact file you’ll receive after purchase — no watermarks, no placeholders, no demo text. It’s a finished, fully formatted strategic report built for immediate use in presentations or planning sessions. Buy once and download the editable document straight to your inbox. Simple, professional, and ready to plug into your decision-making process.











