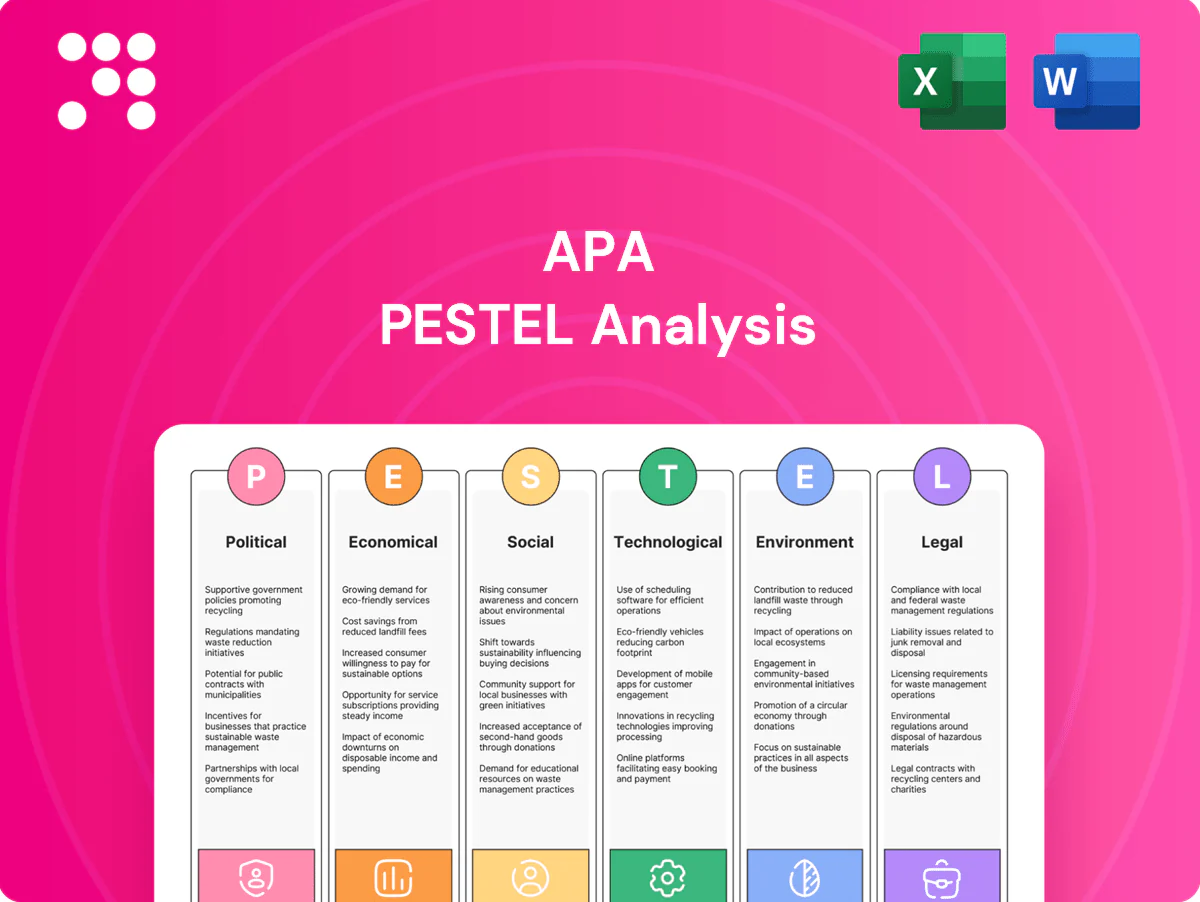
APA PESTLE Analysis

Your Competitive Advantage Starts with This Report
Discover how political, economic, social, technological, legal, and environmental forces are reshaping APA’s future in our concise PESTLE Analysis—designed for investors, strategists, and advisors. Download the full report for in-depth insights, actionable risks and opportunities, and editable charts ready for immediate use.
Political factors

Geopolitics in Egypt
Operations in Egypt face exposure to regional security and policy shifts; production-sharing terms and state partner priorities can change with administrations. Stability improves project continuity, while unrest can disrupt logistics and permitting. Proactive stakeholder engagement mitigates volatility. Egypt has about 110 million people (2024) and IMF 2024 GDP growth around 3.5%, underscoring political-economic sensitivity.
US energy policy
Federal leasing and permitting timelines—often multi-year—plus incentives from the Inflation Reduction Act (about $369 billion for clean energy) shape drilling cadence and capital allocation; federal offshore areas accounted for roughly 15% of US crude production in 2022. Shifts between pro-development and climate-forward agendas alter access and compliance costs, while pipeline and LNG export approvals (US capacity ~12.5 Bcf/d in 2024) determine realized pricing. Policy predictability is critical for long-cycle investments and reserve development planning.

UK North Sea stance
Windfall taxes and tighter licensing in the UK North Sea—exemplified by the Energy Profits Levy introduced in 2022—have materially squeezed operator cash flows and reinvestment capacity. Decommissioning reliefs and allowances, with estimated UK decommissioning liabilities near £60 billion, can offset fiscal drag if well designed. Political pressure to meet the 2050 net-zero target may tighten standards and operating costs over time. Stable fiscal and licensing rules reduce reserve and abandonment risk and support continued production (~1.1 mbpd).

International relations
International relations shape equipment sourcing and sales through sanctions, trade rules and currency controls that raise costs and restrict markets; UNCTAD noted global FDI weakened to roughly $1.0 trillion in 2023, slowing cross-border deals and JV approvals into 2024–25. Diplomatic ties determine dispute-resolution access and enforcement; lengthy cross-border approvals can delay project startups, so diversifying supply chains reduces exposure and operational risk.
- Sanctions/trade rules: restrict markets and inputs
- Currency controls: affect repatriation and pricing
- Diplomatic ties: influence dispute resolution
- JV approvals: can delay projects
- Diversify supply chains: lowers geopolitical risk
Local content and community
- Mandates: 20–40% local content (2024)
- Social spend: 1–3% capex
- Risks: permit delays, protests
Political risk reshapes energy investment: Egypt, UK fiscal terms and US IRA shift project economics
Political risk alters access, costs and timelines: Egypt (110m, 2024; IMF GDP ~3.5% 2024) and UK (production ~1.1 mbpd) show how fiscal terms, permits and net-zero targets shift investment; US federal leasing, IRA (~$369bn) and LNG capacity (~12.5 Bcf/d 2024) change project economics. Sanctions/FDI drag (UNCTAD FDI ~$1.0tn 2023) and local content (20–40%) raise supply-chain and social costs (1–3% capex).
| Metric | Value (year) |
|---|---|
| Egypt population | 110m (2024) |
| IMF GDP growth Egypt | ~3.5% (2024) |
| IRA funding | $369bn |
| US LNG cap. | ~12.5 Bcf/d (2024) |
| UK decomm. liab. | ~£60bn |
| Global FDI | ~$1.0tn (2023) |
What is included in the product
 Detailed Word Document
Explores how Political, Economic, Social, Technological, Environmental, and Legal forces uniquely impact the APA, combining data-driven trends and regional industry context to reveal risks and opportunities. Designed for executives and investors, the analysis includes actionable, forward-looking insights ready for business plans and scenario planning.

 Customizable Excel Spreadsheet
A concise APA PESTLE summary, visually segmented by category, streamlines external risk assessment for quick inclusion in presentations or planning sessions, is editable for local context, and easily shareable across teams and client reports.
Economic factors

Commodity price cycles
Oil and gas price volatility drives revenues, cash flow, and capex flexibility — Brent averaged about $85/barrel in 2024, amplifying year‑on‑year cash swings for producers.
Hedging smooths near‑term cash but caps upside: many majors hedged >30% of 2024 volumes, protecting budgets while foregoing windfalls.
Supply‑demand balances, OPEC+ voluntary cuts and shifting LNG flows tightened realizations through 2024–25, keeping spot spikes possible.
Strict capital discipline and deferment of noncore capex proved essential in down cycles to preserve liquidity and ratings.
Inflation and costs
Service inflation has outpaced general inflation, with U.S. CPI averaging 3.4% in 2024 (BLS), raising drilling, completion and labor expenses and squeezing well-level margins. Steel, frac sand and equipment supply constraints have repeatedly forced schedule delays and higher unit costs, materially affecting well economics. Index-linked contracts and inflation escalators can stabilize margins by passing costs through to customers. Sustained productivity gains must exceed cost creep to preserve returns.

Exchange rates
Movements in the Egyptian pound (EGP) — which depreciated roughly 50% versus the USD after the 2022–23 float — and the British pound (GBP ~1.25 USD in mid‑2024) raise local costs when reporting in USD and compress margins. Currency controls in Egypt have periodically delayed cash repatriation, extending collection cycles by weeks to months. Active hedging (forwards/options) reduces earnings volatility, while natural hedges emerge when local revenues match local costs.

Capital markets access
Capital markets access hinges on interest rates and credit spreads: the US 10-year Treasury near 4.2% (July 2025) and IG spreads roughly 150–200 bps set refinancing and debt costs; equity valuations determine acquisition currency and investment capacity; investor demand for free cash flow and returns drives payout and buyback policies; firms with strong balance sheets face lower cyclicality and refinancing risk.
- Rates: US 10y ≈ 4.2% (Jul 2025)
- Spreads: IG ≈ 150–200 bps
- Equity value → acquisition currency
- FCF focus → payout/buybacks
- Strong balance sheets = lower cycle risk
Energy transition demand
Gas and LNG are positioned as bridge fuels in power generation, with global LNG trade reaching about 390 Mt in 2023, supporting near-term power flexibility; long-run oil demand uncertainty (IEA net-zero pathways project steep declines over coming decades) compresses terminal-value assumptions; CCUS commercial capacity reached roughly 47 MtCO2/year by 2024, creating potential revenue/incentive streams; portfolios must align with diverging regional demand trajectories (Asia growth, OECD transition).
- Bridge fuel: LNG ~390 Mt (2023)
- Oil risk: IEA net-zero scenarios lower long-term demand
- CCUS: ~47 MtCO2/year capacity (2024)
- Strategy: regional demand alignment (Asia vs OECD)
Political risk reshapes energy investment: Egypt, UK fiscal terms and US IRA shift project economics
Brent ≈ $85/bbl (2024) drove cash/price volatility; majors hedged >30% of 2024 volumes, limiting upside. US 10y ≈ 4.2% (Jul 2025) and IG spreads ~150–200bps shaped financing costs; U.S. CPI ~3.4% (2024) raised service costs. LNG trade ~390 Mt (2023) supports near-term demand; EGP ≈ -50% vs USD since 2022–23 float, increasing FX risk.
| Metric | Value |
|---|---|
| Brent 2024 | $85/bbl |
| US 10y (Jul 2025) | 4.2% |
| LNG 2023 | 390 Mt |
Preview the Actual Deliverable
APA PESTLE Analysis
The APA PESTLE Analysis preview shown here is the exact, fully formatted document you’ll receive after purchase—professionally structured and ready to use. No placeholders or teasers: the content, layout, and citations visible are the final file you’ll download immediately after checkout.

Your Competitive Advantage Starts with This Report
Discover how political, economic, social, technological, legal, and environmental forces are reshaping APA’s future in our concise PESTLE Analysis—designed for investors, strategists, and advisors. Download the full report for in-depth insights, actionable risks and opportunities, and editable charts ready for immediate use.
Political factors
Geopolitics in Egypt
Operations in Egypt face exposure to regional security and policy shifts; production-sharing terms and state partner priorities can change with administrations. Stability improves project continuity, while unrest can disrupt logistics and permitting. Proactive stakeholder engagement mitigates volatility. Egypt has about 110 million people (2024) and IMF 2024 GDP growth around 3.5%, underscoring political-economic sensitivity.
US energy policy
Federal leasing and permitting timelines—often multi-year—plus incentives from the Inflation Reduction Act (about $369 billion for clean energy) shape drilling cadence and capital allocation; federal offshore areas accounted for roughly 15% of US crude production in 2022. Shifts between pro-development and climate-forward agendas alter access and compliance costs, while pipeline and LNG export approvals (US capacity ~12.5 Bcf/d in 2024) determine realized pricing. Policy predictability is critical for long-cycle investments and reserve development planning.
UK North Sea stance
Windfall taxes and tighter licensing in the UK North Sea—exemplified by the Energy Profits Levy introduced in 2022—have materially squeezed operator cash flows and reinvestment capacity. Decommissioning reliefs and allowances, with estimated UK decommissioning liabilities near £60 billion, can offset fiscal drag if well designed. Political pressure to meet the 2050 net-zero target may tighten standards and operating costs over time. Stable fiscal and licensing rules reduce reserve and abandonment risk and support continued production (~1.1 mbpd).
International relations
International relations shape equipment sourcing and sales through sanctions, trade rules and currency controls that raise costs and restrict markets; UNCTAD noted global FDI weakened to roughly $1.0 trillion in 2023, slowing cross-border deals and JV approvals into 2024–25. Diplomatic ties determine dispute-resolution access and enforcement; lengthy cross-border approvals can delay project startups, so diversifying supply chains reduces exposure and operational risk.
- Sanctions/trade rules: restrict markets and inputs
- Currency controls: affect repatriation and pricing
- Diplomatic ties: influence dispute resolution
- JV approvals: can delay projects
- Diversify supply chains: lowers geopolitical risk
Local content and community
- Mandates: 20–40% local content (2024)
- Social spend: 1–3% capex
- Risks: permit delays, protests
Political risk reshapes energy investment: Egypt, UK fiscal terms and US IRA shift project economics
Political risk alters access, costs and timelines: Egypt (110m, 2024; IMF GDP ~3.5% 2024) and UK (production ~1.1 mbpd) show how fiscal terms, permits and net-zero targets shift investment; US federal leasing, IRA (~$369bn) and LNG capacity (~12.5 Bcf/d 2024) change project economics. Sanctions/FDI drag (UNCTAD FDI ~$1.0tn 2023) and local content (20–40%) raise supply-chain and social costs (1–3% capex).
| Metric | Value (year) |
|---|---|
| Egypt population | 110m (2024) |
| IMF GDP growth Egypt | ~3.5% (2024) |
| IRA funding | $369bn |
| US LNG cap. | ~12.5 Bcf/d (2024) |
| UK decomm. liab. | ~£60bn |
| Global FDI | ~$1.0tn (2023) |
What is included in the product
Detailed Word Document
Explores how Political, Economic, Social, Technological, Environmental, and Legal forces uniquely impact the APA, combining data-driven trends and regional industry context to reveal risks and opportunities. Designed for executives and investors, the analysis includes actionable, forward-looking insights ready for business plans and scenario planning.
Customizable Excel Spreadsheet
A concise APA PESTLE summary, visually segmented by category, streamlines external risk assessment for quick inclusion in presentations or planning sessions, is editable for local context, and easily shareable across teams and client reports.
Economic factors
Commodity price cycles
Oil and gas price volatility drives revenues, cash flow, and capex flexibility — Brent averaged about $85/barrel in 2024, amplifying year‑on‑year cash swings for producers.
Hedging smooths near‑term cash but caps upside: many majors hedged >30% of 2024 volumes, protecting budgets while foregoing windfalls.
Supply‑demand balances, OPEC+ voluntary cuts and shifting LNG flows tightened realizations through 2024–25, keeping spot spikes possible.
Strict capital discipline and deferment of noncore capex proved essential in down cycles to preserve liquidity and ratings.
Inflation and costs
Service inflation has outpaced general inflation, with U.S. CPI averaging 3.4% in 2024 (BLS), raising drilling, completion and labor expenses and squeezing well-level margins. Steel, frac sand and equipment supply constraints have repeatedly forced schedule delays and higher unit costs, materially affecting well economics. Index-linked contracts and inflation escalators can stabilize margins by passing costs through to customers. Sustained productivity gains must exceed cost creep to preserve returns.
Exchange rates
Movements in the Egyptian pound (EGP) — which depreciated roughly 50% versus the USD after the 2022–23 float — and the British pound (GBP ~1.25 USD in mid‑2024) raise local costs when reporting in USD and compress margins. Currency controls in Egypt have periodically delayed cash repatriation, extending collection cycles by weeks to months. Active hedging (forwards/options) reduces earnings volatility, while natural hedges emerge when local revenues match local costs.
Capital markets access
Capital markets access hinges on interest rates and credit spreads: the US 10-year Treasury near 4.2% (July 2025) and IG spreads roughly 150–200 bps set refinancing and debt costs; equity valuations determine acquisition currency and investment capacity; investor demand for free cash flow and returns drives payout and buyback policies; firms with strong balance sheets face lower cyclicality and refinancing risk.
- Rates: US 10y ≈ 4.2% (Jul 2025)
- Spreads: IG ≈ 150–200 bps
- Equity value → acquisition currency
- FCF focus → payout/buybacks
- Strong balance sheets = lower cycle risk
Energy transition demand
Gas and LNG are positioned as bridge fuels in power generation, with global LNG trade reaching about 390 Mt in 2023, supporting near-term power flexibility; long-run oil demand uncertainty (IEA net-zero pathways project steep declines over coming decades) compresses terminal-value assumptions; CCUS commercial capacity reached roughly 47 MtCO2/year by 2024, creating potential revenue/incentive streams; portfolios must align with diverging regional demand trajectories (Asia growth, OECD transition).
- Bridge fuel: LNG ~390 Mt (2023)
- Oil risk: IEA net-zero scenarios lower long-term demand
- CCUS: ~47 MtCO2/year capacity (2024)
- Strategy: regional demand alignment (Asia vs OECD)
Political risk reshapes energy investment: Egypt, UK fiscal terms and US IRA shift project economics
Brent ≈ $85/bbl (2024) drove cash/price volatility; majors hedged >30% of 2024 volumes, limiting upside. US 10y ≈ 4.2% (Jul 2025) and IG spreads ~150–200bps shaped financing costs; U.S. CPI ~3.4% (2024) raised service costs. LNG trade ~390 Mt (2023) supports near-term demand; EGP ≈ -50% vs USD since 2022–23 float, increasing FX risk.
| Metric | Value |
|---|---|
| Brent 2024 | $85/bbl |
| US 10y (Jul 2025) | 4.2% |
| LNG 2023 | 390 Mt |
Preview the Actual Deliverable
APA PESTLE Analysis
The APA PESTLE Analysis preview shown here is the exact, fully formatted document you’ll receive after purchase—professionally structured and ready to use. No placeholders or teasers: the content, layout, and citations visible are the final file you’ll download immediately after checkout.
Original: $10.00
-65%$10.00
$3.50Description
Your Competitive Advantage Starts with This Report
Discover how political, economic, social, technological, legal, and environmental forces are reshaping APA’s future in our concise PESTLE Analysis—designed for investors, strategists, and advisors. Download the full report for in-depth insights, actionable risks and opportunities, and editable charts ready for immediate use.
Political factors
Geopolitics in Egypt
Operations in Egypt face exposure to regional security and policy shifts; production-sharing terms and state partner priorities can change with administrations. Stability improves project continuity, while unrest can disrupt logistics and permitting. Proactive stakeholder engagement mitigates volatility. Egypt has about 110 million people (2024) and IMF 2024 GDP growth around 3.5%, underscoring political-economic sensitivity.
US energy policy
Federal leasing and permitting timelines—often multi-year—plus incentives from the Inflation Reduction Act (about $369 billion for clean energy) shape drilling cadence and capital allocation; federal offshore areas accounted for roughly 15% of US crude production in 2022. Shifts between pro-development and climate-forward agendas alter access and compliance costs, while pipeline and LNG export approvals (US capacity ~12.5 Bcf/d in 2024) determine realized pricing. Policy predictability is critical for long-cycle investments and reserve development planning.
UK North Sea stance
Windfall taxes and tighter licensing in the UK North Sea—exemplified by the Energy Profits Levy introduced in 2022—have materially squeezed operator cash flows and reinvestment capacity. Decommissioning reliefs and allowances, with estimated UK decommissioning liabilities near £60 billion, can offset fiscal drag if well designed. Political pressure to meet the 2050 net-zero target may tighten standards and operating costs over time. Stable fiscal and licensing rules reduce reserve and abandonment risk and support continued production (~1.1 mbpd).
International relations
International relations shape equipment sourcing and sales through sanctions, trade rules and currency controls that raise costs and restrict markets; UNCTAD noted global FDI weakened to roughly $1.0 trillion in 2023, slowing cross-border deals and JV approvals into 2024–25. Diplomatic ties determine dispute-resolution access and enforcement; lengthy cross-border approvals can delay project startups, so diversifying supply chains reduces exposure and operational risk.
- Sanctions/trade rules: restrict markets and inputs
- Currency controls: affect repatriation and pricing
- Diplomatic ties: influence dispute resolution
- JV approvals: can delay projects
- Diversify supply chains: lowers geopolitical risk
Local content and community
- Mandates: 20–40% local content (2024)
- Social spend: 1–3% capex
- Risks: permit delays, protests
Political risk reshapes energy investment: Egypt, UK fiscal terms and US IRA shift project economics
Political risk alters access, costs and timelines: Egypt (110m, 2024; IMF GDP ~3.5% 2024) and UK (production ~1.1 mbpd) show how fiscal terms, permits and net-zero targets shift investment; US federal leasing, IRA (~$369bn) and LNG capacity (~12.5 Bcf/d 2024) change project economics. Sanctions/FDI drag (UNCTAD FDI ~$1.0tn 2023) and local content (20–40%) raise supply-chain and social costs (1–3% capex).
| Metric | Value (year) |
|---|---|
| Egypt population | 110m (2024) |
| IMF GDP growth Egypt | ~3.5% (2024) |
| IRA funding | $369bn |
| US LNG cap. | ~12.5 Bcf/d (2024) |
| UK decomm. liab. | ~£60bn |
| Global FDI | ~$1.0tn (2023) |
What is included in the product
Detailed Word Document
Explores how Political, Economic, Social, Technological, Environmental, and Legal forces uniquely impact the APA, combining data-driven trends and regional industry context to reveal risks and opportunities. Designed for executives and investors, the analysis includes actionable, forward-looking insights ready for business plans and scenario planning.
Customizable Excel Spreadsheet
A concise APA PESTLE summary, visually segmented by category, streamlines external risk assessment for quick inclusion in presentations or planning sessions, is editable for local context, and easily shareable across teams and client reports.
Economic factors
Commodity price cycles
Oil and gas price volatility drives revenues, cash flow, and capex flexibility — Brent averaged about $85/barrel in 2024, amplifying year‑on‑year cash swings for producers.
Hedging smooths near‑term cash but caps upside: many majors hedged >30% of 2024 volumes, protecting budgets while foregoing windfalls.
Supply‑demand balances, OPEC+ voluntary cuts and shifting LNG flows tightened realizations through 2024–25, keeping spot spikes possible.
Strict capital discipline and deferment of noncore capex proved essential in down cycles to preserve liquidity and ratings.
Inflation and costs
Service inflation has outpaced general inflation, with U.S. CPI averaging 3.4% in 2024 (BLS), raising drilling, completion and labor expenses and squeezing well-level margins. Steel, frac sand and equipment supply constraints have repeatedly forced schedule delays and higher unit costs, materially affecting well economics. Index-linked contracts and inflation escalators can stabilize margins by passing costs through to customers. Sustained productivity gains must exceed cost creep to preserve returns.
Exchange rates
Movements in the Egyptian pound (EGP) — which depreciated roughly 50% versus the USD after the 2022–23 float — and the British pound (GBP ~1.25 USD in mid‑2024) raise local costs when reporting in USD and compress margins. Currency controls in Egypt have periodically delayed cash repatriation, extending collection cycles by weeks to months. Active hedging (forwards/options) reduces earnings volatility, while natural hedges emerge when local revenues match local costs.
Capital markets access
Capital markets access hinges on interest rates and credit spreads: the US 10-year Treasury near 4.2% (July 2025) and IG spreads roughly 150–200 bps set refinancing and debt costs; equity valuations determine acquisition currency and investment capacity; investor demand for free cash flow and returns drives payout and buyback policies; firms with strong balance sheets face lower cyclicality and refinancing risk.
- Rates: US 10y ≈ 4.2% (Jul 2025)
- Spreads: IG ≈ 150–200 bps
- Equity value → acquisition currency
- FCF focus → payout/buybacks
- Strong balance sheets = lower cycle risk
Energy transition demand
Gas and LNG are positioned as bridge fuels in power generation, with global LNG trade reaching about 390 Mt in 2023, supporting near-term power flexibility; long-run oil demand uncertainty (IEA net-zero pathways project steep declines over coming decades) compresses terminal-value assumptions; CCUS commercial capacity reached roughly 47 MtCO2/year by 2024, creating potential revenue/incentive streams; portfolios must align with diverging regional demand trajectories (Asia growth, OECD transition).
- Bridge fuel: LNG ~390 Mt (2023)
- Oil risk: IEA net-zero scenarios lower long-term demand
- CCUS: ~47 MtCO2/year capacity (2024)
- Strategy: regional demand alignment (Asia vs OECD)
Political risk reshapes energy investment: Egypt, UK fiscal terms and US IRA shift project economics
Brent ≈ $85/bbl (2024) drove cash/price volatility; majors hedged >30% of 2024 volumes, limiting upside. US 10y ≈ 4.2% (Jul 2025) and IG spreads ~150–200bps shaped financing costs; U.S. CPI ~3.4% (2024) raised service costs. LNG trade ~390 Mt (2023) supports near-term demand; EGP ≈ -50% vs USD since 2022–23 float, increasing FX risk.
| Metric | Value |
|---|---|
| Brent 2024 | $85/bbl |
| US 10y (Jul 2025) | 4.2% |
| LNG 2023 | 390 Mt |
Preview the Actual Deliverable
APA PESTLE Analysis
The APA PESTLE Analysis preview shown here is the exact, fully formatted document you’ll receive after purchase—professionally structured and ready to use. No placeholders or teasers: the content, layout, and citations visible are the final file you’ll download immediately after checkout.











