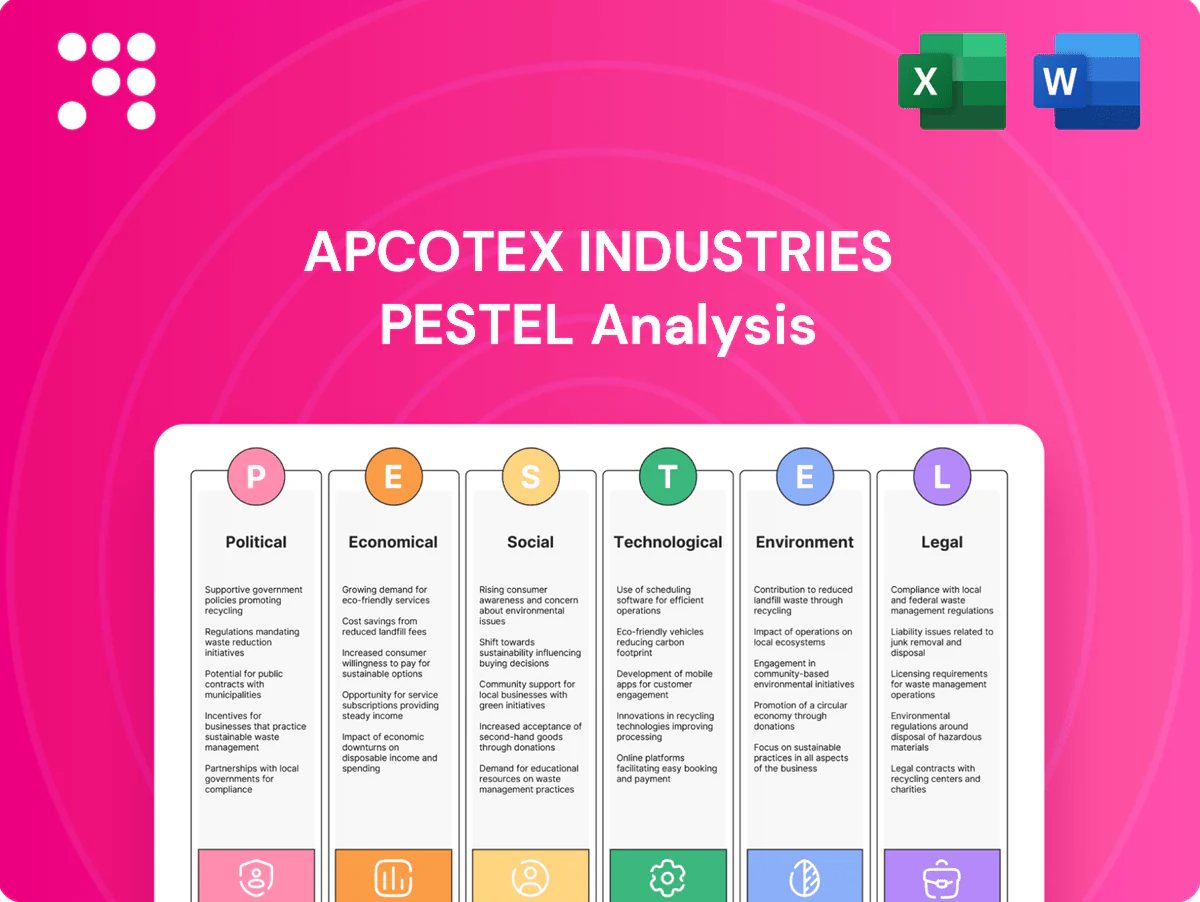
Apcotex Industries PESTLE Analysis

Make Smarter Strategic Decisions with a Complete PESTEL View
Unlock how political shifts, economic cycles, social trends, technological advances, legal changes, and environmental pressures uniquely affect Apcotex Industries in our concise PESTLE snapshot; arm your strategy with context. Ideal for investors and strategists seeking quick, actionable intelligence. Buy the full PESTLE now for the complete, editable breakdown and data-driven recommendations.
Political factors

Industrial policy support
India’s industrial policy for chemicals shapes approvals, land and utilities access for latex plants, with the chemical sector estimated at about US$178 billion in 2024 and many inputs facing 18% GST, affecting cash flow. Incentives for import substitution and value-add manufacturing under central and state schemes can improve project IRRs and payback timelines. Close alignment with state industrial development corporations often accelerates expansions via fast-track clearances. Sudden policy shifts on tariffs or subsidies could materially alter cost structures and timelines.
Trade tariffs and import duties
Tariffs on petrochemical feedstocks such as styrene and butadiene and on latex directly raise input costs and squeeze Apcotex’s pricing power; India’s chemical imports were about $36.5bn in FY2023-24, underscoring import dependence. Anti-dumping duties on competing imports can shield margins but risk retaliation and supply disruption. Any FTA or duty rejig (India not in RCEP) alters sourcing economics and export competitiveness, so monitoring DGTR actions is critical.

Infrastructure and logistics
Government capital expenditure of Rs 11.1 lakh crore in 2024–25 on ports, rail and highways strengthens freight reliability for inbound monomers and outbound emulsions, while national GST e-way bill compliance and rollout of multimodal corridors shorten lead times; improved infra cuts transit-linked working capital needs, though port congestion and regulatory bottlenecks still periodically disrupt service levels and delivery predictability.

Energy and petro policy
Political decisions on gas allocation, power tariffs and refinery outputs directly shape Apcotex Industries feedstock and utility availability, altering margins and output scheduling; pricing reforms or subsidy removal materially shift operating costs and competitiveness. Strategic reserves and import diversification policies influence feedstock volatility, while policy continuity supports long-term capacity planning and investment timing.
- Gas allocation impacts feedstock security
- Power tariffs drive manufacturing costs
- Refinery output controls raw material supply
- Strategic reserves reduce short-term volatility
- Policy continuity enables capital planning
Regional governance and stability
State-level environmental clearances, labor enforcement and local levies vary across India’s 28 states and 8 union territories, creating site-specific compliance costs for Apcotex; the 2024 general election (April–May 2024) demonstrated how election cycles can delay approvals and inspections. Political stability and local government relations directly affect social license and community relations around plants; proactive stakeholder engagement and local MOUs reduce the risk of site-level disruptions.
- 28 states, 8 union territories — varied clearance regimes
- April–May 2024 national elections — example of approval slowdowns
- Proactive local engagement and MOUs mitigate operational delays
Tariffs and GST drive chemical input costs; capex boosts logistics; elections risk approval delays
Political decisions on tariffs, GST and import policy materially affect Apcotex’s input costs; India’s chemical sector was ~US$178bn in 2024 with chemical imports of US$36.5bn in FY2023-24. Central/state incentives and Rs 11.1 lakh crore 2024–25 infra capex improve logistics and project economics. State-level clearances (28 states, 8 UTs) and the Apr–May 2024 elections show approval slowdowns risk.
| Factor | Impact | Key metric (2024/25) |
|---|---|---|
| Tariffs/GST | Input cost volatility | 18% common GST on many inputs |
| Infrastructure | Lower transit WIP | Rs 11.1 lakh crore capex |
| Regulatory | Approval delays | 28 states, 8 UTs; Apr–May 2024 elections |
What is included in the product
 Detailed Word Document
Explores how external macro-environmental factors uniquely affect Apcotex Industries across Political, Economic, Social, Technological, Environmental and Legal dimensions; each section is data-backed, region- and industry-specific, and offers forward-looking insights to help executives, consultants and investors identify risks, opportunities and scenario strategies.

 Customizable Excel Spreadsheet
A concise, visually segmented PESTLE summary for Apcotex Industries that clarifies external risks and market drivers at a glance, easily droppable into presentations or shared across teams; editable for regional or business-line notes and formatted for tablets, Excel and print to streamline planning and client reporting.
Economic factors

Feedstock price volatility
Crude-linked monomers such as butadiene, styrene and acrylates drive large variable-cost swings for Apcotex, with feedstock often representing 50–70% of conversion-costs in specialty polymer plants. Brent averaged about 85–90 USD/bbl in 2024, and price spikes can compress margins unless pass-through works. Hedging programs and flexible formulations reduced volatility impact in 2024, while tighter inventory days emerged as a key profit lever.
Currency fluctuations
INR/USD around 83.5 in mid‑2025 affects Apcotex by raising costs of imported feedstocks while improving dollar export realizations. A weaker rupee increases input costs but can aid export revenue if external demand remains steady. Apcotex's export mix provides natural hedges and active FX management helps preserve EBITDA stability.

End-market cycles
Demand from paper, paints, adhesives, construction and textiles tracks GDP, housing and capex cycles—India’s GDP grew 7.2% in FY2024, supporting upcycle demand while industrial slowdowns compress volumes and pricing. Upcycles tighten supply and lift realizations; diversified exposure across end-markets smooths Apcotex’s revenue volatility. Continued application innovation and specialty formulations help defend share during downturns.

Interest rates and liquidity
Capacity and competition
Domestic capacity additions and global imports jointly determine plant utilization and margin spreads; high utilization underpins pricing discipline while overcapacity forces spot discounting. Differentiated grades, technical service and faster delivery reduce price elasticity, and targeted export channels consistently absorb surplus volumes to stabilize net realizations.
- High utilization supports pricing
- Overcapacity → discounting pressure
- Product differentiation reduces price sensitivity
- Export routes absorb surplus
Tariffs and GST drive chemical input costs; capex boosts logistics; elections risk approval delays
Feedstock drives 50–70% of conversion costs; Brent averaged 85–90 USD/bbl in 2024, squeezing margins on spikes. INR/USD ~83.5 in mid‑2025 raises import costs but aids export realizations. India GDP 7.2% in FY2024 supports end‑market demand; higher rates increase working capital and capex pressure.
| Metric | Value |
|---|---|
| Feedstock share of costs | 50–70% |
| Brent (2024 avg) | 85–90 USD/bbl |
| INR/USD (mid‑2025) | ~83.5 |
| India GDP FY2024 | 7.2% |
Preview Before You Purchase
Apcotex Industries PESTLE Analysis
The Apcotex Industries PESTLE Analysis provides a concise review of political, economic, social, technological, legal, and environmental factors affecting the company. The preview shown here is the exact document you’ll receive after purchase—fully formatted and ready to use. It’s actionable, well-structured, and downloadable immediately.

Make Smarter Strategic Decisions with a Complete PESTEL View
Unlock how political shifts, economic cycles, social trends, technological advances, legal changes, and environmental pressures uniquely affect Apcotex Industries in our concise PESTLE snapshot; arm your strategy with context. Ideal for investors and strategists seeking quick, actionable intelligence. Buy the full PESTLE now for the complete, editable breakdown and data-driven recommendations.
Political factors
Industrial policy support
India’s industrial policy for chemicals shapes approvals, land and utilities access for latex plants, with the chemical sector estimated at about US$178 billion in 2024 and many inputs facing 18% GST, affecting cash flow. Incentives for import substitution and value-add manufacturing under central and state schemes can improve project IRRs and payback timelines. Close alignment with state industrial development corporations often accelerates expansions via fast-track clearances. Sudden policy shifts on tariffs or subsidies could materially alter cost structures and timelines.
Trade tariffs and import duties
Tariffs on petrochemical feedstocks such as styrene and butadiene and on latex directly raise input costs and squeeze Apcotex’s pricing power; India’s chemical imports were about $36.5bn in FY2023-24, underscoring import dependence. Anti-dumping duties on competing imports can shield margins but risk retaliation and supply disruption. Any FTA or duty rejig (India not in RCEP) alters sourcing economics and export competitiveness, so monitoring DGTR actions is critical.
Infrastructure and logistics
Government capital expenditure of Rs 11.1 lakh crore in 2024–25 on ports, rail and highways strengthens freight reliability for inbound monomers and outbound emulsions, while national GST e-way bill compliance and rollout of multimodal corridors shorten lead times; improved infra cuts transit-linked working capital needs, though port congestion and regulatory bottlenecks still periodically disrupt service levels and delivery predictability.
Energy and petro policy
Political decisions on gas allocation, power tariffs and refinery outputs directly shape Apcotex Industries feedstock and utility availability, altering margins and output scheduling; pricing reforms or subsidy removal materially shift operating costs and competitiveness. Strategic reserves and import diversification policies influence feedstock volatility, while policy continuity supports long-term capacity planning and investment timing.
- Gas allocation impacts feedstock security
- Power tariffs drive manufacturing costs
- Refinery output controls raw material supply
- Strategic reserves reduce short-term volatility
- Policy continuity enables capital planning
Regional governance and stability
State-level environmental clearances, labor enforcement and local levies vary across India’s 28 states and 8 union territories, creating site-specific compliance costs for Apcotex; the 2024 general election (April–May 2024) demonstrated how election cycles can delay approvals and inspections. Political stability and local government relations directly affect social license and community relations around plants; proactive stakeholder engagement and local MOUs reduce the risk of site-level disruptions.
- 28 states, 8 union territories — varied clearance regimes
- April–May 2024 national elections — example of approval slowdowns
- Proactive local engagement and MOUs mitigate operational delays
Tariffs and GST drive chemical input costs; capex boosts logistics; elections risk approval delays
Political decisions on tariffs, GST and import policy materially affect Apcotex’s input costs; India’s chemical sector was ~US$178bn in 2024 with chemical imports of US$36.5bn in FY2023-24. Central/state incentives and Rs 11.1 lakh crore 2024–25 infra capex improve logistics and project economics. State-level clearances (28 states, 8 UTs) and the Apr–May 2024 elections show approval slowdowns risk.
| Factor | Impact | Key metric (2024/25) |
|---|---|---|
| Tariffs/GST | Input cost volatility | 18% common GST on many inputs |
| Infrastructure | Lower transit WIP | Rs 11.1 lakh crore capex |
| Regulatory | Approval delays | 28 states, 8 UTs; Apr–May 2024 elections |
What is included in the product
Detailed Word Document
Explores how external macro-environmental factors uniquely affect Apcotex Industries across Political, Economic, Social, Technological, Environmental and Legal dimensions; each section is data-backed, region- and industry-specific, and offers forward-looking insights to help executives, consultants and investors identify risks, opportunities and scenario strategies.
Customizable Excel Spreadsheet
A concise, visually segmented PESTLE summary for Apcotex Industries that clarifies external risks and market drivers at a glance, easily droppable into presentations or shared across teams; editable for regional or business-line notes and formatted for tablets, Excel and print to streamline planning and client reporting.
Economic factors
Feedstock price volatility
Crude-linked monomers such as butadiene, styrene and acrylates drive large variable-cost swings for Apcotex, with feedstock often representing 50–70% of conversion-costs in specialty polymer plants. Brent averaged about 85–90 USD/bbl in 2024, and price spikes can compress margins unless pass-through works. Hedging programs and flexible formulations reduced volatility impact in 2024, while tighter inventory days emerged as a key profit lever.
Currency fluctuations
INR/USD around 83.5 in mid‑2025 affects Apcotex by raising costs of imported feedstocks while improving dollar export realizations. A weaker rupee increases input costs but can aid export revenue if external demand remains steady. Apcotex's export mix provides natural hedges and active FX management helps preserve EBITDA stability.
End-market cycles
Demand from paper, paints, adhesives, construction and textiles tracks GDP, housing and capex cycles—India’s GDP grew 7.2% in FY2024, supporting upcycle demand while industrial slowdowns compress volumes and pricing. Upcycles tighten supply and lift realizations; diversified exposure across end-markets smooths Apcotex’s revenue volatility. Continued application innovation and specialty formulations help defend share during downturns.
Interest rates and liquidity
Capacity and competition
Domestic capacity additions and global imports jointly determine plant utilization and margin spreads; high utilization underpins pricing discipline while overcapacity forces spot discounting. Differentiated grades, technical service and faster delivery reduce price elasticity, and targeted export channels consistently absorb surplus volumes to stabilize net realizations.
- High utilization supports pricing
- Overcapacity → discounting pressure
- Product differentiation reduces price sensitivity
- Export routes absorb surplus
Tariffs and GST drive chemical input costs; capex boosts logistics; elections risk approval delays
Feedstock drives 50–70% of conversion costs; Brent averaged 85–90 USD/bbl in 2024, squeezing margins on spikes. INR/USD ~83.5 in mid‑2025 raises import costs but aids export realizations. India GDP 7.2% in FY2024 supports end‑market demand; higher rates increase working capital and capex pressure.
| Metric | Value |
|---|---|
| Feedstock share of costs | 50–70% |
| Brent (2024 avg) | 85–90 USD/bbl |
| INR/USD (mid‑2025) | ~83.5 |
| India GDP FY2024 | 7.2% |
Preview Before You Purchase
Apcotex Industries PESTLE Analysis
The Apcotex Industries PESTLE Analysis provides a concise review of political, economic, social, technological, legal, and environmental factors affecting the company. The preview shown here is the exact document you’ll receive after purchase—fully formatted and ready to use. It’s actionable, well-structured, and downloadable immediately.
Original: $10.00
-65%$10.00
$3.50Description
Make Smarter Strategic Decisions with a Complete PESTEL View
Unlock how political shifts, economic cycles, social trends, technological advances, legal changes, and environmental pressures uniquely affect Apcotex Industries in our concise PESTLE snapshot; arm your strategy with context. Ideal for investors and strategists seeking quick, actionable intelligence. Buy the full PESTLE now for the complete, editable breakdown and data-driven recommendations.
Political factors
Industrial policy support
India’s industrial policy for chemicals shapes approvals, land and utilities access for latex plants, with the chemical sector estimated at about US$178 billion in 2024 and many inputs facing 18% GST, affecting cash flow. Incentives for import substitution and value-add manufacturing under central and state schemes can improve project IRRs and payback timelines. Close alignment with state industrial development corporations often accelerates expansions via fast-track clearances. Sudden policy shifts on tariffs or subsidies could materially alter cost structures and timelines.
Trade tariffs and import duties
Tariffs on petrochemical feedstocks such as styrene and butadiene and on latex directly raise input costs and squeeze Apcotex’s pricing power; India’s chemical imports were about $36.5bn in FY2023-24, underscoring import dependence. Anti-dumping duties on competing imports can shield margins but risk retaliation and supply disruption. Any FTA or duty rejig (India not in RCEP) alters sourcing economics and export competitiveness, so monitoring DGTR actions is critical.
Infrastructure and logistics
Government capital expenditure of Rs 11.1 lakh crore in 2024–25 on ports, rail and highways strengthens freight reliability for inbound monomers and outbound emulsions, while national GST e-way bill compliance and rollout of multimodal corridors shorten lead times; improved infra cuts transit-linked working capital needs, though port congestion and regulatory bottlenecks still periodically disrupt service levels and delivery predictability.
Energy and petro policy
Political decisions on gas allocation, power tariffs and refinery outputs directly shape Apcotex Industries feedstock and utility availability, altering margins and output scheduling; pricing reforms or subsidy removal materially shift operating costs and competitiveness. Strategic reserves and import diversification policies influence feedstock volatility, while policy continuity supports long-term capacity planning and investment timing.
- Gas allocation impacts feedstock security
- Power tariffs drive manufacturing costs
- Refinery output controls raw material supply
- Strategic reserves reduce short-term volatility
- Policy continuity enables capital planning
Regional governance and stability
State-level environmental clearances, labor enforcement and local levies vary across India’s 28 states and 8 union territories, creating site-specific compliance costs for Apcotex; the 2024 general election (April–May 2024) demonstrated how election cycles can delay approvals and inspections. Political stability and local government relations directly affect social license and community relations around plants; proactive stakeholder engagement and local MOUs reduce the risk of site-level disruptions.
- 28 states, 8 union territories — varied clearance regimes
- April–May 2024 national elections — example of approval slowdowns
- Proactive local engagement and MOUs mitigate operational delays
Tariffs and GST drive chemical input costs; capex boosts logistics; elections risk approval delays
Political decisions on tariffs, GST and import policy materially affect Apcotex’s input costs; India’s chemical sector was ~US$178bn in 2024 with chemical imports of US$36.5bn in FY2023-24. Central/state incentives and Rs 11.1 lakh crore 2024–25 infra capex improve logistics and project economics. State-level clearances (28 states, 8 UTs) and the Apr–May 2024 elections show approval slowdowns risk.
| Factor | Impact | Key metric (2024/25) |
|---|---|---|
| Tariffs/GST | Input cost volatility | 18% common GST on many inputs |
| Infrastructure | Lower transit WIP | Rs 11.1 lakh crore capex |
| Regulatory | Approval delays | 28 states, 8 UTs; Apr–May 2024 elections |
What is included in the product
Detailed Word Document
Explores how external macro-environmental factors uniquely affect Apcotex Industries across Political, Economic, Social, Technological, Environmental and Legal dimensions; each section is data-backed, region- and industry-specific, and offers forward-looking insights to help executives, consultants and investors identify risks, opportunities and scenario strategies.
Customizable Excel Spreadsheet
A concise, visually segmented PESTLE summary for Apcotex Industries that clarifies external risks and market drivers at a glance, easily droppable into presentations or shared across teams; editable for regional or business-line notes and formatted for tablets, Excel and print to streamline planning and client reporting.
Economic factors
Feedstock price volatility
Crude-linked monomers such as butadiene, styrene and acrylates drive large variable-cost swings for Apcotex, with feedstock often representing 50–70% of conversion-costs in specialty polymer plants. Brent averaged about 85–90 USD/bbl in 2024, and price spikes can compress margins unless pass-through works. Hedging programs and flexible formulations reduced volatility impact in 2024, while tighter inventory days emerged as a key profit lever.
Currency fluctuations
INR/USD around 83.5 in mid‑2025 affects Apcotex by raising costs of imported feedstocks while improving dollar export realizations. A weaker rupee increases input costs but can aid export revenue if external demand remains steady. Apcotex's export mix provides natural hedges and active FX management helps preserve EBITDA stability.
End-market cycles
Demand from paper, paints, adhesives, construction and textiles tracks GDP, housing and capex cycles—India’s GDP grew 7.2% in FY2024, supporting upcycle demand while industrial slowdowns compress volumes and pricing. Upcycles tighten supply and lift realizations; diversified exposure across end-markets smooths Apcotex’s revenue volatility. Continued application innovation and specialty formulations help defend share during downturns.
Interest rates and liquidity
Capacity and competition
Domestic capacity additions and global imports jointly determine plant utilization and margin spreads; high utilization underpins pricing discipline while overcapacity forces spot discounting. Differentiated grades, technical service and faster delivery reduce price elasticity, and targeted export channels consistently absorb surplus volumes to stabilize net realizations.
- High utilization supports pricing
- Overcapacity → discounting pressure
- Product differentiation reduces price sensitivity
- Export routes absorb surplus
Tariffs and GST drive chemical input costs; capex boosts logistics; elections risk approval delays
Feedstock drives 50–70% of conversion costs; Brent averaged 85–90 USD/bbl in 2024, squeezing margins on spikes. INR/USD ~83.5 in mid‑2025 raises import costs but aids export realizations. India GDP 7.2% in FY2024 supports end‑market demand; higher rates increase working capital and capex pressure.
| Metric | Value |
|---|---|
| Feedstock share of costs | 50–70% |
| Brent (2024 avg) | 85–90 USD/bbl |
| INR/USD (mid‑2025) | ~83.5 |
| India GDP FY2024 | 7.2% |
Preview Before You Purchase
Apcotex Industries PESTLE Analysis
The Apcotex Industries PESTLE Analysis provides a concise review of political, economic, social, technological, legal, and environmental factors affecting the company. The preview shown here is the exact document you’ll receive after purchase—fully formatted and ready to use. It’s actionable, well-structured, and downloadable immediately.











