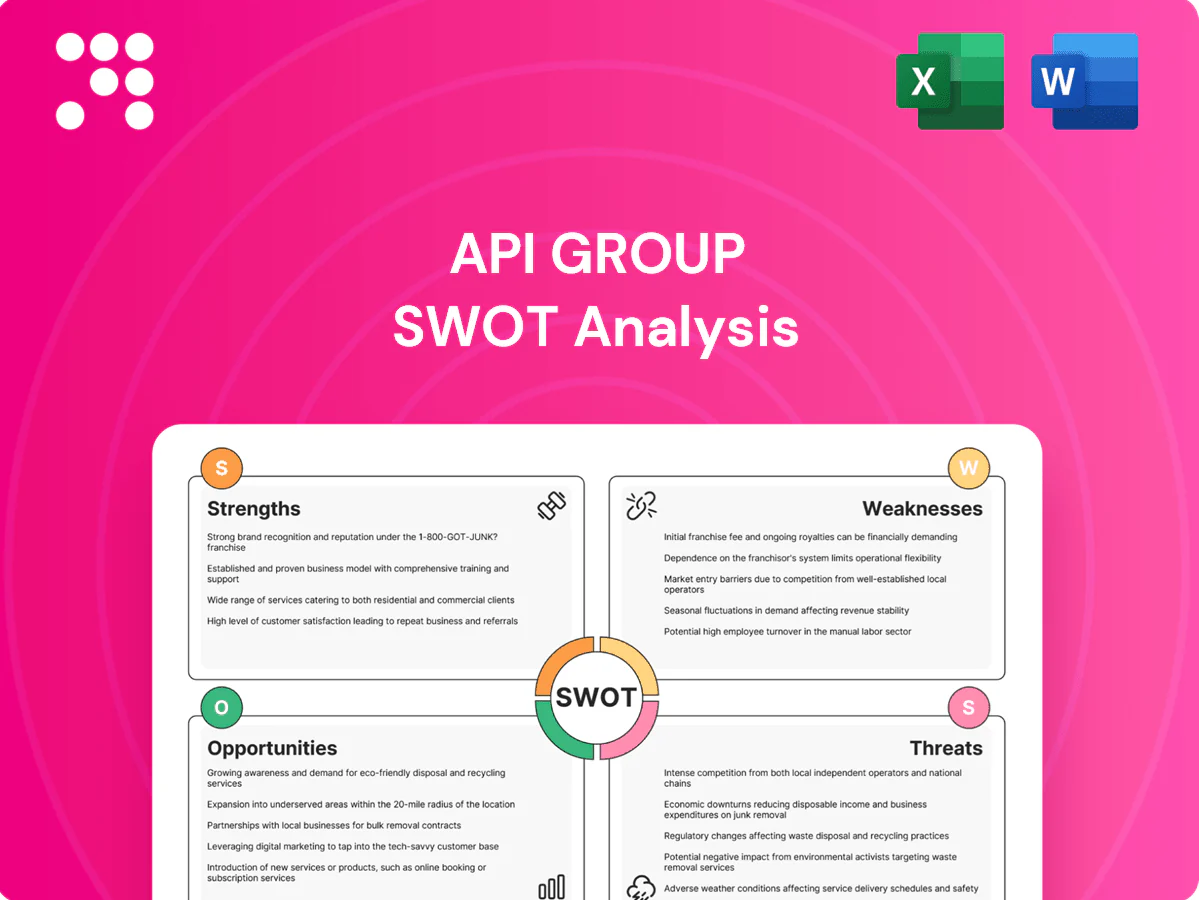
APi Group SWOT Analysis

Your Strategic Toolkit Starts Here
APi Group shows strong recurring revenue from diversified fire protection and specialty services, but heavy leverage and integration risks post-acquisitions could pressure margins; rising construction and infrastructure spending present clear growth opportunities while intense competition and regulatory shifts pose threats. Want the full story behind the company’s strengths, risks, and growth drivers? Purchase the complete SWOT analysis to gain a professionally written, fully editable report for strategy, research, and investment decisions.
Strengths

Diversified services
APi Group spans fire, security, life-safety, infrastructure and industrial services, reducing reliance on any single vertical and enabling cross-selling across a two-segment model that balances resilient service revenue with project-driven specialty work. This diversification helps smooth cyclical exposure and supports integrated, cross-disciplinary solutions, increasing customer stickiness through broader scope coverage.
Recurring compliance revenue
Code-driven inspections, testing and maintenance generate predictable, repeatable demand with annual cycles that create annuity-like streams; APi Group reports a growing services mix that supports stability. Life-safety systems require ongoing compliance, producing renewal rates that underpin recurring revenue and reduce volatility versus project work. These service lines typically deliver materially higher margins—often 10–20 percentage points above new-build projects—and enable follow-on upgrades and retrofits.

Geographic breadth
APi Group (NYSE: APG) maintains operations across North America and Europe, spreading end-market and regulatory risk. Diverse regional exposure lets the business capture local growth cycles and public spending waves while serving large, multi-site customers that require standardized service levels. Scale advantages support improved procurement and flexible labor deployment across markets.

Technical credentials
APi Group's specialized licenses, certifications, and code expertise create high barriers to entry, reinforced by a network of over 200 operating companies. Compliance leadership in fire and life safety builds trust with risk‑averse institutional and public‑sector clients. Technical know‑how enables complex retrofit and mission‑critical projects, supporting premium pricing and lower rework risk.
Cross-selling engine
APi can bundle detection, suppression, security and specialty services to raise share-of-wallet; with FY2023 revenue of $9.7 billion and ~42,000 employees, a large installed base supports upselling of monitoring, maintenance and modernization, and project handovers often convert into multi-year service contracts that increase customer lifetime value.
- Bundling boosts average revenue per customer
- Installed base enables recurring service growth
- Project → multi-year service conversion
- Integrated model elevates CLV
Diversified life-safety services 2023 $9.7B, ~42,000
APi Group leverages diversified fire, security, life‑safety and industrial services with cross‑sell capabilities across >200 operating companies, reducing single‑market risk. Code‑driven testing and maintenance create annuity‑like recurring revenue; FY2023 revenue was $9.7B and the company employs ~42,000, supporting scale and premium pricing. Regional footprint across North America and Europe improves procurement and multi‑site customer retention.
| Metric | Value |
|---|---|
| FY2023 Revenue | $9.7B |
| Employees | ~42,000 |
| Operating companies | >200 |
What is included in the product
 Detailed Word Document
Delivers a strategic overview of APi Group’s internal and external business factors, outlining strengths, weaknesses, opportunities and threats that shape its competitive position. Highlights growth drivers, operational gaps, market risks and strategic priorities to inform investors and management.

 Customizable Excel Spreadsheet
Provides a concise APi Group SWOT matrix for fast, visual alignment of risks and opportunities, helping teams prioritize remediation, resource allocation, and growth initiatives.
Weaknesses

Project volatility
Project volatility in APi Group’s specialty services exposes revenue to timing and mix shifts across construction and industrial projects, with backlog conversion frequently delayed by months due to permitting, funding or customer scheduling; this produces revenue lumpiness and margin variability. Forecasting and capacity planning become more complex, increasing working capital and operational risk for subcontracting and deployment.
Labor intensity
Skilled-trades shortages are acute: an AGC 2024 survey found 89% of contractors had trouble filling hourly craft positions, while the BLS Employment Cost Index rose about 4.2% year-over-year in early 2024, driving wage inflation that pressures delivery and margins. Training, safety, and retention add direct cost and time; utilization dips quickly erode profitability in field-heavy models, and project delays can strand crews and compress bid margins—risks amplified by APi Group’s labor-intensive service mix.

Integration execution
APi Group’s acquisitive growth heightens systems, process, and cultural integration risk, and with roughly 70% of M&A failing to capture planned synergies, realizing cross-brand benefits often requires significant time and capital; integration efforts commonly consume 10–20% of deal value. Missteps can dilute margins or pull management focus, and customer service continuity may suffer during systems transitions.

Construction exposure
Construction exposure leaves APi vulnerable as new-build and large retrofit cycles are highly rate- and sentiment-sensitive; cancellations or scope cuts cascade through subcontractor chains, compressing margins and specialty backlog quality. Higher financing costs—with the federal funds rate around 5.25–5.50% in 2024–mid‑2025—can defer starts and shrink budgets, weakening backlog resilience.
- Developer sentiment risk
- Subcontractor ripple effects
- Higher financing costs (Fed funds ~5.25–5.50%)
- Compressed specialty backlog quality
Limited proprietary IP
As a services-led provider, APi Group’s defensibility depends more on execution and field capability than on proprietary products, leaving it exposed when OEMs dictate technology roadmaps and parts availability. Differentiation thus relies on scale, responsiveness, and deep compliance expertise, while commoditized sub-trades create pricing pressure and margin sensitivity. Limited proprietary IP constrains long-term capture of technology-driven value.
- Execution-dependent defensibility
- OEM control of roadmaps/parts
- Scale & compliance as differentiators
- Pricing pressure in commoditized trades
Margins hit by delays and labor strain: 2–6m, 89%
Project volatility and backlog lumpiness cause revenue/margin swings; permitting and scheduling often delay conversion by 2–6 months. Acute skilled-trade shortages (AGC 2024: 89% reporting hiring difficulty) and ~4.2% wage inflation compress margins. Acquisitive growth raises integration risk (≈70% M&A fail to meet synergies), and Fed funds ~5.25–5.50% dampen starts.
| Metric | Value |
|---|---|
| Backlog delay | 2–6 months |
| AGC hiring issue | 89% |
| Wage inflation (ECI) | ~4.2% |
| M&A synergy shortfall | ≈70% |
| Fed funds | 5.25–5.50% |
Preview Before You Purchase
APi Group SWOT Analysis
This preview of the APi Group SWOT Analysis is taken directly from the full document you'll receive upon purchase; no samples or placeholders. It contains the same professional structure, findings, and editable content included in the downloadable report. Buy now to unlock the complete, in-depth version instantly.

Your Strategic Toolkit Starts Here
APi Group shows strong recurring revenue from diversified fire protection and specialty services, but heavy leverage and integration risks post-acquisitions could pressure margins; rising construction and infrastructure spending present clear growth opportunities while intense competition and regulatory shifts pose threats. Want the full story behind the company’s strengths, risks, and growth drivers? Purchase the complete SWOT analysis to gain a professionally written, fully editable report for strategy, research, and investment decisions.
Strengths
Diversified services
APi Group spans fire, security, life-safety, infrastructure and industrial services, reducing reliance on any single vertical and enabling cross-selling across a two-segment model that balances resilient service revenue with project-driven specialty work. This diversification helps smooth cyclical exposure and supports integrated, cross-disciplinary solutions, increasing customer stickiness through broader scope coverage.
Recurring compliance revenue
Code-driven inspections, testing and maintenance generate predictable, repeatable demand with annual cycles that create annuity-like streams; APi Group reports a growing services mix that supports stability. Life-safety systems require ongoing compliance, producing renewal rates that underpin recurring revenue and reduce volatility versus project work. These service lines typically deliver materially higher margins—often 10–20 percentage points above new-build projects—and enable follow-on upgrades and retrofits.
Geographic breadth
APi Group (NYSE: APG) maintains operations across North America and Europe, spreading end-market and regulatory risk. Diverse regional exposure lets the business capture local growth cycles and public spending waves while serving large, multi-site customers that require standardized service levels. Scale advantages support improved procurement and flexible labor deployment across markets.
Technical credentials
APi Group's specialized licenses, certifications, and code expertise create high barriers to entry, reinforced by a network of over 200 operating companies. Compliance leadership in fire and life safety builds trust with risk‑averse institutional and public‑sector clients. Technical know‑how enables complex retrofit and mission‑critical projects, supporting premium pricing and lower rework risk.
Cross-selling engine
APi can bundle detection, suppression, security and specialty services to raise share-of-wallet; with FY2023 revenue of $9.7 billion and ~42,000 employees, a large installed base supports upselling of monitoring, maintenance and modernization, and project handovers often convert into multi-year service contracts that increase customer lifetime value.
- Bundling boosts average revenue per customer
- Installed base enables recurring service growth
- Project → multi-year service conversion
- Integrated model elevates CLV
Diversified life-safety services 2023 $9.7B, ~42,000
APi Group leverages diversified fire, security, life‑safety and industrial services with cross‑sell capabilities across >200 operating companies, reducing single‑market risk. Code‑driven testing and maintenance create annuity‑like recurring revenue; FY2023 revenue was $9.7B and the company employs ~42,000, supporting scale and premium pricing. Regional footprint across North America and Europe improves procurement and multi‑site customer retention.
| Metric | Value |
|---|---|
| FY2023 Revenue | $9.7B |
| Employees | ~42,000 |
| Operating companies | >200 |
What is included in the product
Detailed Word Document
Delivers a strategic overview of APi Group’s internal and external business factors, outlining strengths, weaknesses, opportunities and threats that shape its competitive position. Highlights growth drivers, operational gaps, market risks and strategic priorities to inform investors and management.
Customizable Excel Spreadsheet
Provides a concise APi Group SWOT matrix for fast, visual alignment of risks and opportunities, helping teams prioritize remediation, resource allocation, and growth initiatives.
Weaknesses
Project volatility
Project volatility in APi Group’s specialty services exposes revenue to timing and mix shifts across construction and industrial projects, with backlog conversion frequently delayed by months due to permitting, funding or customer scheduling; this produces revenue lumpiness and margin variability. Forecasting and capacity planning become more complex, increasing working capital and operational risk for subcontracting and deployment.
Labor intensity
Skilled-trades shortages are acute: an AGC 2024 survey found 89% of contractors had trouble filling hourly craft positions, while the BLS Employment Cost Index rose about 4.2% year-over-year in early 2024, driving wage inflation that pressures delivery and margins. Training, safety, and retention add direct cost and time; utilization dips quickly erode profitability in field-heavy models, and project delays can strand crews and compress bid margins—risks amplified by APi Group’s labor-intensive service mix.
Integration execution
APi Group’s acquisitive growth heightens systems, process, and cultural integration risk, and with roughly 70% of M&A failing to capture planned synergies, realizing cross-brand benefits often requires significant time and capital; integration efforts commonly consume 10–20% of deal value. Missteps can dilute margins or pull management focus, and customer service continuity may suffer during systems transitions.
Construction exposure
Construction exposure leaves APi vulnerable as new-build and large retrofit cycles are highly rate- and sentiment-sensitive; cancellations or scope cuts cascade through subcontractor chains, compressing margins and specialty backlog quality. Higher financing costs—with the federal funds rate around 5.25–5.50% in 2024–mid‑2025—can defer starts and shrink budgets, weakening backlog resilience.
- Developer sentiment risk
- Subcontractor ripple effects
- Higher financing costs (Fed funds ~5.25–5.50%)
- Compressed specialty backlog quality
Limited proprietary IP
As a services-led provider, APi Group’s defensibility depends more on execution and field capability than on proprietary products, leaving it exposed when OEMs dictate technology roadmaps and parts availability. Differentiation thus relies on scale, responsiveness, and deep compliance expertise, while commoditized sub-trades create pricing pressure and margin sensitivity. Limited proprietary IP constrains long-term capture of technology-driven value.
- Execution-dependent defensibility
- OEM control of roadmaps/parts
- Scale & compliance as differentiators
- Pricing pressure in commoditized trades
Margins hit by delays and labor strain: 2–6m, 89%
Project volatility and backlog lumpiness cause revenue/margin swings; permitting and scheduling often delay conversion by 2–6 months. Acute skilled-trade shortages (AGC 2024: 89% reporting hiring difficulty) and ~4.2% wage inflation compress margins. Acquisitive growth raises integration risk (≈70% M&A fail to meet synergies), and Fed funds ~5.25–5.50% dampen starts.
| Metric | Value |
|---|---|
| Backlog delay | 2–6 months |
| AGC hiring issue | 89% |
| Wage inflation (ECI) | ~4.2% |
| M&A synergy shortfall | ≈70% |
| Fed funds | 5.25–5.50% |
Preview Before You Purchase
APi Group SWOT Analysis
This preview of the APi Group SWOT Analysis is taken directly from the full document you'll receive upon purchase; no samples or placeholders. It contains the same professional structure, findings, and editable content included in the downloadable report. Buy now to unlock the complete, in-depth version instantly.
Original: $10.00
-65%$10.00
$3.50Description
Your Strategic Toolkit Starts Here
APi Group shows strong recurring revenue from diversified fire protection and specialty services, but heavy leverage and integration risks post-acquisitions could pressure margins; rising construction and infrastructure spending present clear growth opportunities while intense competition and regulatory shifts pose threats. Want the full story behind the company’s strengths, risks, and growth drivers? Purchase the complete SWOT analysis to gain a professionally written, fully editable report for strategy, research, and investment decisions.
Strengths
Diversified services
APi Group spans fire, security, life-safety, infrastructure and industrial services, reducing reliance on any single vertical and enabling cross-selling across a two-segment model that balances resilient service revenue with project-driven specialty work. This diversification helps smooth cyclical exposure and supports integrated, cross-disciplinary solutions, increasing customer stickiness through broader scope coverage.
Recurring compliance revenue
Code-driven inspections, testing and maintenance generate predictable, repeatable demand with annual cycles that create annuity-like streams; APi Group reports a growing services mix that supports stability. Life-safety systems require ongoing compliance, producing renewal rates that underpin recurring revenue and reduce volatility versus project work. These service lines typically deliver materially higher margins—often 10–20 percentage points above new-build projects—and enable follow-on upgrades and retrofits.
Geographic breadth
APi Group (NYSE: APG) maintains operations across North America and Europe, spreading end-market and regulatory risk. Diverse regional exposure lets the business capture local growth cycles and public spending waves while serving large, multi-site customers that require standardized service levels. Scale advantages support improved procurement and flexible labor deployment across markets.
Technical credentials
APi Group's specialized licenses, certifications, and code expertise create high barriers to entry, reinforced by a network of over 200 operating companies. Compliance leadership in fire and life safety builds trust with risk‑averse institutional and public‑sector clients. Technical know‑how enables complex retrofit and mission‑critical projects, supporting premium pricing and lower rework risk.
Cross-selling engine
APi can bundle detection, suppression, security and specialty services to raise share-of-wallet; with FY2023 revenue of $9.7 billion and ~42,000 employees, a large installed base supports upselling of monitoring, maintenance and modernization, and project handovers often convert into multi-year service contracts that increase customer lifetime value.
- Bundling boosts average revenue per customer
- Installed base enables recurring service growth
- Project → multi-year service conversion
- Integrated model elevates CLV
Diversified life-safety services 2023 $9.7B, ~42,000
APi Group leverages diversified fire, security, life‑safety and industrial services with cross‑sell capabilities across >200 operating companies, reducing single‑market risk. Code‑driven testing and maintenance create annuity‑like recurring revenue; FY2023 revenue was $9.7B and the company employs ~42,000, supporting scale and premium pricing. Regional footprint across North America and Europe improves procurement and multi‑site customer retention.
| Metric | Value |
|---|---|
| FY2023 Revenue | $9.7B |
| Employees | ~42,000 |
| Operating companies | >200 |
What is included in the product
Detailed Word Document
Delivers a strategic overview of APi Group’s internal and external business factors, outlining strengths, weaknesses, opportunities and threats that shape its competitive position. Highlights growth drivers, operational gaps, market risks and strategic priorities to inform investors and management.
Customizable Excel Spreadsheet
Provides a concise APi Group SWOT matrix for fast, visual alignment of risks and opportunities, helping teams prioritize remediation, resource allocation, and growth initiatives.
Weaknesses
Project volatility
Project volatility in APi Group’s specialty services exposes revenue to timing and mix shifts across construction and industrial projects, with backlog conversion frequently delayed by months due to permitting, funding or customer scheduling; this produces revenue lumpiness and margin variability. Forecasting and capacity planning become more complex, increasing working capital and operational risk for subcontracting and deployment.
Labor intensity
Skilled-trades shortages are acute: an AGC 2024 survey found 89% of contractors had trouble filling hourly craft positions, while the BLS Employment Cost Index rose about 4.2% year-over-year in early 2024, driving wage inflation that pressures delivery and margins. Training, safety, and retention add direct cost and time; utilization dips quickly erode profitability in field-heavy models, and project delays can strand crews and compress bid margins—risks amplified by APi Group’s labor-intensive service mix.
Integration execution
APi Group’s acquisitive growth heightens systems, process, and cultural integration risk, and with roughly 70% of M&A failing to capture planned synergies, realizing cross-brand benefits often requires significant time and capital; integration efforts commonly consume 10–20% of deal value. Missteps can dilute margins or pull management focus, and customer service continuity may suffer during systems transitions.
Construction exposure
Construction exposure leaves APi vulnerable as new-build and large retrofit cycles are highly rate- and sentiment-sensitive; cancellations or scope cuts cascade through subcontractor chains, compressing margins and specialty backlog quality. Higher financing costs—with the federal funds rate around 5.25–5.50% in 2024–mid‑2025—can defer starts and shrink budgets, weakening backlog resilience.
- Developer sentiment risk
- Subcontractor ripple effects
- Higher financing costs (Fed funds ~5.25–5.50%)
- Compressed specialty backlog quality
Limited proprietary IP
As a services-led provider, APi Group’s defensibility depends more on execution and field capability than on proprietary products, leaving it exposed when OEMs dictate technology roadmaps and parts availability. Differentiation thus relies on scale, responsiveness, and deep compliance expertise, while commoditized sub-trades create pricing pressure and margin sensitivity. Limited proprietary IP constrains long-term capture of technology-driven value.
- Execution-dependent defensibility
- OEM control of roadmaps/parts
- Scale & compliance as differentiators
- Pricing pressure in commoditized trades
Margins hit by delays and labor strain: 2–6m, 89%
Project volatility and backlog lumpiness cause revenue/margin swings; permitting and scheduling often delay conversion by 2–6 months. Acute skilled-trade shortages (AGC 2024: 89% reporting hiring difficulty) and ~4.2% wage inflation compress margins. Acquisitive growth raises integration risk (≈70% M&A fail to meet synergies), and Fed funds ~5.25–5.50% dampen starts.
| Metric | Value |
|---|---|
| Backlog delay | 2–6 months |
| AGC hiring issue | 89% |
| Wage inflation (ECI) | ~4.2% |
| M&A synergy shortfall | ≈70% |
| Fed funds | 5.25–5.50% |
Preview Before You Purchase
APi Group SWOT Analysis
This preview of the APi Group SWOT Analysis is taken directly from the full document you'll receive upon purchase; no samples or placeholders. It contains the same professional structure, findings, and editable content included in the downloadable report. Buy now to unlock the complete, in-depth version instantly.











