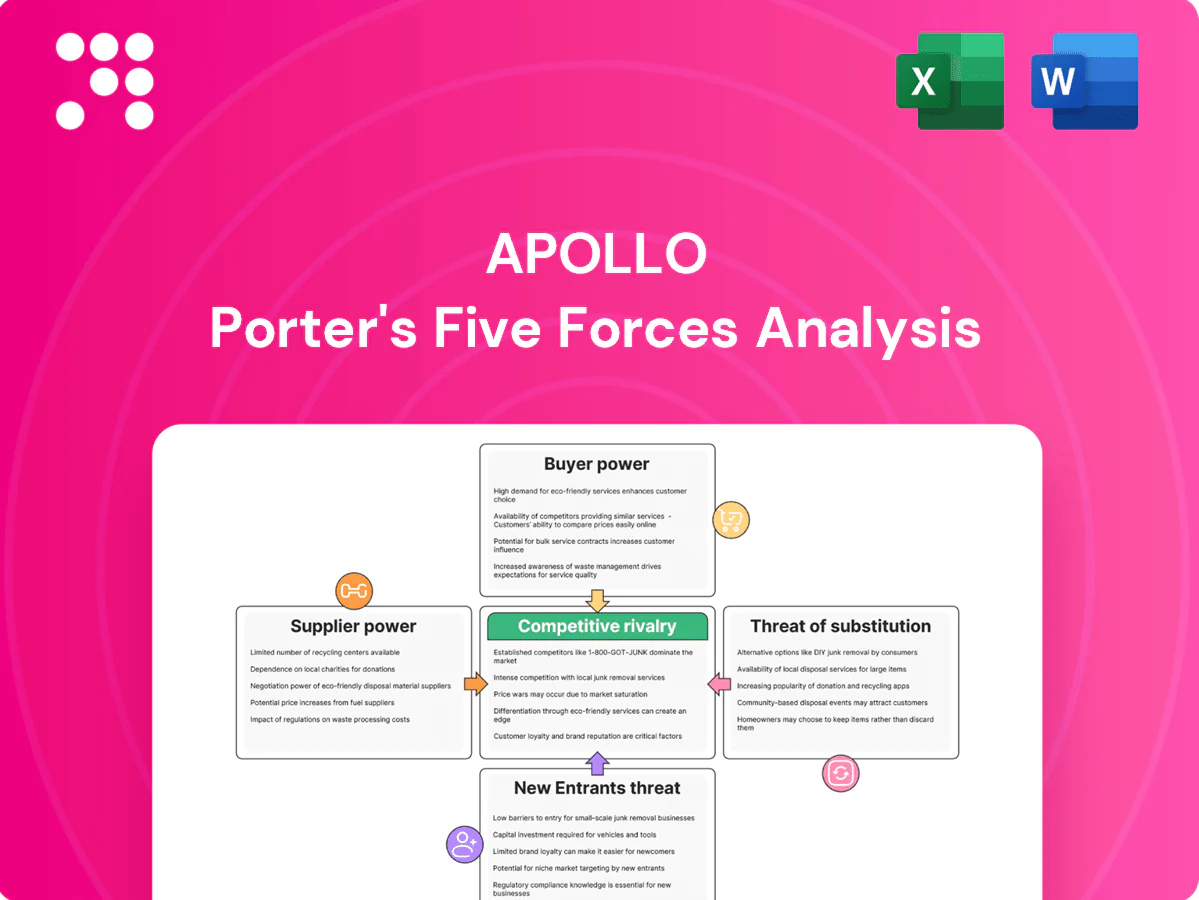
Apollo Porter's Five Forces Analysis

Go Beyond the Preview—Access the Full Strategic Report
Apollo’s Porter's Five Forces snapshot highlights competitive intensity, supplier and buyer power, substitute threats, and barriers to entry—revealing where margins and strategic risks lie. This brief overview teases force-by-force dynamics and key market pressures that shape Apollo’s positioning. The full report delivers consultant-grade ratings, visuals, and actionable implications. Unlock the complete analysis to inform investment or strategic decisions.
Suppliers Bargaining Power

Concentrated talent pool
Apollo depends on a concentrated, mobile pool of investment professionals whose scarcity gives suppliers outsized leverage; top-quartile teams routinely command premium compensation and favorable deal terms, raising retention risk in hot credit and private equity verticals. The firm mitigates this through culture, carried interest, equity alignment and other incentive structures that tie key talent to long-term performance.
Dependence on deal flow intermediaries
Investment banks, brokers and advisors channel proprietary deal flow and often prioritize fee-rich or relationship-driven sponsors in tight cycles. Apollo's scale—hundreds of billions in AUM in 2024—and high repeat business reduce but do not eliminate intermediary dependence. Building direct-sourcing engines and corporate relationships increases proprietary origination to counter intermediary leverage.

Financing counterparties’ clout
Access to leverage from banks, insurers, and capital markets is a critical input for private equity and private credit; with the fed funds rate at 5.25–5.50% in 2024, credit cost and availability directly affect deal economics. When markets tighten, lenders impose tighter covenants, higher spreads, and stricter structures. Apollo’s permanent capital and insurance affiliates strengthen its negotiating position, but macro liquidity cycles still periodically swing bargaining power back to financing providers.

Data and technology vendors
Alternative managers rely on specialized data, risk systems and valuation tools where major providers (Bloomberg holds roughly one-third of the terminal market) can raise prices or restrict licenses because switching costs and integration complexity are high. Apollo’s scale permits enterprise pricing and multi-vendor procurement to limit lock-in, while internal analytics and proprietary datasets further dilute supplier leverage.
- High dependency: specialized platforms
- Market concentration: Bloomberg ≈33% terminal share
- Apollo mitigation: enterprise contracts + multi-vendor
- Internal data reduces long-term vendor power
Regulatory and rating gatekeepers
Regulatory and rating gatekeepers determine which Apollo products qualify for distribution through licenses, compliance standards, and ratings, shaping eligibility and investor access; 2024 rule changes around fund disclosure and solvency raised short-term supplier power. Regulators and rating agencies indirectly influence Apollo’s capital costs and product design through compliance burdens and rating-linked funding spreads. Apollo’s compliance infrastructure reduces onboarding friction but cannot fully neutralize rule shifts that alter product economics.
- Licenses: affect market access and distribution
- Compliance: raises operational costs and time-to-market
- Ratings: influence funding spreads and investor demand
- 2024 policy shifts: temporarily increased supplier leverage
Talent scarcity, intermediaries and data concentration amplify retention and fee risk
Apollo faces high supplier power from scarce senior investment talent, intermediary banks/brokers, financing providers and niche data vendors, with talent premiums and intermediary preference raising retention and fee risk.
Scale (hundreds of billions AUM in 2024) plus permanent capital and in‑house analytics mitigate but do not eliminate cyclical supplier leverage amid 5.25–5.50% fed funds (2024).
| Supplier | Metric |
|---|---|
| Talent | High scarcity—premium pay |
| Data vendors | Bloomberg ≈33% terminal share |
| Financing | Fed funds 5.25–5.50% (2024) |
What is included in the product
 Detailed Word Document
Tailored Porter's Five Forces analysis for Apollo that uncovers competitive drivers, supplier and buyer power, entry barriers, substitutes, and disruptive threats, with strategic commentary and industry data; fully editable Word format for use in investor materials, strategy decks, business plans, or academic projects.

 Customizable Excel Spreadsheet
Apollo Porter's Five Forces delivers a clean one-sheet summary with customizable pressure levels and an instant spider chart—no macros, ready for decks and dashboards.
Customers Bargaining Power

Sophisticated institutional LPs
Pensions, sovereigns and endowments bring deep in-house due diligence and routinely negotiate fees, co-invest rights and bespoke mandates. Apollo’s performance and platform—over $500 billion AUM in 2024—offer counter-leverage but do not erase LP bargaining power. Result: blended fee pressure persists as scale benefits are increasingly shared with large LPs.
Growth of SMAs and co-invest
Large allocators increasingly favor separately managed accounts and fee-light co-investments; in 2024 many LP programs pushed for direct co-invests with 0–1% management fees and reduced carry to cut costs. These structures boost LP control and lower effective fee loads, forcing Apollo to accept concessions to win mandates. Apollo gains larger, stickier commitments but sees buyer power rise and profitability mixed yet scalable.

Performance transparency and benchmarking
Robust benchmarks and consultant oversight sharpen pricing discipline as LPs demand transparent IRR, PME and DPI comparisons; industry consultants report median GP fee renegotiations up 15% since 2018. Underperformance triggers re-ups cuts or manager churn, with LPs citing track record in 34‑year-old Apollo (founded 1990) and over $500bn AUM when defending pricing. Still, fee pressure intensifies when peers post superior vintage outcomes.

Switching costs and lock-ups
Closed-end funds impose 3–7 year lock-ups that delay LP switching and blunt immediate buyer power, but scheduled re-up cycles and pacing plans restore LP leverage over subsequent vintages.
Deepening secondaries liquidity by 2024 has increased LP flexibility to access cash or adjust exposure between fund cycles.
Apollo must deliver consistent DPI and repeatable value creation to secure re-ups and long-term LP commitment.
- lock-ups: 3–7 years
- re-up cycles: restore leverage over vintages
- secondaries: greater liquidity by 2024
- key metric: DPI & value creation drive re-ups
Diversified client segments
Large LPs force 0-1% co-invest fees; renegotiations +15% since 2018
Large LPs (pensions, sovereigns, endowments) exert strong bargaining power—pushing co-invests with 0–1% fees, renegotiations up ~15% since 2018, and demanding transparent PME/DPI. Apollo’s >$500bn AUM in 2024 gives negotiating leverage but does not eliminate fee pressure; lock‑ups (3–7 yrs) and secondaries liquidity moderate switching. Re‑ups hinge on DPI/value creation.
| Metric | 2024 |
|---|---|
| AUM | $500bn+ |
| Fee concessions | Co‑invests 0–1% |
| Renegotiations | +15% since 2018 |
What You See Is What You Get
Apollo Porter's Five Forces Analysis
This preview shows the exact Apollo Porter's Five Forces Analysis you'll receive upon purchase—no placeholders or samples. The file displayed is fully formatted and ready to download the moment you buy. You're getting the same professional, final document shown here, prepared for immediate use.

Go Beyond the Preview—Access the Full Strategic Report
Apollo’s Porter's Five Forces snapshot highlights competitive intensity, supplier and buyer power, substitute threats, and barriers to entry—revealing where margins and strategic risks lie. This brief overview teases force-by-force dynamics and key market pressures that shape Apollo’s positioning. The full report delivers consultant-grade ratings, visuals, and actionable implications. Unlock the complete analysis to inform investment or strategic decisions.
Suppliers Bargaining Power
Concentrated talent pool
Apollo depends on a concentrated, mobile pool of investment professionals whose scarcity gives suppliers outsized leverage; top-quartile teams routinely command premium compensation and favorable deal terms, raising retention risk in hot credit and private equity verticals. The firm mitigates this through culture, carried interest, equity alignment and other incentive structures that tie key talent to long-term performance.
Dependence on deal flow intermediaries
Investment banks, brokers and advisors channel proprietary deal flow and often prioritize fee-rich or relationship-driven sponsors in tight cycles. Apollo's scale—hundreds of billions in AUM in 2024—and high repeat business reduce but do not eliminate intermediary dependence. Building direct-sourcing engines and corporate relationships increases proprietary origination to counter intermediary leverage.
Financing counterparties’ clout
Access to leverage from banks, insurers, and capital markets is a critical input for private equity and private credit; with the fed funds rate at 5.25–5.50% in 2024, credit cost and availability directly affect deal economics. When markets tighten, lenders impose tighter covenants, higher spreads, and stricter structures. Apollo’s permanent capital and insurance affiliates strengthen its negotiating position, but macro liquidity cycles still periodically swing bargaining power back to financing providers.
Data and technology vendors
Alternative managers rely on specialized data, risk systems and valuation tools where major providers (Bloomberg holds roughly one-third of the terminal market) can raise prices or restrict licenses because switching costs and integration complexity are high. Apollo’s scale permits enterprise pricing and multi-vendor procurement to limit lock-in, while internal analytics and proprietary datasets further dilute supplier leverage.
- High dependency: specialized platforms
- Market concentration: Bloomberg ≈33% terminal share
- Apollo mitigation: enterprise contracts + multi-vendor
- Internal data reduces long-term vendor power
Regulatory and rating gatekeepers
Regulatory and rating gatekeepers determine which Apollo products qualify for distribution through licenses, compliance standards, and ratings, shaping eligibility and investor access; 2024 rule changes around fund disclosure and solvency raised short-term supplier power. Regulators and rating agencies indirectly influence Apollo’s capital costs and product design through compliance burdens and rating-linked funding spreads. Apollo’s compliance infrastructure reduces onboarding friction but cannot fully neutralize rule shifts that alter product economics.
- Licenses: affect market access and distribution
- Compliance: raises operational costs and time-to-market
- Ratings: influence funding spreads and investor demand
- 2024 policy shifts: temporarily increased supplier leverage
Talent scarcity, intermediaries and data concentration amplify retention and fee risk
Apollo faces high supplier power from scarce senior investment talent, intermediary banks/brokers, financing providers and niche data vendors, with talent premiums and intermediary preference raising retention and fee risk.
Scale (hundreds of billions AUM in 2024) plus permanent capital and in‑house analytics mitigate but do not eliminate cyclical supplier leverage amid 5.25–5.50% fed funds (2024).
| Supplier | Metric |
|---|---|
| Talent | High scarcity—premium pay |
| Data vendors | Bloomberg ≈33% terminal share |
| Financing | Fed funds 5.25–5.50% (2024) |
What is included in the product
Detailed Word Document
Tailored Porter's Five Forces analysis for Apollo that uncovers competitive drivers, supplier and buyer power, entry barriers, substitutes, and disruptive threats, with strategic commentary and industry data; fully editable Word format for use in investor materials, strategy decks, business plans, or academic projects.
Customizable Excel Spreadsheet
Apollo Porter's Five Forces delivers a clean one-sheet summary with customizable pressure levels and an instant spider chart—no macros, ready for decks and dashboards.
Customers Bargaining Power
Sophisticated institutional LPs
Pensions, sovereigns and endowments bring deep in-house due diligence and routinely negotiate fees, co-invest rights and bespoke mandates. Apollo’s performance and platform—over $500 billion AUM in 2024—offer counter-leverage but do not erase LP bargaining power. Result: blended fee pressure persists as scale benefits are increasingly shared with large LPs.
Growth of SMAs and co-invest
Large allocators increasingly favor separately managed accounts and fee-light co-investments; in 2024 many LP programs pushed for direct co-invests with 0–1% management fees and reduced carry to cut costs. These structures boost LP control and lower effective fee loads, forcing Apollo to accept concessions to win mandates. Apollo gains larger, stickier commitments but sees buyer power rise and profitability mixed yet scalable.
Performance transparency and benchmarking
Robust benchmarks and consultant oversight sharpen pricing discipline as LPs demand transparent IRR, PME and DPI comparisons; industry consultants report median GP fee renegotiations up 15% since 2018. Underperformance triggers re-ups cuts or manager churn, with LPs citing track record in 34‑year-old Apollo (founded 1990) and over $500bn AUM when defending pricing. Still, fee pressure intensifies when peers post superior vintage outcomes.
Switching costs and lock-ups
Closed-end funds impose 3–7 year lock-ups that delay LP switching and blunt immediate buyer power, but scheduled re-up cycles and pacing plans restore LP leverage over subsequent vintages.
Deepening secondaries liquidity by 2024 has increased LP flexibility to access cash or adjust exposure between fund cycles.
Apollo must deliver consistent DPI and repeatable value creation to secure re-ups and long-term LP commitment.
- lock-ups: 3–7 years
- re-up cycles: restore leverage over vintages
- secondaries: greater liquidity by 2024
- key metric: DPI & value creation drive re-ups
Diversified client segments
Large LPs force 0-1% co-invest fees; renegotiations +15% since 2018
Large LPs (pensions, sovereigns, endowments) exert strong bargaining power—pushing co-invests with 0–1% fees, renegotiations up ~15% since 2018, and demanding transparent PME/DPI. Apollo’s >$500bn AUM in 2024 gives negotiating leverage but does not eliminate fee pressure; lock‑ups (3–7 yrs) and secondaries liquidity moderate switching. Re‑ups hinge on DPI/value creation.
| Metric | 2024 |
|---|---|
| AUM | $500bn+ |
| Fee concessions | Co‑invests 0–1% |
| Renegotiations | +15% since 2018 |
What You See Is What You Get
Apollo Porter's Five Forces Analysis
This preview shows the exact Apollo Porter's Five Forces Analysis you'll receive upon purchase—no placeholders or samples. The file displayed is fully formatted and ready to download the moment you buy. You're getting the same professional, final document shown here, prepared for immediate use.
Description
Go Beyond the Preview—Access the Full Strategic Report
Apollo’s Porter's Five Forces snapshot highlights competitive intensity, supplier and buyer power, substitute threats, and barriers to entry—revealing where margins and strategic risks lie. This brief overview teases force-by-force dynamics and key market pressures that shape Apollo’s positioning. The full report delivers consultant-grade ratings, visuals, and actionable implications. Unlock the complete analysis to inform investment or strategic decisions.
Suppliers Bargaining Power
Concentrated talent pool
Apollo depends on a concentrated, mobile pool of investment professionals whose scarcity gives suppliers outsized leverage; top-quartile teams routinely command premium compensation and favorable deal terms, raising retention risk in hot credit and private equity verticals. The firm mitigates this through culture, carried interest, equity alignment and other incentive structures that tie key talent to long-term performance.
Dependence on deal flow intermediaries
Investment banks, brokers and advisors channel proprietary deal flow and often prioritize fee-rich or relationship-driven sponsors in tight cycles. Apollo's scale—hundreds of billions in AUM in 2024—and high repeat business reduce but do not eliminate intermediary dependence. Building direct-sourcing engines and corporate relationships increases proprietary origination to counter intermediary leverage.
Financing counterparties’ clout
Access to leverage from banks, insurers, and capital markets is a critical input for private equity and private credit; with the fed funds rate at 5.25–5.50% in 2024, credit cost and availability directly affect deal economics. When markets tighten, lenders impose tighter covenants, higher spreads, and stricter structures. Apollo’s permanent capital and insurance affiliates strengthen its negotiating position, but macro liquidity cycles still periodically swing bargaining power back to financing providers.
Data and technology vendors
Alternative managers rely on specialized data, risk systems and valuation tools where major providers (Bloomberg holds roughly one-third of the terminal market) can raise prices or restrict licenses because switching costs and integration complexity are high. Apollo’s scale permits enterprise pricing and multi-vendor procurement to limit lock-in, while internal analytics and proprietary datasets further dilute supplier leverage.
- High dependency: specialized platforms
- Market concentration: Bloomberg ≈33% terminal share
- Apollo mitigation: enterprise contracts + multi-vendor
- Internal data reduces long-term vendor power
Regulatory and rating gatekeepers
Regulatory and rating gatekeepers determine which Apollo products qualify for distribution through licenses, compliance standards, and ratings, shaping eligibility and investor access; 2024 rule changes around fund disclosure and solvency raised short-term supplier power. Regulators and rating agencies indirectly influence Apollo’s capital costs and product design through compliance burdens and rating-linked funding spreads. Apollo’s compliance infrastructure reduces onboarding friction but cannot fully neutralize rule shifts that alter product economics.
- Licenses: affect market access and distribution
- Compliance: raises operational costs and time-to-market
- Ratings: influence funding spreads and investor demand
- 2024 policy shifts: temporarily increased supplier leverage
Talent scarcity, intermediaries and data concentration amplify retention and fee risk
Apollo faces high supplier power from scarce senior investment talent, intermediary banks/brokers, financing providers and niche data vendors, with talent premiums and intermediary preference raising retention and fee risk.
Scale (hundreds of billions AUM in 2024) plus permanent capital and in‑house analytics mitigate but do not eliminate cyclical supplier leverage amid 5.25–5.50% fed funds (2024).
| Supplier | Metric |
|---|---|
| Talent | High scarcity—premium pay |
| Data vendors | Bloomberg ≈33% terminal share |
| Financing | Fed funds 5.25–5.50% (2024) |
What is included in the product
Detailed Word Document
Tailored Porter's Five Forces analysis for Apollo that uncovers competitive drivers, supplier and buyer power, entry barriers, substitutes, and disruptive threats, with strategic commentary and industry data; fully editable Word format for use in investor materials, strategy decks, business plans, or academic projects.
Customizable Excel Spreadsheet
Apollo Porter's Five Forces delivers a clean one-sheet summary with customizable pressure levels and an instant spider chart—no macros, ready for decks and dashboards.
Customers Bargaining Power
Sophisticated institutional LPs
Pensions, sovereigns and endowments bring deep in-house due diligence and routinely negotiate fees, co-invest rights and bespoke mandates. Apollo’s performance and platform—over $500 billion AUM in 2024—offer counter-leverage but do not erase LP bargaining power. Result: blended fee pressure persists as scale benefits are increasingly shared with large LPs.
Growth of SMAs and co-invest
Large allocators increasingly favor separately managed accounts and fee-light co-investments; in 2024 many LP programs pushed for direct co-invests with 0–1% management fees and reduced carry to cut costs. These structures boost LP control and lower effective fee loads, forcing Apollo to accept concessions to win mandates. Apollo gains larger, stickier commitments but sees buyer power rise and profitability mixed yet scalable.
Performance transparency and benchmarking
Robust benchmarks and consultant oversight sharpen pricing discipline as LPs demand transparent IRR, PME and DPI comparisons; industry consultants report median GP fee renegotiations up 15% since 2018. Underperformance triggers re-ups cuts or manager churn, with LPs citing track record in 34‑year-old Apollo (founded 1990) and over $500bn AUM when defending pricing. Still, fee pressure intensifies when peers post superior vintage outcomes.
Switching costs and lock-ups
Closed-end funds impose 3–7 year lock-ups that delay LP switching and blunt immediate buyer power, but scheduled re-up cycles and pacing plans restore LP leverage over subsequent vintages.
Deepening secondaries liquidity by 2024 has increased LP flexibility to access cash or adjust exposure between fund cycles.
Apollo must deliver consistent DPI and repeatable value creation to secure re-ups and long-term LP commitment.
- lock-ups: 3–7 years
- re-up cycles: restore leverage over vintages
- secondaries: greater liquidity by 2024
- key metric: DPI & value creation drive re-ups
Diversified client segments
Large LPs force 0-1% co-invest fees; renegotiations +15% since 2018
Large LPs (pensions, sovereigns, endowments) exert strong bargaining power—pushing co-invests with 0–1% fees, renegotiations up ~15% since 2018, and demanding transparent PME/DPI. Apollo’s >$500bn AUM in 2024 gives negotiating leverage but does not eliminate fee pressure; lock‑ups (3–7 yrs) and secondaries liquidity moderate switching. Re‑ups hinge on DPI/value creation.
| Metric | 2024 |
|---|---|
| AUM | $500bn+ |
| Fee concessions | Co‑invests 0–1% |
| Renegotiations | +15% since 2018 |
What You See Is What You Get
Apollo Porter's Five Forces Analysis
This preview shows the exact Apollo Porter's Five Forces Analysis you'll receive upon purchase—no placeholders or samples. The file displayed is fully formatted and ready to download the moment you buy. You're getting the same professional, final document shown here, prepared for immediate use.











