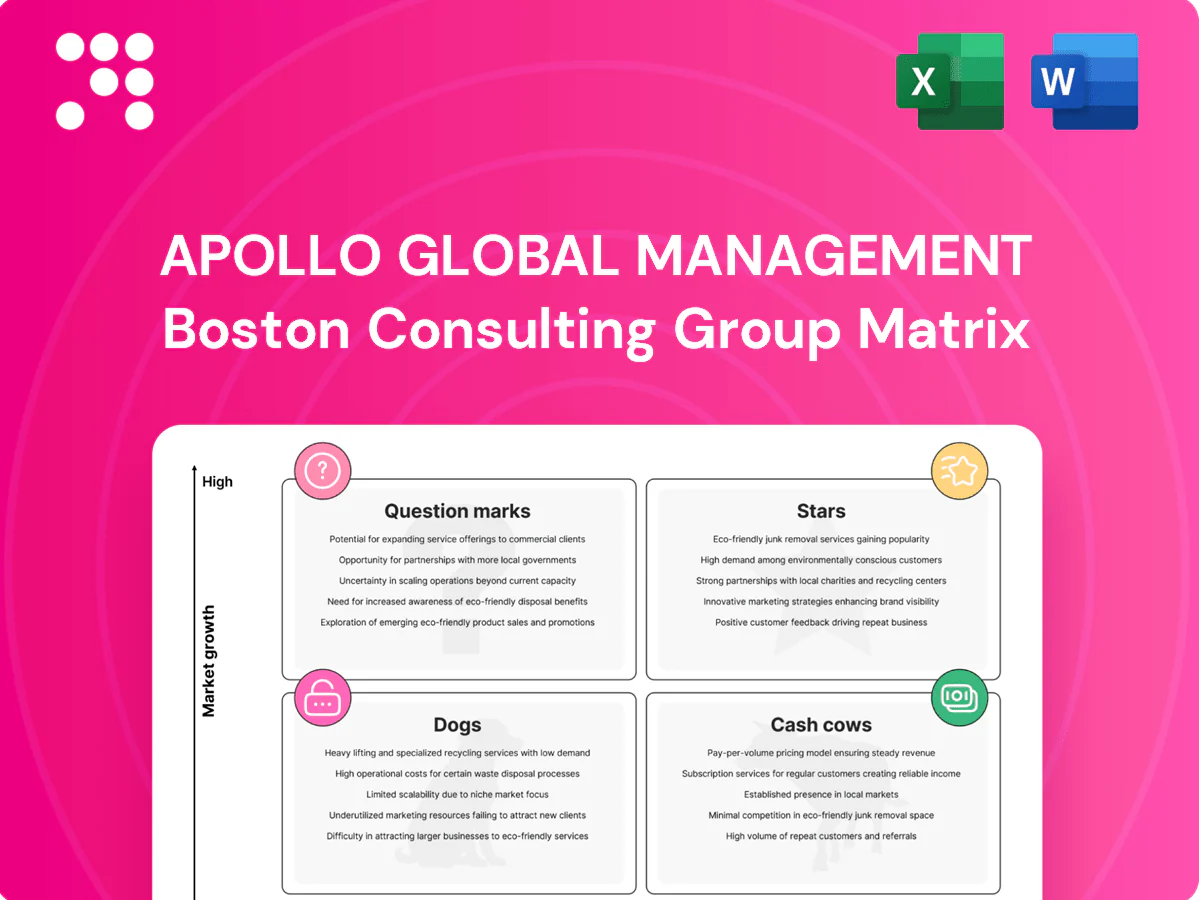
Apollo Global Management Boston Consulting Group Matrix

Unlock Strategic Clarity
Apollo Global Management’s BCG Matrix gives you a sharp snapshot of which assets are fueling growth, which are steady cash generators, and which may be dragging on returns—no fluff, just clarity. This preview teases the quadrant placements; the full report maps every business line into Stars, Cash Cows, Dogs, or Question Marks with supporting data and strategy. Purchase the complete BCG Matrix to get a Word report plus an Excel summary, actionable recommendations, and a clear capital-allocation roadmap you can use right away.
Stars

Global Private Credit Platform
Apollo’s private credit engine sits in a fast-growing market—private credit AUM reached roughly 1.5 trillion by 2023—so it leads and continues to attract capital for origination and distribution. Bank retrenchment has compounded demand, keeping a robust pipeline for yield-focused investors. Maintain brand, sourcing, and underwriting talent to protect share. If credit spreads compress, the platform can glide into cash-cow territory.
Flagship Private Equity Strategies
Scaled flagship buyout funds, often sized at or above $10 billion, give Apollo market leadership in sectors like financial services and energy where PE remains expansionary in 2024. They generate proprietary deal flow and influence but require constant promotion, heavy fundraising muscle, and active portfolio support. At this growth clip, cash in roughly equals cash out—maintain pace now to mint tomorrow’s cash cows.

Real Assets & Infrastructure Growth
Infrastructure and real assets are riding secular tailwinds—reindustrialization, data and logistics—while Apollo, with roughly $559 billion AUM in 2024, has the footprint to win larger, stickier mandates in these critical assets. Winning still requires heavy lifting: origination, regulatory work and meaningful capex commitments often spanning years. Invest through the noise to lock in category leadership where scale and execution drive persistent fee pools.

Capital Solutions & Strategic Resource Platform
Capital Solutions & Strategic Resource Platform combines capital with hands-on ops support, driving higher win rates and pricing power in bespoke 2024 deals; the unit backed over $25bn of tailored financings in 2024, but remains resource-intensive given expanded ops teams and data stacks.
- Scale playbooks, ops experts, data
- Higher win rates → pricing power
- Resource-heavy buildout
- Durable market share as segment matures
Institutional Relationships Flywheel
Deep ties with pensions, endowments, and sovereigns give Apollo a high-share position in a growing allocator base; in 2024 Apollo managed over 500 billion dollars in AUM, supporting scale and repeat allocations. It still needs constant engagement, transparency, and new-product education to retain allocations. The flywheel funds and seeds new vehicles—stay close, stay credible, and compounding continues.
- Deep institutional ties
- Over 500 billion AUM (2024)
- Ongoing engagement & transparency
- Flywheel seeds new vehicles
- Credibility drives compounding
Private credit & scaled buyouts: $1.5T, $559B scale
Apollo’s private credit and scaled buyouts are Stars: private credit benefits from a $1.5T market (2023) and Apollo’s $559B AUM (2024), driving rapid fee growth and market share. Infrastructure and Capital Solutions show high growth and investment intensity, requiring heavy origination and ops. If growth sustains, these convert to future cash cows.
| Segment | 2024 metric | Implication |
|---|---|---|
| Private credit | Market $1.5T; Apollo scale | High growth |
| Buyouts/Infra | $559B AUM | Leadership, investment-heavy |
What is included in the product
 Detailed Word Document
BCG Matrix analysis of Apollo’s units: identifies Stars, Cash Cows, Question Marks, Dogs and recommends invest, hold or divest actions.

 Customizable Excel Spreadsheet
One-page Apollo BCG Matrix placing each business unit in a quadrant to simplify strategy and investor presentations
Cash Cows

Seasoned PE Portfolios (Harvest Mode)
Seasoned PE portfolios in harvest mode at Apollo generate strong carried interest and management fees while requiring minimal incremental capital, supported by Apollo managing over $500 billion in AUM as of 2024. The market is steady, not sprinting, creating a predictable cash-yield profile that funds distributions and opportunistic deployments. These reliable flows bankroll new growth bets while disciplined exits and tight cost control preserve and expand margins.
Long-Dated Credit Income Strategies
Long-dated credit income strategies deliver stable, contracted cash flows and, with Apollo holding over $500 billion AUM in 2024, translate to predictable fee revenue. Growth is modest but margins remain attractive; promotion needs are low beyond renewals and upsizing. Focus on milking consistency while tightening risk controls and servicing costs.

Core Real Assets With Contracted Cash Flows
Operational real assets under long-term contracts spin off dependable cash for Apollo; the firm reported total AUM of $592 billion as of June 30, 2024, with core real assets delivering steady distributable cash. The market is mature, so upside is driven by incremental efficiency and yield enhancement. Prioritize investment in asset management systems and O&M to squeeze more yield. These contracted vehicles fund corporate needs without drama.

Established Separate Accounts & SMAs
Established separate accounts and SMAs at Apollo serve large institutional clients with clear mandates, generating recurring management fees and low churn. Customization is fixed and servicing streamlined, yielding high retention despite low growth. Preserve the annuity with disciplined pricing and high service levels; Apollo manages over 500 billion AUM as of 2024.
- Recurring fees, low churn
- Customization set; streamlined servicing
- Low growth, high retention
- Pricing discipline to protect annuity
Management Fee Base From Legacy AUM
Management fee base from legacy AUM—Apollo reported approximately $565 billion AUM as of June 30, 2024—generates recurring fees independent of fundraising cycles; fixed cost base means strong operating leverage, letting fees cover overhead and fund seed innovation; prioritize performance and reporting excellence to defend against fee compression.
- Legacy AUM: $565bn (6/30/2024)
- Stable fee runoff
- High operating leverage
- Use excess to fund innovation
- Mitigate fee pressure via performance & reporting
Harvested portfolios deliver steady distributable cash and fund new investments — AUM 592 billion
Seasoned harvest portfolios and long-dated credit with contracted real assets produce predictable distributable cash and high fee visibility, funding carry and new investments; Apollo reported total AUM of $592 billion as of June 30, 2024. Low incremental capital needs and high retention make these true cash cows requiring disciplined pricing and cost control.
| Metric | Value/Note |
|---|---|
| AUM (6/30/2024) | $592 billion |
| Growth | Low |
| Role | Fund distributions & new bets |
Full Transparency, Always
Apollo Global Management BCG Matrix
The file you're previewing here is the exact Apollo Global Management BCG Matrix you'll receive after purchase. No watermarks, no placeholders—just the fully formatted, analysis-ready report crafted for decision-making. Once bought, the full document is yours to download, edit, print, or present. Fast, professional, and exactly as shown—no surprises.

Unlock Strategic Clarity
Apollo Global Management’s BCG Matrix gives you a sharp snapshot of which assets are fueling growth, which are steady cash generators, and which may be dragging on returns—no fluff, just clarity. This preview teases the quadrant placements; the full report maps every business line into Stars, Cash Cows, Dogs, or Question Marks with supporting data and strategy. Purchase the complete BCG Matrix to get a Word report plus an Excel summary, actionable recommendations, and a clear capital-allocation roadmap you can use right away.
Stars
Global Private Credit Platform
Apollo’s private credit engine sits in a fast-growing market—private credit AUM reached roughly 1.5 trillion by 2023—so it leads and continues to attract capital for origination and distribution. Bank retrenchment has compounded demand, keeping a robust pipeline for yield-focused investors. Maintain brand, sourcing, and underwriting talent to protect share. If credit spreads compress, the platform can glide into cash-cow territory.
Flagship Private Equity Strategies
Scaled flagship buyout funds, often sized at or above $10 billion, give Apollo market leadership in sectors like financial services and energy where PE remains expansionary in 2024. They generate proprietary deal flow and influence but require constant promotion, heavy fundraising muscle, and active portfolio support. At this growth clip, cash in roughly equals cash out—maintain pace now to mint tomorrow’s cash cows.
Real Assets & Infrastructure Growth
Infrastructure and real assets are riding secular tailwinds—reindustrialization, data and logistics—while Apollo, with roughly $559 billion AUM in 2024, has the footprint to win larger, stickier mandates in these critical assets. Winning still requires heavy lifting: origination, regulatory work and meaningful capex commitments often spanning years. Invest through the noise to lock in category leadership where scale and execution drive persistent fee pools.
Capital Solutions & Strategic Resource Platform
Capital Solutions & Strategic Resource Platform combines capital with hands-on ops support, driving higher win rates and pricing power in bespoke 2024 deals; the unit backed over $25bn of tailored financings in 2024, but remains resource-intensive given expanded ops teams and data stacks.
- Scale playbooks, ops experts, data
- Higher win rates → pricing power
- Resource-heavy buildout
- Durable market share as segment matures
Institutional Relationships Flywheel
Deep ties with pensions, endowments, and sovereigns give Apollo a high-share position in a growing allocator base; in 2024 Apollo managed over 500 billion dollars in AUM, supporting scale and repeat allocations. It still needs constant engagement, transparency, and new-product education to retain allocations. The flywheel funds and seeds new vehicles—stay close, stay credible, and compounding continues.
- Deep institutional ties
- Over 500 billion AUM (2024)
- Ongoing engagement & transparency
- Flywheel seeds new vehicles
- Credibility drives compounding
Private credit & scaled buyouts: $1.5T, $559B scale
Apollo’s private credit and scaled buyouts are Stars: private credit benefits from a $1.5T market (2023) and Apollo’s $559B AUM (2024), driving rapid fee growth and market share. Infrastructure and Capital Solutions show high growth and investment intensity, requiring heavy origination and ops. If growth sustains, these convert to future cash cows.
| Segment | 2024 metric | Implication |
|---|---|---|
| Private credit | Market $1.5T; Apollo scale | High growth |
| Buyouts/Infra | $559B AUM | Leadership, investment-heavy |
What is included in the product
Detailed Word Document
BCG Matrix analysis of Apollo’s units: identifies Stars, Cash Cows, Question Marks, Dogs and recommends invest, hold or divest actions.
Customizable Excel Spreadsheet
One-page Apollo BCG Matrix placing each business unit in a quadrant to simplify strategy and investor presentations
Cash Cows
Seasoned PE Portfolios (Harvest Mode)
Seasoned PE portfolios in harvest mode at Apollo generate strong carried interest and management fees while requiring minimal incremental capital, supported by Apollo managing over $500 billion in AUM as of 2024. The market is steady, not sprinting, creating a predictable cash-yield profile that funds distributions and opportunistic deployments. These reliable flows bankroll new growth bets while disciplined exits and tight cost control preserve and expand margins.
Long-Dated Credit Income Strategies
Long-dated credit income strategies deliver stable, contracted cash flows and, with Apollo holding over $500 billion AUM in 2024, translate to predictable fee revenue. Growth is modest but margins remain attractive; promotion needs are low beyond renewals and upsizing. Focus on milking consistency while tightening risk controls and servicing costs.
Core Real Assets With Contracted Cash Flows
Operational real assets under long-term contracts spin off dependable cash for Apollo; the firm reported total AUM of $592 billion as of June 30, 2024, with core real assets delivering steady distributable cash. The market is mature, so upside is driven by incremental efficiency and yield enhancement. Prioritize investment in asset management systems and O&M to squeeze more yield. These contracted vehicles fund corporate needs without drama.
Established Separate Accounts & SMAs
Established separate accounts and SMAs at Apollo serve large institutional clients with clear mandates, generating recurring management fees and low churn. Customization is fixed and servicing streamlined, yielding high retention despite low growth. Preserve the annuity with disciplined pricing and high service levels; Apollo manages over 500 billion AUM as of 2024.
- Recurring fees, low churn
- Customization set; streamlined servicing
- Low growth, high retention
- Pricing discipline to protect annuity
Management Fee Base From Legacy AUM
Management fee base from legacy AUM—Apollo reported approximately $565 billion AUM as of June 30, 2024—generates recurring fees independent of fundraising cycles; fixed cost base means strong operating leverage, letting fees cover overhead and fund seed innovation; prioritize performance and reporting excellence to defend against fee compression.
- Legacy AUM: $565bn (6/30/2024)
- Stable fee runoff
- High operating leverage
- Use excess to fund innovation
- Mitigate fee pressure via performance & reporting
Harvested portfolios deliver steady distributable cash and fund new investments — AUM 592 billion
Seasoned harvest portfolios and long-dated credit with contracted real assets produce predictable distributable cash and high fee visibility, funding carry and new investments; Apollo reported total AUM of $592 billion as of June 30, 2024. Low incremental capital needs and high retention make these true cash cows requiring disciplined pricing and cost control.
| Metric | Value/Note |
|---|---|
| AUM (6/30/2024) | $592 billion |
| Growth | Low |
| Role | Fund distributions & new bets |
Full Transparency, Always
Apollo Global Management BCG Matrix
The file you're previewing here is the exact Apollo Global Management BCG Matrix you'll receive after purchase. No watermarks, no placeholders—just the fully formatted, analysis-ready report crafted for decision-making. Once bought, the full document is yours to download, edit, print, or present. Fast, professional, and exactly as shown—no surprises.
Description
Unlock Strategic Clarity
Apollo Global Management’s BCG Matrix gives you a sharp snapshot of which assets are fueling growth, which are steady cash generators, and which may be dragging on returns—no fluff, just clarity. This preview teases the quadrant placements; the full report maps every business line into Stars, Cash Cows, Dogs, or Question Marks with supporting data and strategy. Purchase the complete BCG Matrix to get a Word report plus an Excel summary, actionable recommendations, and a clear capital-allocation roadmap you can use right away.
Stars
Global Private Credit Platform
Apollo’s private credit engine sits in a fast-growing market—private credit AUM reached roughly 1.5 trillion by 2023—so it leads and continues to attract capital for origination and distribution. Bank retrenchment has compounded demand, keeping a robust pipeline for yield-focused investors. Maintain brand, sourcing, and underwriting talent to protect share. If credit spreads compress, the platform can glide into cash-cow territory.
Flagship Private Equity Strategies
Scaled flagship buyout funds, often sized at or above $10 billion, give Apollo market leadership in sectors like financial services and energy where PE remains expansionary in 2024. They generate proprietary deal flow and influence but require constant promotion, heavy fundraising muscle, and active portfolio support. At this growth clip, cash in roughly equals cash out—maintain pace now to mint tomorrow’s cash cows.
Real Assets & Infrastructure Growth
Infrastructure and real assets are riding secular tailwinds—reindustrialization, data and logistics—while Apollo, with roughly $559 billion AUM in 2024, has the footprint to win larger, stickier mandates in these critical assets. Winning still requires heavy lifting: origination, regulatory work and meaningful capex commitments often spanning years. Invest through the noise to lock in category leadership where scale and execution drive persistent fee pools.
Capital Solutions & Strategic Resource Platform
Capital Solutions & Strategic Resource Platform combines capital with hands-on ops support, driving higher win rates and pricing power in bespoke 2024 deals; the unit backed over $25bn of tailored financings in 2024, but remains resource-intensive given expanded ops teams and data stacks.
- Scale playbooks, ops experts, data
- Higher win rates → pricing power
- Resource-heavy buildout
- Durable market share as segment matures
Institutional Relationships Flywheel
Deep ties with pensions, endowments, and sovereigns give Apollo a high-share position in a growing allocator base; in 2024 Apollo managed over 500 billion dollars in AUM, supporting scale and repeat allocations. It still needs constant engagement, transparency, and new-product education to retain allocations. The flywheel funds and seeds new vehicles—stay close, stay credible, and compounding continues.
- Deep institutional ties
- Over 500 billion AUM (2024)
- Ongoing engagement & transparency
- Flywheel seeds new vehicles
- Credibility drives compounding
Private credit & scaled buyouts: $1.5T, $559B scale
Apollo’s private credit and scaled buyouts are Stars: private credit benefits from a $1.5T market (2023) and Apollo’s $559B AUM (2024), driving rapid fee growth and market share. Infrastructure and Capital Solutions show high growth and investment intensity, requiring heavy origination and ops. If growth sustains, these convert to future cash cows.
| Segment | 2024 metric | Implication |
|---|---|---|
| Private credit | Market $1.5T; Apollo scale | High growth |
| Buyouts/Infra | $559B AUM | Leadership, investment-heavy |
What is included in the product
Detailed Word Document
BCG Matrix analysis of Apollo’s units: identifies Stars, Cash Cows, Question Marks, Dogs and recommends invest, hold or divest actions.
Customizable Excel Spreadsheet
One-page Apollo BCG Matrix placing each business unit in a quadrant to simplify strategy and investor presentations
Cash Cows
Seasoned PE Portfolios (Harvest Mode)
Seasoned PE portfolios in harvest mode at Apollo generate strong carried interest and management fees while requiring minimal incremental capital, supported by Apollo managing over $500 billion in AUM as of 2024. The market is steady, not sprinting, creating a predictable cash-yield profile that funds distributions and opportunistic deployments. These reliable flows bankroll new growth bets while disciplined exits and tight cost control preserve and expand margins.
Long-Dated Credit Income Strategies
Long-dated credit income strategies deliver stable, contracted cash flows and, with Apollo holding over $500 billion AUM in 2024, translate to predictable fee revenue. Growth is modest but margins remain attractive; promotion needs are low beyond renewals and upsizing. Focus on milking consistency while tightening risk controls and servicing costs.
Core Real Assets With Contracted Cash Flows
Operational real assets under long-term contracts spin off dependable cash for Apollo; the firm reported total AUM of $592 billion as of June 30, 2024, with core real assets delivering steady distributable cash. The market is mature, so upside is driven by incremental efficiency and yield enhancement. Prioritize investment in asset management systems and O&M to squeeze more yield. These contracted vehicles fund corporate needs without drama.
Established Separate Accounts & SMAs
Established separate accounts and SMAs at Apollo serve large institutional clients with clear mandates, generating recurring management fees and low churn. Customization is fixed and servicing streamlined, yielding high retention despite low growth. Preserve the annuity with disciplined pricing and high service levels; Apollo manages over 500 billion AUM as of 2024.
- Recurring fees, low churn
- Customization set; streamlined servicing
- Low growth, high retention
- Pricing discipline to protect annuity
Management Fee Base From Legacy AUM
Management fee base from legacy AUM—Apollo reported approximately $565 billion AUM as of June 30, 2024—generates recurring fees independent of fundraising cycles; fixed cost base means strong operating leverage, letting fees cover overhead and fund seed innovation; prioritize performance and reporting excellence to defend against fee compression.
- Legacy AUM: $565bn (6/30/2024)
- Stable fee runoff
- High operating leverage
- Use excess to fund innovation
- Mitigate fee pressure via performance & reporting
Harvested portfolios deliver steady distributable cash and fund new investments — AUM 592 billion
Seasoned harvest portfolios and long-dated credit with contracted real assets produce predictable distributable cash and high fee visibility, funding carry and new investments; Apollo reported total AUM of $592 billion as of June 30, 2024. Low incremental capital needs and high retention make these true cash cows requiring disciplined pricing and cost control.
| Metric | Value/Note |
|---|---|
| AUM (6/30/2024) | $592 billion |
| Growth | Low |
| Role | Fund distributions & new bets |
Full Transparency, Always
Apollo Global Management BCG Matrix
The file you're previewing here is the exact Apollo Global Management BCG Matrix you'll receive after purchase. No watermarks, no placeholders—just the fully formatted, analysis-ready report crafted for decision-making. Once bought, the full document is yours to download, edit, print, or present. Fast, professional, and exactly as shown—no surprises.











