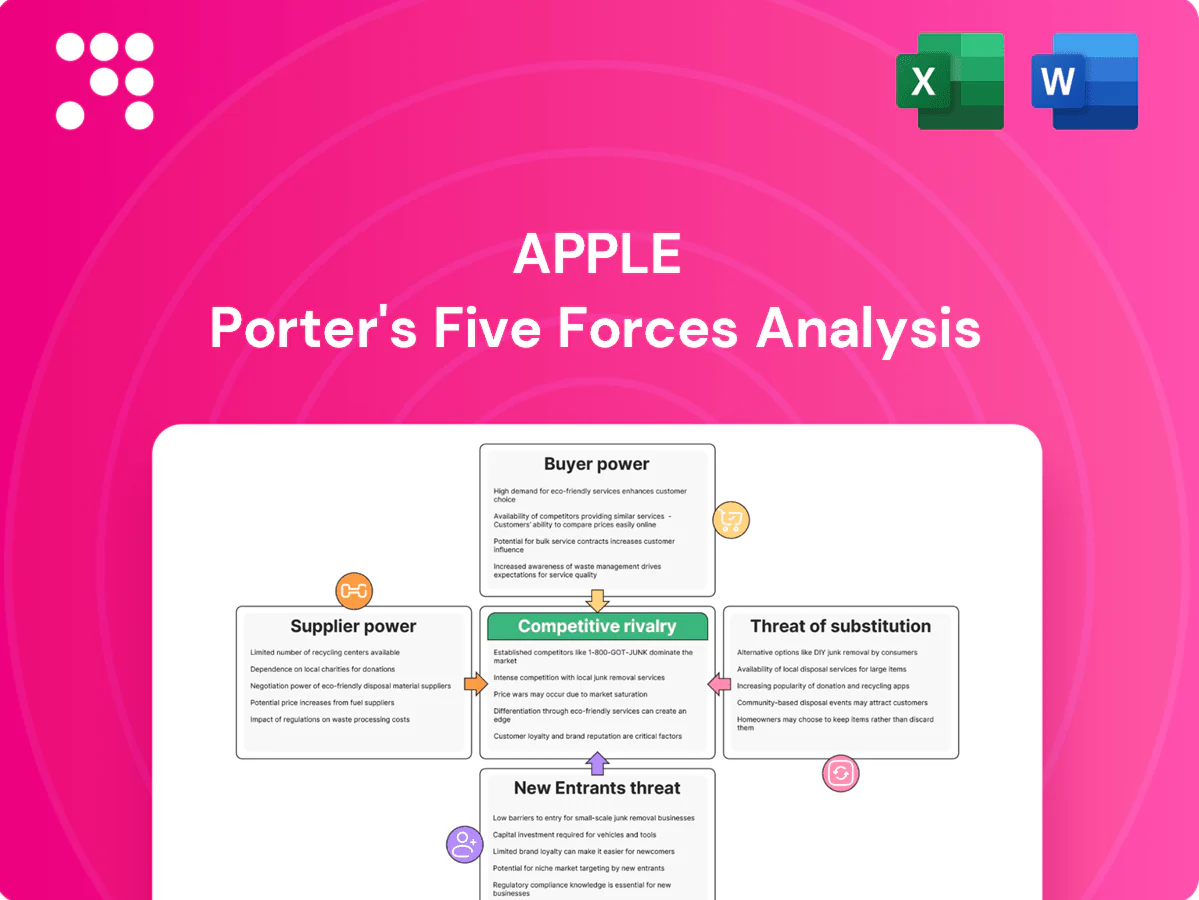
Apple Porter's Five Forces Analysis

From Overview to Strategy Blueprint
Apple's Porter's Five Forces Analysis highlights intense rivalry from global device makers, high buyer expectations, strong supplier influence for key components, significant threat from substitutes in services, and high barriers to entry due to ecosystem scale. This brief snapshot only scratches the surface. Unlock the full Porter's Five Forces Analysis to explore Apple’s competitive dynamics, market pressures, and strategic advantages in detail.
Suppliers Bargaining Power

Concentrated advanced chip and display suppliers
Apple depends on a few advanced-node suppliers—TSMC (which held over 80% of global sub-5nm capacity in 2024) and premium OLED vendors like Samsung Display and LG Display—concentrating supply and giving those partners leverage over capacity allocation and pricing. Apple mitigates this through long-term contracts and prepayments to secure priority capacity and favorable terms. Nonetheless, node scarcity and yield volatility keep supplier power materially non-trivial.
Scale, multi-sourcing, and custom designs temper leverage
Apple’s scale—2 billion active devices and $383.3 billion revenue in FY2024—gives it leverage as it dual-sources commoditized parts and designs proprietary A/M-series silicon, which reduces standard component suppliers’ bargaining power. Proprietary specs shift value capture to Apple and foster vendor competition, while commoditized parts remain easy to switch. Strategic components like advanced displays and sensors stay stickier despite scale.

Vertical integration and IP ownership
Apple’s in-house SoC design (A/M series), OS stack and growing services ecosystem reduce dependence on external tech roadmaps, helping align product timelines and margins; Apple reported FY2024 revenue of about $383.3 billion, enlarging its internal leverage. Control over core IP limits suppliers’ pricing power and differentiation claims, while TSMC remained Apple’s sole advanced-node foundry in 2024 (TSMC 2024 capex ~40 billion USD). Fabrication and advanced packaging still require external partners, so verticalization shifts but does not eliminate supplier leverage.

Geopolitical and materials exposure
Semiconductor clustering in Taiwan (TSMC ≈53% global foundry share in 2024) and concentration of critical materials—China controls roughly 60% of rare-earth processing and the DRC supplies ~70% of mined cobalt—heighten supplier leverage, while export controls and tariffs can quickly tighten flows and increase negotiating power. Apple’s gradual China+1 shift (India/Vietnam raising iPhone assembly to low single-digit–to–low double-digit shares by 2024) only partly mitigates this. Risk premiums already surface in component pricing and stricter contract terms.
- TSMC ≈53% foundry share (2024)
- China ≈60% rare-earth processing; DRC ≈70% cobalt supply
- Apple China+1: India/Vietnam low single–digit to low double–digit iPhone share (2024)
Service/content providers and financial networks
Labels, studios and payment networks wield significant bargaining power over Apple Services: licensing windows and label splits (often 50–55% for music/streaming) plus payment-rail fees (typically 1.5–3%) constrain margins even as Apple Services reached about $89 billion in FY2024.
- Revenue share: labels/studios 50–55%
- App Store cuts: up to 30% (15% for small devs)
- Payment fees: 1.5–3%
- Apple counters with originals, exclusives, Apple Pay scale
Foundry concentration: ≈53% share; sub-5nm >80%; key material risks
Supplier power is material: TSMC held ≈53% foundry share and >80% of sub-5nm capacity in 2024, concentrating advanced-node leverage; Samsung/LG dominate premium OLEDs. Apple scale ($383.3B revenue, 2B devices) and in-house silicon reduce commoditized supplier power, but key materials (China ≈60% rare-earth processing; DRC ≈70% cobalt) and assembly clustering keep risk. Services (≈$89B FY2024) face label/app store splits limiting margin.
| Metric | 2024 Value |
|---|---|
| Apple revenue | $383.3B |
| Active devices | 2B |
| TSMC foundry share | ≈53% |
| Sub-5nm capacity | >80% |
| Services revenue | $89B |
| China rare-earth processing | ≈60% |
| DRC cobalt supply | ≈70% |
What is included in the product
 Detailed Word Document
Comprehensive Porter's Five Forces analysis tailored for Apple, assessing competitive rivalry, supplier and buyer power, threat of substitutes and new entrants, and identifying disruptive forces and strategic barriers that shape its profitability.

 Customizable Excel Spreadsheet
A concise one-sheet Porter's Five Forces for Apple that highlights supplier/buyer power, competitive rivalry and threats of entry/substitutes—ideal for rapid strategic decisions; editable radar chart and clean layout ready to drop into pitch decks, Excel dashboards or board materials.
Customers Bargaining Power

High switching costs via ecosystem lock-in
iMessage, iCloud, App Store purchases and tight device integration create ecosystem lock-in that raises switching costs for users, supported by Apple’s 2.2 billion active devices reported in January 2024. Cross-device continuity (Handoff, Universal Clipboard) and bundled services deepen stickiness and lower price sensitivity. As a result, iPhone churn remains below many Android OEMs, weakening individual buyer bargaining power.
Premium brand reduces price sensitivity
Strong brand equity lets Apple sustain premium pricing—reflected in FY2024 revenue of $383.3B and a gross margin near 44.3%—implying modest demand elasticity. Financing, trade-ins and bundles (e.g., carrier subsidies, Apple Trade In) blur headline price. Macro slowdowns in 2023–24 nudged some buyers to older models, so tiered pricing across SE, standard and Pro lines manages elasticity by segment.

Information-rich market but limited customization leverage
Buyers easily compare specs, reviews and total cost online, pressuring Apple on features and timing, yet Apple reported an active installed base of about 2.2 billion devices in 2024 which reduces churn leverage. Standardized SKUs and a closed iOS/macOS ecosystem limit bespoke demands despite strong customer research capabilities. Refurbished and previous‑gen offerings act as internal substitutes, keeping price resistance muted. Increased transparency lifts expectations more than bargaining power.

Enterprise and education procurement
Institutions negotiating enterprise and education procurement gain modest buyer power by purchasing at scale, pressing on price and deployment terms, while reliance on MDM, security stacks, and lifecycle support increases leverage in feature and service negotiations.
Apple pushes back with deployment tools (Apple Business/School Manager), TCO arguments, and an extensive channel partner network; volume discounts exist but are constrained by deliberate brand pricing discipline and premium positioning.
Multidevice ownership and bundling
Households often buy multiple Apple devices—Apple reported a 2 billion active device installed base in Jan 2024—reducing per-unit bargaining as shared accounts and family sharing lock in spend. Bundles like Apple One and trade-in pathways increase lifetime value and retention, while multi-homing with non-Apple services and ~90% U.S. iPhone loyalty mean some buyer leverage remains; cross-selling lowers churn over time.
- 2 billion active devices (Jan 2024)
- Apple One + trade-ins boost retention
- Multi-homing provides limited leverage
- High iPhone loyalty lowers buyer power
Ecosystem: 2.2B devices, ~90% US loyalty locks consumers
Apple’s ecosystem and 2.2B active devices (Jan 2024) and ~90% US iPhone loyalty raise switching costs, reducing individual buyer power. Premium pricing supported by FY2024 revenue $383.3B and ~44.3% gross margin limits price pressure. Volume purchasers gain moderate leverage via procurement and MDM needs, but volume discounts are capped by brand strategy.
| Metric | Value |
|---|---|
| Active devices (Jan 2024) | 2.2B |
| FY2024 revenue | $383.3B |
| Gross margin | 44.3% |
| US iPhone loyalty | ~90% |
What You See Is What You Get
Apple Porter's Five Forces Analysis
This preview shows the exact Apple Porter’s Five Forces analysis you'll receive—no surprises, no placeholders. The report offers concise evaluation of competitive rivalry, supplier and buyer power, threats of entry and substitution, and strategic implications. It's fully formatted and actionable for decision-making, ready for immediate download after purchase.

From Overview to Strategy Blueprint
Apple's Porter's Five Forces Analysis highlights intense rivalry from global device makers, high buyer expectations, strong supplier influence for key components, significant threat from substitutes in services, and high barriers to entry due to ecosystem scale. This brief snapshot only scratches the surface. Unlock the full Porter's Five Forces Analysis to explore Apple’s competitive dynamics, market pressures, and strategic advantages in detail.
Suppliers Bargaining Power
Concentrated advanced chip and display suppliers
Apple depends on a few advanced-node suppliers—TSMC (which held over 80% of global sub-5nm capacity in 2024) and premium OLED vendors like Samsung Display and LG Display—concentrating supply and giving those partners leverage over capacity allocation and pricing. Apple mitigates this through long-term contracts and prepayments to secure priority capacity and favorable terms. Nonetheless, node scarcity and yield volatility keep supplier power materially non-trivial.
Scale, multi-sourcing, and custom designs temper leverage
Apple’s scale—2 billion active devices and $383.3 billion revenue in FY2024—gives it leverage as it dual-sources commoditized parts and designs proprietary A/M-series silicon, which reduces standard component suppliers’ bargaining power. Proprietary specs shift value capture to Apple and foster vendor competition, while commoditized parts remain easy to switch. Strategic components like advanced displays and sensors stay stickier despite scale.
Vertical integration and IP ownership
Apple’s in-house SoC design (A/M series), OS stack and growing services ecosystem reduce dependence on external tech roadmaps, helping align product timelines and margins; Apple reported FY2024 revenue of about $383.3 billion, enlarging its internal leverage. Control over core IP limits suppliers’ pricing power and differentiation claims, while TSMC remained Apple’s sole advanced-node foundry in 2024 (TSMC 2024 capex ~40 billion USD). Fabrication and advanced packaging still require external partners, so verticalization shifts but does not eliminate supplier leverage.
Geopolitical and materials exposure
Semiconductor clustering in Taiwan (TSMC ≈53% global foundry share in 2024) and concentration of critical materials—China controls roughly 60% of rare-earth processing and the DRC supplies ~70% of mined cobalt—heighten supplier leverage, while export controls and tariffs can quickly tighten flows and increase negotiating power. Apple’s gradual China+1 shift (India/Vietnam raising iPhone assembly to low single-digit–to–low double-digit shares by 2024) only partly mitigates this. Risk premiums already surface in component pricing and stricter contract terms.
- TSMC ≈53% foundry share (2024)
- China ≈60% rare-earth processing; DRC ≈70% cobalt supply
- Apple China+1: India/Vietnam low single–digit to low double–digit iPhone share (2024)
Service/content providers and financial networks
Labels, studios and payment networks wield significant bargaining power over Apple Services: licensing windows and label splits (often 50–55% for music/streaming) plus payment-rail fees (typically 1.5–3%) constrain margins even as Apple Services reached about $89 billion in FY2024.
- Revenue share: labels/studios 50–55%
- App Store cuts: up to 30% (15% for small devs)
- Payment fees: 1.5–3%
- Apple counters with originals, exclusives, Apple Pay scale
Foundry concentration: ≈53% share; sub-5nm >80%; key material risks
Supplier power is material: TSMC held ≈53% foundry share and >80% of sub-5nm capacity in 2024, concentrating advanced-node leverage; Samsung/LG dominate premium OLEDs. Apple scale ($383.3B revenue, 2B devices) and in-house silicon reduce commoditized supplier power, but key materials (China ≈60% rare-earth processing; DRC ≈70% cobalt) and assembly clustering keep risk. Services (≈$89B FY2024) face label/app store splits limiting margin.
| Metric | 2024 Value |
|---|---|
| Apple revenue | $383.3B |
| Active devices | 2B |
| TSMC foundry share | ≈53% |
| Sub-5nm capacity | >80% |
| Services revenue | $89B |
| China rare-earth processing | ≈60% |
| DRC cobalt supply | ≈70% |
What is included in the product
Detailed Word Document
Comprehensive Porter's Five Forces analysis tailored for Apple, assessing competitive rivalry, supplier and buyer power, threat of substitutes and new entrants, and identifying disruptive forces and strategic barriers that shape its profitability.
Customizable Excel Spreadsheet
A concise one-sheet Porter's Five Forces for Apple that highlights supplier/buyer power, competitive rivalry and threats of entry/substitutes—ideal for rapid strategic decisions; editable radar chart and clean layout ready to drop into pitch decks, Excel dashboards or board materials.
Customers Bargaining Power
High switching costs via ecosystem lock-in
iMessage, iCloud, App Store purchases and tight device integration create ecosystem lock-in that raises switching costs for users, supported by Apple’s 2.2 billion active devices reported in January 2024. Cross-device continuity (Handoff, Universal Clipboard) and bundled services deepen stickiness and lower price sensitivity. As a result, iPhone churn remains below many Android OEMs, weakening individual buyer bargaining power.
Premium brand reduces price sensitivity
Strong brand equity lets Apple sustain premium pricing—reflected in FY2024 revenue of $383.3B and a gross margin near 44.3%—implying modest demand elasticity. Financing, trade-ins and bundles (e.g., carrier subsidies, Apple Trade In) blur headline price. Macro slowdowns in 2023–24 nudged some buyers to older models, so tiered pricing across SE, standard and Pro lines manages elasticity by segment.
Information-rich market but limited customization leverage
Buyers easily compare specs, reviews and total cost online, pressuring Apple on features and timing, yet Apple reported an active installed base of about 2.2 billion devices in 2024 which reduces churn leverage. Standardized SKUs and a closed iOS/macOS ecosystem limit bespoke demands despite strong customer research capabilities. Refurbished and previous‑gen offerings act as internal substitutes, keeping price resistance muted. Increased transparency lifts expectations more than bargaining power.
Enterprise and education procurement
Institutions negotiating enterprise and education procurement gain modest buyer power by purchasing at scale, pressing on price and deployment terms, while reliance on MDM, security stacks, and lifecycle support increases leverage in feature and service negotiations.
Apple pushes back with deployment tools (Apple Business/School Manager), TCO arguments, and an extensive channel partner network; volume discounts exist but are constrained by deliberate brand pricing discipline and premium positioning.
Multidevice ownership and bundling
Households often buy multiple Apple devices—Apple reported a 2 billion active device installed base in Jan 2024—reducing per-unit bargaining as shared accounts and family sharing lock in spend. Bundles like Apple One and trade-in pathways increase lifetime value and retention, while multi-homing with non-Apple services and ~90% U.S. iPhone loyalty mean some buyer leverage remains; cross-selling lowers churn over time.
- 2 billion active devices (Jan 2024)
- Apple One + trade-ins boost retention
- Multi-homing provides limited leverage
- High iPhone loyalty lowers buyer power
Ecosystem: 2.2B devices, ~90% US loyalty locks consumers
Apple’s ecosystem and 2.2B active devices (Jan 2024) and ~90% US iPhone loyalty raise switching costs, reducing individual buyer power. Premium pricing supported by FY2024 revenue $383.3B and ~44.3% gross margin limits price pressure. Volume purchasers gain moderate leverage via procurement and MDM needs, but volume discounts are capped by brand strategy.
| Metric | Value |
|---|---|
| Active devices (Jan 2024) | 2.2B |
| FY2024 revenue | $383.3B |
| Gross margin | 44.3% |
| US iPhone loyalty | ~90% |
What You See Is What You Get
Apple Porter's Five Forces Analysis
This preview shows the exact Apple Porter’s Five Forces analysis you'll receive—no surprises, no placeholders. The report offers concise evaluation of competitive rivalry, supplier and buyer power, threats of entry and substitution, and strategic implications. It's fully formatted and actionable for decision-making, ready for immediate download after purchase.
Description
From Overview to Strategy Blueprint
Apple's Porter's Five Forces Analysis highlights intense rivalry from global device makers, high buyer expectations, strong supplier influence for key components, significant threat from substitutes in services, and high barriers to entry due to ecosystem scale. This brief snapshot only scratches the surface. Unlock the full Porter's Five Forces Analysis to explore Apple’s competitive dynamics, market pressures, and strategic advantages in detail.
Suppliers Bargaining Power
Concentrated advanced chip and display suppliers
Apple depends on a few advanced-node suppliers—TSMC (which held over 80% of global sub-5nm capacity in 2024) and premium OLED vendors like Samsung Display and LG Display—concentrating supply and giving those partners leverage over capacity allocation and pricing. Apple mitigates this through long-term contracts and prepayments to secure priority capacity and favorable terms. Nonetheless, node scarcity and yield volatility keep supplier power materially non-trivial.
Scale, multi-sourcing, and custom designs temper leverage
Apple’s scale—2 billion active devices and $383.3 billion revenue in FY2024—gives it leverage as it dual-sources commoditized parts and designs proprietary A/M-series silicon, which reduces standard component suppliers’ bargaining power. Proprietary specs shift value capture to Apple and foster vendor competition, while commoditized parts remain easy to switch. Strategic components like advanced displays and sensors stay stickier despite scale.
Vertical integration and IP ownership
Apple’s in-house SoC design (A/M series), OS stack and growing services ecosystem reduce dependence on external tech roadmaps, helping align product timelines and margins; Apple reported FY2024 revenue of about $383.3 billion, enlarging its internal leverage. Control over core IP limits suppliers’ pricing power and differentiation claims, while TSMC remained Apple’s sole advanced-node foundry in 2024 (TSMC 2024 capex ~40 billion USD). Fabrication and advanced packaging still require external partners, so verticalization shifts but does not eliminate supplier leverage.
Geopolitical and materials exposure
Semiconductor clustering in Taiwan (TSMC ≈53% global foundry share in 2024) and concentration of critical materials—China controls roughly 60% of rare-earth processing and the DRC supplies ~70% of mined cobalt—heighten supplier leverage, while export controls and tariffs can quickly tighten flows and increase negotiating power. Apple’s gradual China+1 shift (India/Vietnam raising iPhone assembly to low single-digit–to–low double-digit shares by 2024) only partly mitigates this. Risk premiums already surface in component pricing and stricter contract terms.
- TSMC ≈53% foundry share (2024)
- China ≈60% rare-earth processing; DRC ≈70% cobalt supply
- Apple China+1: India/Vietnam low single–digit to low double–digit iPhone share (2024)
Service/content providers and financial networks
Labels, studios and payment networks wield significant bargaining power over Apple Services: licensing windows and label splits (often 50–55% for music/streaming) plus payment-rail fees (typically 1.5–3%) constrain margins even as Apple Services reached about $89 billion in FY2024.
- Revenue share: labels/studios 50–55%
- App Store cuts: up to 30% (15% for small devs)
- Payment fees: 1.5–3%
- Apple counters with originals, exclusives, Apple Pay scale
Foundry concentration: ≈53% share; sub-5nm >80%; key material risks
Supplier power is material: TSMC held ≈53% foundry share and >80% of sub-5nm capacity in 2024, concentrating advanced-node leverage; Samsung/LG dominate premium OLEDs. Apple scale ($383.3B revenue, 2B devices) and in-house silicon reduce commoditized supplier power, but key materials (China ≈60% rare-earth processing; DRC ≈70% cobalt) and assembly clustering keep risk. Services (≈$89B FY2024) face label/app store splits limiting margin.
| Metric | 2024 Value |
|---|---|
| Apple revenue | $383.3B |
| Active devices | 2B |
| TSMC foundry share | ≈53% |
| Sub-5nm capacity | >80% |
| Services revenue | $89B |
| China rare-earth processing | ≈60% |
| DRC cobalt supply | ≈70% |
What is included in the product
Detailed Word Document
Comprehensive Porter's Five Forces analysis tailored for Apple, assessing competitive rivalry, supplier and buyer power, threat of substitutes and new entrants, and identifying disruptive forces and strategic barriers that shape its profitability.
Customizable Excel Spreadsheet
A concise one-sheet Porter's Five Forces for Apple that highlights supplier/buyer power, competitive rivalry and threats of entry/substitutes—ideal for rapid strategic decisions; editable radar chart and clean layout ready to drop into pitch decks, Excel dashboards or board materials.
Customers Bargaining Power
High switching costs via ecosystem lock-in
iMessage, iCloud, App Store purchases and tight device integration create ecosystem lock-in that raises switching costs for users, supported by Apple’s 2.2 billion active devices reported in January 2024. Cross-device continuity (Handoff, Universal Clipboard) and bundled services deepen stickiness and lower price sensitivity. As a result, iPhone churn remains below many Android OEMs, weakening individual buyer bargaining power.
Premium brand reduces price sensitivity
Strong brand equity lets Apple sustain premium pricing—reflected in FY2024 revenue of $383.3B and a gross margin near 44.3%—implying modest demand elasticity. Financing, trade-ins and bundles (e.g., carrier subsidies, Apple Trade In) blur headline price. Macro slowdowns in 2023–24 nudged some buyers to older models, so tiered pricing across SE, standard and Pro lines manages elasticity by segment.
Information-rich market but limited customization leverage
Buyers easily compare specs, reviews and total cost online, pressuring Apple on features and timing, yet Apple reported an active installed base of about 2.2 billion devices in 2024 which reduces churn leverage. Standardized SKUs and a closed iOS/macOS ecosystem limit bespoke demands despite strong customer research capabilities. Refurbished and previous‑gen offerings act as internal substitutes, keeping price resistance muted. Increased transparency lifts expectations more than bargaining power.
Enterprise and education procurement
Institutions negotiating enterprise and education procurement gain modest buyer power by purchasing at scale, pressing on price and deployment terms, while reliance on MDM, security stacks, and lifecycle support increases leverage in feature and service negotiations.
Apple pushes back with deployment tools (Apple Business/School Manager), TCO arguments, and an extensive channel partner network; volume discounts exist but are constrained by deliberate brand pricing discipline and premium positioning.
Multidevice ownership and bundling
Households often buy multiple Apple devices—Apple reported a 2 billion active device installed base in Jan 2024—reducing per-unit bargaining as shared accounts and family sharing lock in spend. Bundles like Apple One and trade-in pathways increase lifetime value and retention, while multi-homing with non-Apple services and ~90% U.S. iPhone loyalty mean some buyer leverage remains; cross-selling lowers churn over time.
- 2 billion active devices (Jan 2024)
- Apple One + trade-ins boost retention
- Multi-homing provides limited leverage
- High iPhone loyalty lowers buyer power
Ecosystem: 2.2B devices, ~90% US loyalty locks consumers
Apple’s ecosystem and 2.2B active devices (Jan 2024) and ~90% US iPhone loyalty raise switching costs, reducing individual buyer power. Premium pricing supported by FY2024 revenue $383.3B and ~44.3% gross margin limits price pressure. Volume purchasers gain moderate leverage via procurement and MDM needs, but volume discounts are capped by brand strategy.
| Metric | Value |
|---|---|
| Active devices (Jan 2024) | 2.2B |
| FY2024 revenue | $383.3B |
| Gross margin | 44.3% |
| US iPhone loyalty | ~90% |
What You See Is What You Get
Apple Porter's Five Forces Analysis
This preview shows the exact Apple Porter’s Five Forces analysis you'll receive—no surprises, no placeholders. The report offers concise evaluation of competitive rivalry, supplier and buyer power, threats of entry and substitution, and strategic implications. It's fully formatted and actionable for decision-making, ready for immediate download after purchase.











