Apply PESTLE Analysis

Skip the Research. Get the Strategy.
Unlock strategic clarity with our PESTLE Analysis of Apply—three-cycle coverage of political, economic, social, technological, legal and environmental forces shaping the company. Use these insights to anticipate risks and spot growth opportunities. Purchase the full, editable report for immediate, board-ready intelligence.
Political factors

Energy policy shifts and subsidies
Government prioritisation between hydrocarbons and renewables directly alters EPCI demand, project timelines and margins by shifting capital and labour toward green builds or brownfield work.
Subsidies and mechanisms such as Contracts for Difference and the US Inflation Reduction Act (up to 30% ITC) accelerate offshore wind and electrification, supporting targets like the UK 50 GW offshore-by-2030 goal.
Fossil fuel phase-downs reduce brownfield oil opportunities; Apply must track national energy strategies and funding mechanisms and use scenario planning to hedge abrupt policy reversals.
Geopolitics, sanctions, and trade relations
Sanctions (over 14,000 measures tracked in 2024) restrict sourcing and market entry for offshore projects and force rerouting of suppliers; maritime tensions raised regional war-risk premiums and pushed some voyage insurance costs up by multiples during 2023–24, increasing logistics costs and project risk premia. Apply must maintain compliant, diversified supply chains, use political risk insurance and rigorous partner vetting to mitigate exposure.

Local content and national procurement rules
Many jurisdictions mandate local fabrication, staffing and vendor participation, with local content thresholds commonly set between 30% and 60%; compliance reshapes cost structure, can add an estimated 5–15% to EPCI costs and extend schedules by 3–9 months through yard re-selection and approvals. Apply should build local partnerships and training programs to meet thresholds and engage authorities early to reduce approval friction and expedite permits.

Permitting and administrative capacity
Approval timelines for offshore installations and grid connections are politically sensitive and can bottleneck projects; the UK aims for 50 GW offshore by 2030, increasing pressure to speed consenting. Variability across agencies shifts start dates and cash flow, while proactive permitting roadmaps, stakeholder mapping, clear documentation and consultations have shortened cycles in recent UK and US programs.
- Permitting delays: risk to cash flow
- 50 GW UK 2030 target raises urgency
- Proactive roadmaps reduce timeline variance
- Stakeholder mapping + clear docs cut approval cycles
Public infrastructure and industrial policy
- Ports & HVDC enable scale-up
- 5.2 billion EUR public hydrogen IPCEI (2023)
- Grants/testbeds de-risk tech
- Policy forums shape standards
Policy shifts, IRA incentives & sanctions reshape EPCI; UK 50 GW 2030
Government shifts between hydrocarbons and renewables (UK 50 GW offshore by 2030) change EPCI demand, margins and timelines; subsidies such as CFDs and US IRA (up to 30% ITC) accelerate wind/electrification.
Sanctions (14,000+ measures tracked in 2024) and 2023–24 insurance spikes raised logistics costs and risk premia; local content rules (30–60%) add ~5–15% to EPCI costs.
Public investments (EU hydrogen IPCEIs €5.2bn 2023) and permitting variance require proactive stakeholder engagement and diversified supply chains.
| Risk | Key data | Impact |
|---|---|---|
| Policy shift | UK 50 GW 2030 | Demand/timing |
| Incentives | IRA 30% ITC | Project viability |
| Sanctions/insure | 14k measures; 2023–24 premiums↑ | Supply/costs |
| Local content | 30–60%; +5–15% cost | Schedule/capex |
What is included in the product
 Detailed Word Document
Explores how external macro-environmental factors uniquely affect Apply across six dimensions—Political, Economic, Social, Technological, Environmental, and Legal—using data-driven trends and forward-looking insights to identify risks and opportunities for executives, consultants, and entrepreneurs, ready for inclusion in plans, decks, or reports.

 Customizable Excel Spreadsheet
Condenses PESTLE findings into a clear, actionable summary that highlights external pain points and recommended focus areas for rapid decision-making. Easily editable and shareable for alignment across teams, making it simple to prioritize risks and opportunities in planning sessions.
Economic factors

Commodity price cycles and capex sensitivity
Oil and gas price swings (Brent ranged roughly $60–120/bbl since 2020) drive client FIDs, while power prices and PPA terms — with corporate PPA costs down materially in many markets 2019–24 — shape renewables buildout. This cyclicality compresses Apply’s backlog visibility and can move utilization by double digits quarter-on-quarter. A balanced mix of O&G modifications and renewables smooths revenue, and flexible staffing plus subcontracting buffers cut downside risk.
Inflation, interest rates, and financing costs
High interest rates push developers' WACC higher—US 10-year Treasury yields above 4% in mid-2025 and borrowing costs remain elevated, delaying marginal projects. Material and labor inflation (construction input inflation ~5–8% in 2024–25 in many markets) erodes fixed-price EPCI margins. Use escalation clauses, commodity hedges and supplier framework agreements to lock pricing and reduce margin risk.

Currency volatility and export exposure
Revenues and costs spanning NOK, EUR and USD expose Apply to FX risk amid a global FX market with $7.5 trillion daily turnover (BIS 2019) and reserve currencies dominated by USD ~59% and EUR ~20% (IMF COFER Q4 2024). FX swings materially affect profitability on long-duration vessel and supply-chain contracts, so Apply needs natural hedges and treasury policies tied to project cash-flow timings. Milestone invoicing in matched currencies reduces translation and transaction risk.

Supply chain capacity and lead times
- Tag: market_size ~190bn USD (2023)
- Tag: lead_times 12–36 months
- Tag: mitigation early_commitments, dual_source
- Tag: enabler digital_tracking, expediting
Labor market tightness and productivity
Skilled engineers, welders and offshore crews remain scarce, pushing wages up an estimated 5–8% year-on-year in 2024 across energy and marine construction markets; modularization and advanced planning have delivered productivity gains that can offset much of this inflation by cutting onsite hours and rework. Apply should fund training academies and retention programs while strategically deploying automation to reduce costly offshore labor exposure and total project man-hours.
- Labor tightness: skilled crew scarcity, wages +5–8% (2024)
- Productivity: modularization/advanced planning lowers onsite hours
- CapEx: training academies and retention programs
- Tech: automation to cut offshore man-hours and labor costs
Policy shifts, IRA incentives & sanctions reshape EPCI; UK 50 GW 2030
Commodity swings (Brent ~$60–120/bbl 2020–24) and power/PPA volatility compress backlog and shift utilization double digits Q/Q.
Higher rates (US 10y >4% mid‑2025) and input inflation (+5–8% 2024–25) raise WACC and squeeze EPCI margins; use hedges, escalation and supplier frameworks.
Long lead times (12–36m) and cable market ~$190bn (2023) plus FX risk require early commitments, dual‑sourcing and matched‑currency invoicing.
| Tag | Value |
|---|---|
| Brent | $60–120/bbl |
| 10y | >4% |
| Inflation | +5–8% |
| Lead_times | 12–36m |
| Market | $190bn (2023) |
Same Document Delivered
Apply PESTLE Analysis
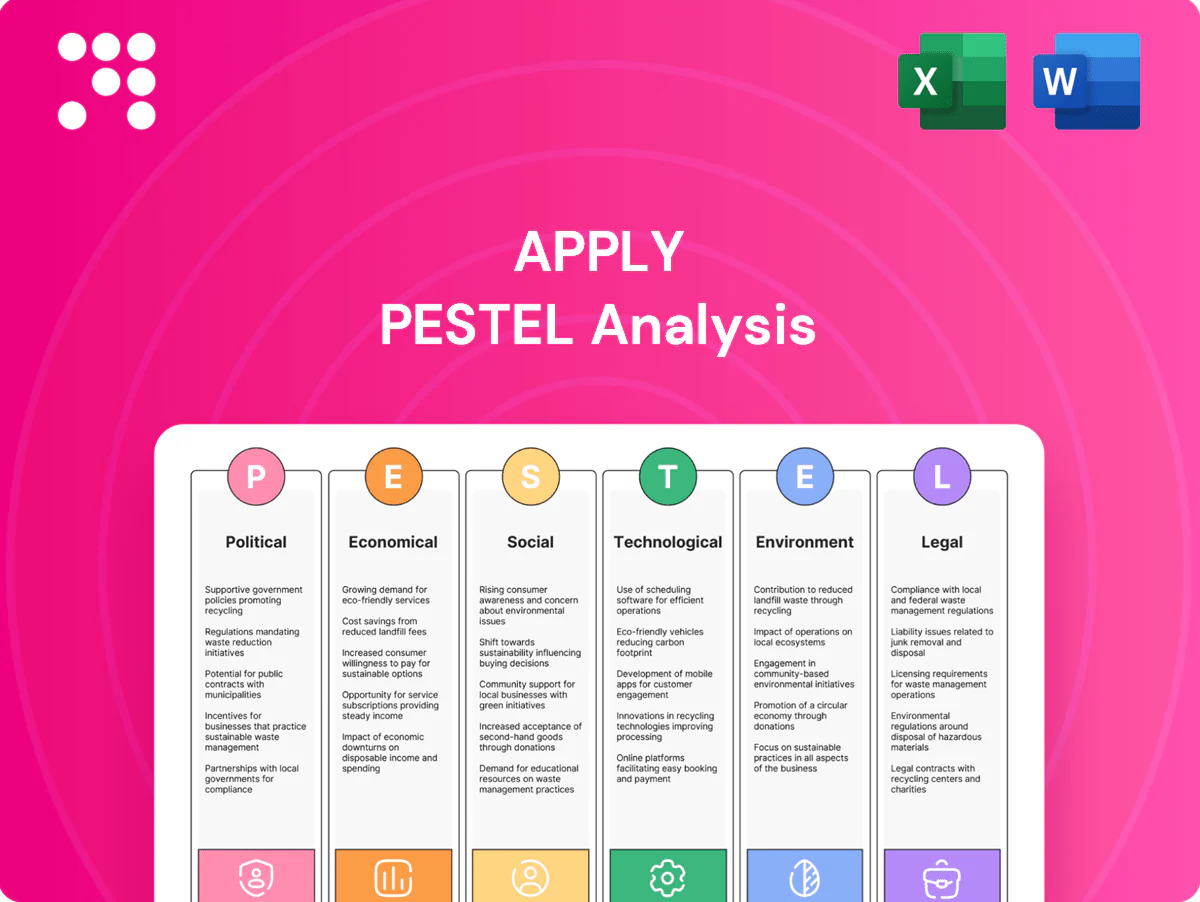
The preview shown here is the exact Apply PESTLE Analysis document you’ll receive after purchase—fully formatted and ready to use. It systematically covers Political, Economic, Social, Technological, Legal and Environmental factors with clear headings, prompts and actionable insights. No placeholders or teasers—download the finished, professional file immediately after checkout.

Skip the Research. Get the Strategy.
Unlock strategic clarity with our PESTLE Analysis of Apply—three-cycle coverage of political, economic, social, technological, legal and environmental forces shaping the company. Use these insights to anticipate risks and spot growth opportunities. Purchase the full, editable report for immediate, board-ready intelligence.
Political factors
Energy policy shifts and subsidies
Government prioritisation between hydrocarbons and renewables directly alters EPCI demand, project timelines and margins by shifting capital and labour toward green builds or brownfield work.
Subsidies and mechanisms such as Contracts for Difference and the US Inflation Reduction Act (up to 30% ITC) accelerate offshore wind and electrification, supporting targets like the UK 50 GW offshore-by-2030 goal.
Fossil fuel phase-downs reduce brownfield oil opportunities; Apply must track national energy strategies and funding mechanisms and use scenario planning to hedge abrupt policy reversals.
Geopolitics, sanctions, and trade relations
Sanctions (over 14,000 measures tracked in 2024) restrict sourcing and market entry for offshore projects and force rerouting of suppliers; maritime tensions raised regional war-risk premiums and pushed some voyage insurance costs up by multiples during 2023–24, increasing logistics costs and project risk premia. Apply must maintain compliant, diversified supply chains, use political risk insurance and rigorous partner vetting to mitigate exposure.
Local content and national procurement rules
Many jurisdictions mandate local fabrication, staffing and vendor participation, with local content thresholds commonly set between 30% and 60%; compliance reshapes cost structure, can add an estimated 5–15% to EPCI costs and extend schedules by 3–9 months through yard re-selection and approvals. Apply should build local partnerships and training programs to meet thresholds and engage authorities early to reduce approval friction and expedite permits.
Permitting and administrative capacity
Approval timelines for offshore installations and grid connections are politically sensitive and can bottleneck projects; the UK aims for 50 GW offshore by 2030, increasing pressure to speed consenting. Variability across agencies shifts start dates and cash flow, while proactive permitting roadmaps, stakeholder mapping, clear documentation and consultations have shortened cycles in recent UK and US programs.
- Permitting delays: risk to cash flow
- 50 GW UK 2030 target raises urgency
- Proactive roadmaps reduce timeline variance
- Stakeholder mapping + clear docs cut approval cycles
Public infrastructure and industrial policy
- Ports & HVDC enable scale-up
- 5.2 billion EUR public hydrogen IPCEI (2023)
- Grants/testbeds de-risk tech
- Policy forums shape standards
Policy shifts, IRA incentives & sanctions reshape EPCI; UK 50 GW 2030
Government shifts between hydrocarbons and renewables (UK 50 GW offshore by 2030) change EPCI demand, margins and timelines; subsidies such as CFDs and US IRA (up to 30% ITC) accelerate wind/electrification.
Sanctions (14,000+ measures tracked in 2024) and 2023–24 insurance spikes raised logistics costs and risk premia; local content rules (30–60%) add ~5–15% to EPCI costs.
Public investments (EU hydrogen IPCEIs €5.2bn 2023) and permitting variance require proactive stakeholder engagement and diversified supply chains.
| Risk | Key data | Impact |
|---|---|---|
| Policy shift | UK 50 GW 2030 | Demand/timing |
| Incentives | IRA 30% ITC | Project viability |
| Sanctions/insure | 14k measures; 2023–24 premiums↑ | Supply/costs |
| Local content | 30–60%; +5–15% cost | Schedule/capex |
What is included in the product
Detailed Word Document
Explores how external macro-environmental factors uniquely affect Apply across six dimensions—Political, Economic, Social, Technological, Environmental, and Legal—using data-driven trends and forward-looking insights to identify risks and opportunities for executives, consultants, and entrepreneurs, ready for inclusion in plans, decks, or reports.
Customizable Excel Spreadsheet
Condenses PESTLE findings into a clear, actionable summary that highlights external pain points and recommended focus areas for rapid decision-making. Easily editable and shareable for alignment across teams, making it simple to prioritize risks and opportunities in planning sessions.
Economic factors
Commodity price cycles and capex sensitivity
Oil and gas price swings (Brent ranged roughly $60–120/bbl since 2020) drive client FIDs, while power prices and PPA terms — with corporate PPA costs down materially in many markets 2019–24 — shape renewables buildout. This cyclicality compresses Apply’s backlog visibility and can move utilization by double digits quarter-on-quarter. A balanced mix of O&G modifications and renewables smooths revenue, and flexible staffing plus subcontracting buffers cut downside risk.
Inflation, interest rates, and financing costs
High interest rates push developers' WACC higher—US 10-year Treasury yields above 4% in mid-2025 and borrowing costs remain elevated, delaying marginal projects. Material and labor inflation (construction input inflation ~5–8% in 2024–25 in many markets) erodes fixed-price EPCI margins. Use escalation clauses, commodity hedges and supplier framework agreements to lock pricing and reduce margin risk.
Currency volatility and export exposure
Revenues and costs spanning NOK, EUR and USD expose Apply to FX risk amid a global FX market with $7.5 trillion daily turnover (BIS 2019) and reserve currencies dominated by USD ~59% and EUR ~20% (IMF COFER Q4 2024). FX swings materially affect profitability on long-duration vessel and supply-chain contracts, so Apply needs natural hedges and treasury policies tied to project cash-flow timings. Milestone invoicing in matched currencies reduces translation and transaction risk.
Supply chain capacity and lead times
- Tag: market_size ~190bn USD (2023)
- Tag: lead_times 12–36 months
- Tag: mitigation early_commitments, dual_source
- Tag: enabler digital_tracking, expediting
Labor market tightness and productivity
Skilled engineers, welders and offshore crews remain scarce, pushing wages up an estimated 5–8% year-on-year in 2024 across energy and marine construction markets; modularization and advanced planning have delivered productivity gains that can offset much of this inflation by cutting onsite hours and rework. Apply should fund training academies and retention programs while strategically deploying automation to reduce costly offshore labor exposure and total project man-hours.
- Labor tightness: skilled crew scarcity, wages +5–8% (2024)
- Productivity: modularization/advanced planning lowers onsite hours
- CapEx: training academies and retention programs
- Tech: automation to cut offshore man-hours and labor costs
Policy shifts, IRA incentives & sanctions reshape EPCI; UK 50 GW 2030
Commodity swings (Brent ~$60–120/bbl 2020–24) and power/PPA volatility compress backlog and shift utilization double digits Q/Q.
Higher rates (US 10y >4% mid‑2025) and input inflation (+5–8% 2024–25) raise WACC and squeeze EPCI margins; use hedges, escalation and supplier frameworks.
Long lead times (12–36m) and cable market ~$190bn (2023) plus FX risk require early commitments, dual‑sourcing and matched‑currency invoicing.
| Tag | Value |
|---|---|
| Brent | $60–120/bbl |
| 10y | >4% |
| Inflation | +5–8% |
| Lead_times | 12–36m |
| Market | $190bn (2023) |
Same Document Delivered
Apply PESTLE Analysis
The preview shown here is the exact Apply PESTLE Analysis document you’ll receive after purchase—fully formatted and ready to use. It systematically covers Political, Economic, Social, Technological, Legal and Environmental factors with clear headings, prompts and actionable insights. No placeholders or teasers—download the finished, professional file immediately after checkout.
Description
Skip the Research. Get the Strategy.
Unlock strategic clarity with our PESTLE Analysis of Apply—three-cycle coverage of political, economic, social, technological, legal and environmental forces shaping the company. Use these insights to anticipate risks and spot growth opportunities. Purchase the full, editable report for immediate, board-ready intelligence.
Political factors
Energy policy shifts and subsidies
Government prioritisation between hydrocarbons and renewables directly alters EPCI demand, project timelines and margins by shifting capital and labour toward green builds or brownfield work.
Subsidies and mechanisms such as Contracts for Difference and the US Inflation Reduction Act (up to 30% ITC) accelerate offshore wind and electrification, supporting targets like the UK 50 GW offshore-by-2030 goal.
Fossil fuel phase-downs reduce brownfield oil opportunities; Apply must track national energy strategies and funding mechanisms and use scenario planning to hedge abrupt policy reversals.
Geopolitics, sanctions, and trade relations
Sanctions (over 14,000 measures tracked in 2024) restrict sourcing and market entry for offshore projects and force rerouting of suppliers; maritime tensions raised regional war-risk premiums and pushed some voyage insurance costs up by multiples during 2023–24, increasing logistics costs and project risk premia. Apply must maintain compliant, diversified supply chains, use political risk insurance and rigorous partner vetting to mitigate exposure.
Local content and national procurement rules
Many jurisdictions mandate local fabrication, staffing and vendor participation, with local content thresholds commonly set between 30% and 60%; compliance reshapes cost structure, can add an estimated 5–15% to EPCI costs and extend schedules by 3–9 months through yard re-selection and approvals. Apply should build local partnerships and training programs to meet thresholds and engage authorities early to reduce approval friction and expedite permits.
Permitting and administrative capacity
Approval timelines for offshore installations and grid connections are politically sensitive and can bottleneck projects; the UK aims for 50 GW offshore by 2030, increasing pressure to speed consenting. Variability across agencies shifts start dates and cash flow, while proactive permitting roadmaps, stakeholder mapping, clear documentation and consultations have shortened cycles in recent UK and US programs.
- Permitting delays: risk to cash flow
- 50 GW UK 2030 target raises urgency
- Proactive roadmaps reduce timeline variance
- Stakeholder mapping + clear docs cut approval cycles
Public infrastructure and industrial policy
- Ports & HVDC enable scale-up
- 5.2 billion EUR public hydrogen IPCEI (2023)
- Grants/testbeds de-risk tech
- Policy forums shape standards
Policy shifts, IRA incentives & sanctions reshape EPCI; UK 50 GW 2030
Government shifts between hydrocarbons and renewables (UK 50 GW offshore by 2030) change EPCI demand, margins and timelines; subsidies such as CFDs and US IRA (up to 30% ITC) accelerate wind/electrification.
Sanctions (14,000+ measures tracked in 2024) and 2023–24 insurance spikes raised logistics costs and risk premia; local content rules (30–60%) add ~5–15% to EPCI costs.
Public investments (EU hydrogen IPCEIs €5.2bn 2023) and permitting variance require proactive stakeholder engagement and diversified supply chains.
| Risk | Key data | Impact |
|---|---|---|
| Policy shift | UK 50 GW 2030 | Demand/timing |
| Incentives | IRA 30% ITC | Project viability |
| Sanctions/insure | 14k measures; 2023–24 premiums↑ | Supply/costs |
| Local content | 30–60%; +5–15% cost | Schedule/capex |
What is included in the product
Detailed Word Document
Explores how external macro-environmental factors uniquely affect Apply across six dimensions—Political, Economic, Social, Technological, Environmental, and Legal—using data-driven trends and forward-looking insights to identify risks and opportunities for executives, consultants, and entrepreneurs, ready for inclusion in plans, decks, or reports.
Customizable Excel Spreadsheet
Condenses PESTLE findings into a clear, actionable summary that highlights external pain points and recommended focus areas for rapid decision-making. Easily editable and shareable for alignment across teams, making it simple to prioritize risks and opportunities in planning sessions.
Economic factors
Commodity price cycles and capex sensitivity
Oil and gas price swings (Brent ranged roughly $60–120/bbl since 2020) drive client FIDs, while power prices and PPA terms — with corporate PPA costs down materially in many markets 2019–24 — shape renewables buildout. This cyclicality compresses Apply’s backlog visibility and can move utilization by double digits quarter-on-quarter. A balanced mix of O&G modifications and renewables smooths revenue, and flexible staffing plus subcontracting buffers cut downside risk.
Inflation, interest rates, and financing costs
High interest rates push developers' WACC higher—US 10-year Treasury yields above 4% in mid-2025 and borrowing costs remain elevated, delaying marginal projects. Material and labor inflation (construction input inflation ~5–8% in 2024–25 in many markets) erodes fixed-price EPCI margins. Use escalation clauses, commodity hedges and supplier framework agreements to lock pricing and reduce margin risk.
Currency volatility and export exposure
Revenues and costs spanning NOK, EUR and USD expose Apply to FX risk amid a global FX market with $7.5 trillion daily turnover (BIS 2019) and reserve currencies dominated by USD ~59% and EUR ~20% (IMF COFER Q4 2024). FX swings materially affect profitability on long-duration vessel and supply-chain contracts, so Apply needs natural hedges and treasury policies tied to project cash-flow timings. Milestone invoicing in matched currencies reduces translation and transaction risk.
Supply chain capacity and lead times
- Tag: market_size ~190bn USD (2023)
- Tag: lead_times 12–36 months
- Tag: mitigation early_commitments, dual_source
- Tag: enabler digital_tracking, expediting
Labor market tightness and productivity
Skilled engineers, welders and offshore crews remain scarce, pushing wages up an estimated 5–8% year-on-year in 2024 across energy and marine construction markets; modularization and advanced planning have delivered productivity gains that can offset much of this inflation by cutting onsite hours and rework. Apply should fund training academies and retention programs while strategically deploying automation to reduce costly offshore labor exposure and total project man-hours.
- Labor tightness: skilled crew scarcity, wages +5–8% (2024)
- Productivity: modularization/advanced planning lowers onsite hours
- CapEx: training academies and retention programs
- Tech: automation to cut offshore man-hours and labor costs
Policy shifts, IRA incentives & sanctions reshape EPCI; UK 50 GW 2030
Commodity swings (Brent ~$60–120/bbl 2020–24) and power/PPA volatility compress backlog and shift utilization double digits Q/Q.
Higher rates (US 10y >4% mid‑2025) and input inflation (+5–8% 2024–25) raise WACC and squeeze EPCI margins; use hedges, escalation and supplier frameworks.
Long lead times (12–36m) and cable market ~$190bn (2023) plus FX risk require early commitments, dual‑sourcing and matched‑currency invoicing.
| Tag | Value |
|---|---|
| Brent | $60–120/bbl |
| 10y | >4% |
| Inflation | +5–8% |
| Lead_times | 12–36m |
| Market | $190bn (2023) |
Same Document Delivered
Apply PESTLE Analysis
The preview shown here is the exact Apply PESTLE Analysis document you’ll receive after purchase—fully formatted and ready to use. It systematically covers Political, Economic, Social, Technological, Legal and Environmental factors with clear headings, prompts and actionable insights. No placeholders or teasers—download the finished, professional file immediately after checkout.











