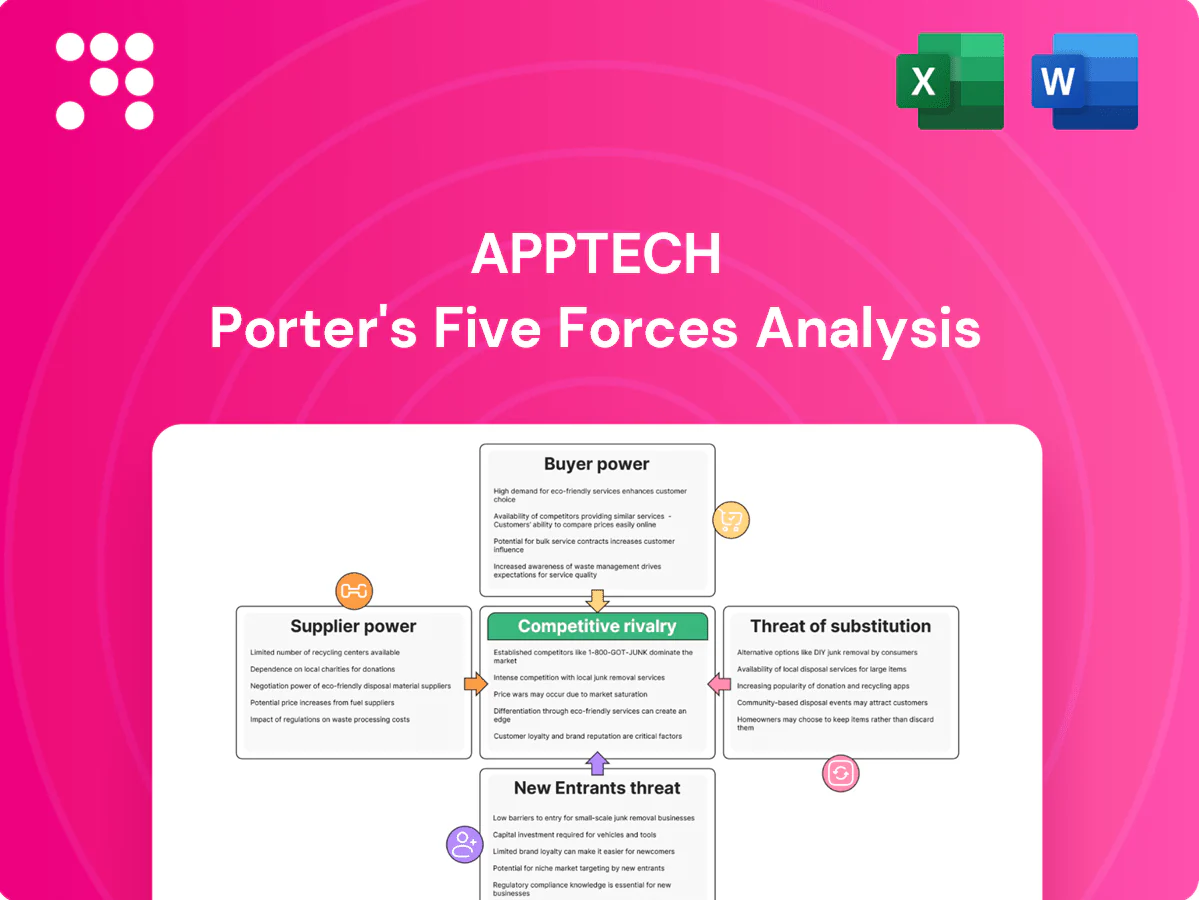
AppTech Porter's Five Forces Analysis

A Must-Have Tool for Decision-Makers
AppTech’s Porter's Five Forces snapshot highlights supplier and buyer pressures, competitive rivalry, threat of entrants and substitutes, and strategic levers management can use to protect margins. This brief outlines core risks and opportunities. Unlock the full analysis for force-by-force ratings, visuals, and actionable strategy tailored to AppTech.
Suppliers Bargaining Power

Dependence on card networks
AppTech is tightly dependent on card schemes: Visa and Mastercard together processed over 80% of global card volume in 2024, setting interchange and scheme fees and binding rules AppTech must accept. Scheme rule changes can raise costs or force rapid platform updates; few alternatives increase supplier leverage, while long-term partnerships and negotiated rebates partially mitigate volatility.
Cloud and core infrastructure
AppTech depends on hyperscalers for compute, storage, security and uptime, with AWS 32%, Microsoft Azure 21% and Google Cloud 11% market share (Synergy Research, 2024). Concentration raises switching costs and supplier price power. Flexera 2024 reports 92% of organizations use multi-cloud to reduce lock-in, but it increases architectural complexity and cost. Service outages directly jeopardize SLAs and can cause multi-million-dollar reputational and financial losses.

Banking-as-a-Service partners
BaaS sponsor banks and platforms enable issuing, ledgering, and compliance rails, and the global BaaS market was estimated at about $10 billion in 2024, underscoring their commercial importance. Heightened regulatory scrutiny in 2023–24 tightened onboarding and contract terms, reducing partner availability. Dependency on a few sponsors gives those banks leverage over pricing and data access. Diversifying bank relationships lowers single-point-of-failure and bargaining risk.

Fraud, KYC, and data vendors
Risk-scoring, identity verification, and data enrichment vendors are highly specialized and sticky, with top providers claiming match rates above 95% in 2024, enabling pricing power.
Accuracy and coverage variance drives vendor selection; premium data sets and superior false-positive reduction justify higher fees and contract terms.
Deep API and workflow integration creates switching costs (months of projects), while volume commitments commonly unlock 10–25% discounts but reduce procurement flexibility.
- 95%+ match rates (top vendors)
- 10–25% volume discounts
- 3–9 month integration timelines
- High switching costs and vendor stickiness
Payment hardware and gateways
Supplier power: >80% card volume, hyperscalers, $10B BaaS
AppTech faces strong supplier power: Visa/Mastercard >80% card volume (2024) set fees and rules; hyperscalers (AWS 32%, Azure 21%, GCP 11%) raise switching costs; BaaS sponsors (~$10B market, 2024) and top risk/data vendors (95%+ match rates) command pricing; terminals (Verifone/Ingenico) and certification (EMV/PCI) add lock-in and costs.
| Supplier | 2024 stat | Impact |
|---|---|---|
| Card schemes | >80% volume | Fee/rule control |
| Hyperscalers | AWS32%/AZ21%/GCP11% | High switching cost |
| BaaS | $10B market | Pricing leverage |
What is included in the product
 Detailed Word Document
Uncovers key drivers of competition, customer influence, supplier power, substitutes and entry barriers tailored exclusively for AppTech, identifying disruptive threats and strategic levers to protect market share; fully editable for reports, pitch decks, or investor materials.

 Customizable Excel Spreadsheet
AppTech Porter's Five Forces delivers a concise one-sheet view with customizable pressure levels, instant spider/radar visualization, and a clean, deck-ready layout—no macros required, easy data swapping and duplicate tabs for rapid scenario or pre/post-regulation analysis.
Customers Bargaining Power

Merchant price sensitivity
SMBs and enterprises routinely shop MDRs, SaaS fees and chargeback costs—with 2024 global e-commerce at about $6.3 trillion, small MDR differences (avg ~1.5%) translate to material margin impact. Transparent pricing and frequent promotions boosted buyer leverage in 2024, enabling roughly 60% of merchants to seek renegotiation. High-volume merchants negotiate 20–35% lower fees, while bundled fraud tools and analytics reduce pure price focus.
Switching ease via APIs
Modern APIs and middleware lower integration friction and ease churn; the API management market reached about $8.2B in 2024 (MarketsandMarkets) as adoption scales. Postman’s 2024 State of the API found 97% of organizations using APIs, while ISO/ISV channels and turnkey connectors can cut migration time by roughly 30%, enabling rapid moves. Data portability rules and export tools expand buyer options, though embedded workflows and custom features raise stickiness.

Demand for reliability and uptime
Merchants demand near-zero downtime and rapid dispute resolution, with 99.99% uptime expectations in commerce platforms in 2024 (≈52.6 minutes annual downtime). SLAs and financial credits tied to service levels shift leverage toward buyers, often reducing vendor revenue on failures. Outage-driven reputational loss pressures pricing and support commitments, while demonstrably superior reliability permits vendors to command premium rates.

Enterprise customization needs
Large enterprise clients increasingly demand bespoke reporting, routing, and compliance features, driving custom builds that deepen vendor dependence while expanding negotiation levers; industry surveys in 2024 show the majority of large deals include some customization. RFP-driven procurement lets enterprises extract concessions on price, service levels, and IP; referenceability and co-innovation often reduce price but can be traded for longer-term contracts.
- Custom builds: higher switching costs
- RFPs: leverage for concessions
- Co-innovation: trade-off price vs referenceability
Multi-homing across providers
- >50% merchants multi-home (2024)
- Smart routing adoption +30% YoY (2024)
- Key battlegrounds: performance, uptime, value-add
Merchants drive fees down: >50% multi-home, ~60% renegotiate, top cuts 20–35%
Buyer power is high: 2024 e-commerce ~$6.3T and avg MDR ~1.5% make fee differences material; ~60% of merchants sought renegotiation. >50% of merchants multi-home (2024) and smart routing adoption +30% YoY reduce lock-in. Enterprises use RFPs and customization to extract concessions; top merchants negotiate 20–35% fee cuts.
| Metric | 2024 |
|---|---|
| Global e-commerce | $6.3T |
| Avg MDR | ~1.5% |
| Merchants renegotiating | ~60% |
| Multi-home rate | >50% |
| Smart routing growth | +30% YoY |
| Top merchant fee cuts | 20–35% |
Preview the Actual Deliverable
AppTech Porter's Five Forces Analysis
This preview shows the exact AppTech Porter's Five Forces Analysis you'll receive immediately after purchase—no placeholders or samples. The file is fully formatted, professionally written, and ready for download and use the moment you buy. You're viewing the final deliverable; purchase grants instant access to this same document.

A Must-Have Tool for Decision-Makers
AppTech’s Porter's Five Forces snapshot highlights supplier and buyer pressures, competitive rivalry, threat of entrants and substitutes, and strategic levers management can use to protect margins. This brief outlines core risks and opportunities. Unlock the full analysis for force-by-force ratings, visuals, and actionable strategy tailored to AppTech.
Suppliers Bargaining Power
Dependence on card networks
AppTech is tightly dependent on card schemes: Visa and Mastercard together processed over 80% of global card volume in 2024, setting interchange and scheme fees and binding rules AppTech must accept. Scheme rule changes can raise costs or force rapid platform updates; few alternatives increase supplier leverage, while long-term partnerships and negotiated rebates partially mitigate volatility.
Cloud and core infrastructure
AppTech depends on hyperscalers for compute, storage, security and uptime, with AWS 32%, Microsoft Azure 21% and Google Cloud 11% market share (Synergy Research, 2024). Concentration raises switching costs and supplier price power. Flexera 2024 reports 92% of organizations use multi-cloud to reduce lock-in, but it increases architectural complexity and cost. Service outages directly jeopardize SLAs and can cause multi-million-dollar reputational and financial losses.
Banking-as-a-Service partners
BaaS sponsor banks and platforms enable issuing, ledgering, and compliance rails, and the global BaaS market was estimated at about $10 billion in 2024, underscoring their commercial importance. Heightened regulatory scrutiny in 2023–24 tightened onboarding and contract terms, reducing partner availability. Dependency on a few sponsors gives those banks leverage over pricing and data access. Diversifying bank relationships lowers single-point-of-failure and bargaining risk.
Fraud, KYC, and data vendors
Risk-scoring, identity verification, and data enrichment vendors are highly specialized and sticky, with top providers claiming match rates above 95% in 2024, enabling pricing power.
Accuracy and coverage variance drives vendor selection; premium data sets and superior false-positive reduction justify higher fees and contract terms.
Deep API and workflow integration creates switching costs (months of projects), while volume commitments commonly unlock 10–25% discounts but reduce procurement flexibility.
- 95%+ match rates (top vendors)
- 10–25% volume discounts
- 3–9 month integration timelines
- High switching costs and vendor stickiness
Payment hardware and gateways
Supplier power: >80% card volume, hyperscalers, $10B BaaS
AppTech faces strong supplier power: Visa/Mastercard >80% card volume (2024) set fees and rules; hyperscalers (AWS 32%, Azure 21%, GCP 11%) raise switching costs; BaaS sponsors (~$10B market, 2024) and top risk/data vendors (95%+ match rates) command pricing; terminals (Verifone/Ingenico) and certification (EMV/PCI) add lock-in and costs.
| Supplier | 2024 stat | Impact |
|---|---|---|
| Card schemes | >80% volume | Fee/rule control |
| Hyperscalers | AWS32%/AZ21%/GCP11% | High switching cost |
| BaaS | $10B market | Pricing leverage |
What is included in the product
Detailed Word Document
Uncovers key drivers of competition, customer influence, supplier power, substitutes and entry barriers tailored exclusively for AppTech, identifying disruptive threats and strategic levers to protect market share; fully editable for reports, pitch decks, or investor materials.
Customizable Excel Spreadsheet
AppTech Porter's Five Forces delivers a concise one-sheet view with customizable pressure levels, instant spider/radar visualization, and a clean, deck-ready layout—no macros required, easy data swapping and duplicate tabs for rapid scenario or pre/post-regulation analysis.
Customers Bargaining Power
Merchant price sensitivity
SMBs and enterprises routinely shop MDRs, SaaS fees and chargeback costs—with 2024 global e-commerce at about $6.3 trillion, small MDR differences (avg ~1.5%) translate to material margin impact. Transparent pricing and frequent promotions boosted buyer leverage in 2024, enabling roughly 60% of merchants to seek renegotiation. High-volume merchants negotiate 20–35% lower fees, while bundled fraud tools and analytics reduce pure price focus.
Switching ease via APIs
Modern APIs and middleware lower integration friction and ease churn; the API management market reached about $8.2B in 2024 (MarketsandMarkets) as adoption scales. Postman’s 2024 State of the API found 97% of organizations using APIs, while ISO/ISV channels and turnkey connectors can cut migration time by roughly 30%, enabling rapid moves. Data portability rules and export tools expand buyer options, though embedded workflows and custom features raise stickiness.
Demand for reliability and uptime
Merchants demand near-zero downtime and rapid dispute resolution, with 99.99% uptime expectations in commerce platforms in 2024 (≈52.6 minutes annual downtime). SLAs and financial credits tied to service levels shift leverage toward buyers, often reducing vendor revenue on failures. Outage-driven reputational loss pressures pricing and support commitments, while demonstrably superior reliability permits vendors to command premium rates.
Enterprise customization needs
Large enterprise clients increasingly demand bespoke reporting, routing, and compliance features, driving custom builds that deepen vendor dependence while expanding negotiation levers; industry surveys in 2024 show the majority of large deals include some customization. RFP-driven procurement lets enterprises extract concessions on price, service levels, and IP; referenceability and co-innovation often reduce price but can be traded for longer-term contracts.
- Custom builds: higher switching costs
- RFPs: leverage for concessions
- Co-innovation: trade-off price vs referenceability
Multi-homing across providers
- >50% merchants multi-home (2024)
- Smart routing adoption +30% YoY (2024)
- Key battlegrounds: performance, uptime, value-add
Merchants drive fees down: >50% multi-home, ~60% renegotiate, top cuts 20–35%
Buyer power is high: 2024 e-commerce ~$6.3T and avg MDR ~1.5% make fee differences material; ~60% of merchants sought renegotiation. >50% of merchants multi-home (2024) and smart routing adoption +30% YoY reduce lock-in. Enterprises use RFPs and customization to extract concessions; top merchants negotiate 20–35% fee cuts.
| Metric | 2024 |
|---|---|
| Global e-commerce | $6.3T |
| Avg MDR | ~1.5% |
| Merchants renegotiating | ~60% |
| Multi-home rate | >50% |
| Smart routing growth | +30% YoY |
| Top merchant fee cuts | 20–35% |
Preview the Actual Deliverable
AppTech Porter's Five Forces Analysis
This preview shows the exact AppTech Porter's Five Forces Analysis you'll receive immediately after purchase—no placeholders or samples. The file is fully formatted, professionally written, and ready for download and use the moment you buy. You're viewing the final deliverable; purchase grants instant access to this same document.
Description
A Must-Have Tool for Decision-Makers
AppTech’s Porter's Five Forces snapshot highlights supplier and buyer pressures, competitive rivalry, threat of entrants and substitutes, and strategic levers management can use to protect margins. This brief outlines core risks and opportunities. Unlock the full analysis for force-by-force ratings, visuals, and actionable strategy tailored to AppTech.
Suppliers Bargaining Power
Dependence on card networks
AppTech is tightly dependent on card schemes: Visa and Mastercard together processed over 80% of global card volume in 2024, setting interchange and scheme fees and binding rules AppTech must accept. Scheme rule changes can raise costs or force rapid platform updates; few alternatives increase supplier leverage, while long-term partnerships and negotiated rebates partially mitigate volatility.
Cloud and core infrastructure
AppTech depends on hyperscalers for compute, storage, security and uptime, with AWS 32%, Microsoft Azure 21% and Google Cloud 11% market share (Synergy Research, 2024). Concentration raises switching costs and supplier price power. Flexera 2024 reports 92% of organizations use multi-cloud to reduce lock-in, but it increases architectural complexity and cost. Service outages directly jeopardize SLAs and can cause multi-million-dollar reputational and financial losses.
Banking-as-a-Service partners
BaaS sponsor banks and platforms enable issuing, ledgering, and compliance rails, and the global BaaS market was estimated at about $10 billion in 2024, underscoring their commercial importance. Heightened regulatory scrutiny in 2023–24 tightened onboarding and contract terms, reducing partner availability. Dependency on a few sponsors gives those banks leverage over pricing and data access. Diversifying bank relationships lowers single-point-of-failure and bargaining risk.
Fraud, KYC, and data vendors
Risk-scoring, identity verification, and data enrichment vendors are highly specialized and sticky, with top providers claiming match rates above 95% in 2024, enabling pricing power.
Accuracy and coverage variance drives vendor selection; premium data sets and superior false-positive reduction justify higher fees and contract terms.
Deep API and workflow integration creates switching costs (months of projects), while volume commitments commonly unlock 10–25% discounts but reduce procurement flexibility.
- 95%+ match rates (top vendors)
- 10–25% volume discounts
- 3–9 month integration timelines
- High switching costs and vendor stickiness
Payment hardware and gateways
Supplier power: >80% card volume, hyperscalers, $10B BaaS
AppTech faces strong supplier power: Visa/Mastercard >80% card volume (2024) set fees and rules; hyperscalers (AWS 32%, Azure 21%, GCP 11%) raise switching costs; BaaS sponsors (~$10B market, 2024) and top risk/data vendors (95%+ match rates) command pricing; terminals (Verifone/Ingenico) and certification (EMV/PCI) add lock-in and costs.
| Supplier | 2024 stat | Impact |
|---|---|---|
| Card schemes | >80% volume | Fee/rule control |
| Hyperscalers | AWS32%/AZ21%/GCP11% | High switching cost |
| BaaS | $10B market | Pricing leverage |
What is included in the product
Detailed Word Document
Uncovers key drivers of competition, customer influence, supplier power, substitutes and entry barriers tailored exclusively for AppTech, identifying disruptive threats and strategic levers to protect market share; fully editable for reports, pitch decks, or investor materials.
Customizable Excel Spreadsheet
AppTech Porter's Five Forces delivers a concise one-sheet view with customizable pressure levels, instant spider/radar visualization, and a clean, deck-ready layout—no macros required, easy data swapping and duplicate tabs for rapid scenario or pre/post-regulation analysis.
Customers Bargaining Power
Merchant price sensitivity
SMBs and enterprises routinely shop MDRs, SaaS fees and chargeback costs—with 2024 global e-commerce at about $6.3 trillion, small MDR differences (avg ~1.5%) translate to material margin impact. Transparent pricing and frequent promotions boosted buyer leverage in 2024, enabling roughly 60% of merchants to seek renegotiation. High-volume merchants negotiate 20–35% lower fees, while bundled fraud tools and analytics reduce pure price focus.
Switching ease via APIs
Modern APIs and middleware lower integration friction and ease churn; the API management market reached about $8.2B in 2024 (MarketsandMarkets) as adoption scales. Postman’s 2024 State of the API found 97% of organizations using APIs, while ISO/ISV channels and turnkey connectors can cut migration time by roughly 30%, enabling rapid moves. Data portability rules and export tools expand buyer options, though embedded workflows and custom features raise stickiness.
Demand for reliability and uptime
Merchants demand near-zero downtime and rapid dispute resolution, with 99.99% uptime expectations in commerce platforms in 2024 (≈52.6 minutes annual downtime). SLAs and financial credits tied to service levels shift leverage toward buyers, often reducing vendor revenue on failures. Outage-driven reputational loss pressures pricing and support commitments, while demonstrably superior reliability permits vendors to command premium rates.
Enterprise customization needs
Large enterprise clients increasingly demand bespoke reporting, routing, and compliance features, driving custom builds that deepen vendor dependence while expanding negotiation levers; industry surveys in 2024 show the majority of large deals include some customization. RFP-driven procurement lets enterprises extract concessions on price, service levels, and IP; referenceability and co-innovation often reduce price but can be traded for longer-term contracts.
- Custom builds: higher switching costs
- RFPs: leverage for concessions
- Co-innovation: trade-off price vs referenceability
Multi-homing across providers
- >50% merchants multi-home (2024)
- Smart routing adoption +30% YoY (2024)
- Key battlegrounds: performance, uptime, value-add
Merchants drive fees down: >50% multi-home, ~60% renegotiate, top cuts 20–35%
Buyer power is high: 2024 e-commerce ~$6.3T and avg MDR ~1.5% make fee differences material; ~60% of merchants sought renegotiation. >50% of merchants multi-home (2024) and smart routing adoption +30% YoY reduce lock-in. Enterprises use RFPs and customization to extract concessions; top merchants negotiate 20–35% fee cuts.
| Metric | 2024 |
|---|---|
| Global e-commerce | $6.3T |
| Avg MDR | ~1.5% |
| Merchants renegotiating | ~60% |
| Multi-home rate | >50% |
| Smart routing growth | +30% YoY |
| Top merchant fee cuts | 20–35% |
Preview the Actual Deliverable
AppTech Porter's Five Forces Analysis
This preview shows the exact AppTech Porter's Five Forces Analysis you'll receive immediately after purchase—no placeholders or samples. The file is fully formatted, professionally written, and ready for download and use the moment you buy. You're viewing the final deliverable; purchase grants instant access to this same document.











