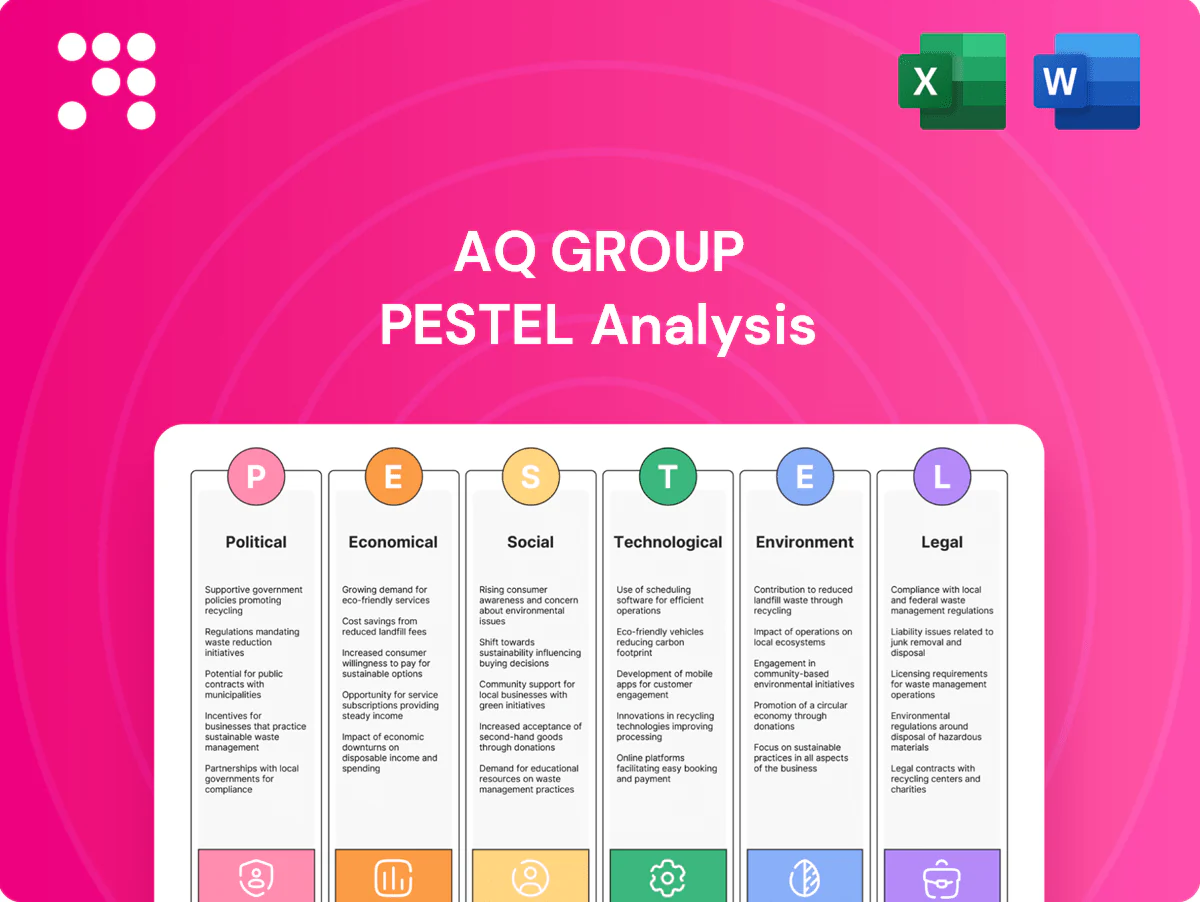
AQ Group PESTLE Analysis

Your Shortcut to Market Insight Starts Here
Discover how political shifts, economic cycles, social trends, technological advances, legal changes, and environmental pressures are shaping AQ Group's strategy and performance. This concise PESTLE snapshot highlights key external risks and opportunities. Purchase the full report to access detailed, actionable insights and ready-to-use analysis for investors and strategists.
Political factors

Trade policies and tariffs
Shifts in tariffs and trade agreements, exemplified by US Section 232 duties (25% on steel, 10% on aluminum) and retaliatory tariffs covering about $370bn of US-China trade, affect cross-border sourcing of metals, electronics and subassemblies. AQ Group can mitigate customs delays by diversifying suppliers and using bonded warehouses to defer duties, while participation in free-trade zones reduces landed costs and smooths delivery timing.
Energy and EV industrial policy
EU mandate for 100% zero-emission new car sales by 2035 and US IRA energy investments of roughly 369 billion USD drive demand for wiring harnesses, cabinets and inductive components as EVs reached ~14% of global new-car sales in 2023. Policy rollbacks or incentive cuts create order volatility; close alignment with OEM roadmaps and public tenders hedges these swings and secures backlog visibility.

Geopolitical supply risk
Geopolitical strain on copper (LME ~US$9,500/t in 2024), China-dominant rare earths (China ~85% refined share in 2023) and semiconductor export controls raise input risk for AQ Group; multi-region qualification and dual-sourcing, plus scenario planning and 3–6 months buffer inventory, mitigate sudden export bans and supply shocks.

Localization and content rules
Government localization rules reshape AQ Group plant footprint and supplier choices; US Inflation Reduction Act requires 40% North American battery component sourcing in 2024 (rising to 100% by 2027) and critical minerals thresholds moving from 40% in 2024 toward 80% by 2027, while qualifying buyers can access up to 7,500 USD EV tax credit.
- Compliance unlocks tax credits: up to 7,500 USD per vehicle
- IRA sourcing targets: 40% battery components (2024) → 100% (2027)
- Local content can win public contracts and tariffs relief
- Regional supplier partnerships speed certification and delivery
Public infrastructure spending
Power grid modernization expands AQ Groups addressable market as US Bipartisan Infrastructure Law earmarked about 65 billion USD for grid upgrades and global electricity network investment was roughly 250 billion USD (IEA, 2023); budget cycles and elections can delay contract awards and cash flows by quarters; clear pipeline visibility with utilities and EPCs enables better capacity planning and working capital alignment.
- Market size: US grid funding ~65bn USD
- Global network spend: ~250bn USD (IEA 2023)
- Risk: procurement delays can shift cash flows by quarters
Tariffs and localization raise risks as EV and grid spending drive wiring demand
Trade tariffs, export controls and localization rules (US Section 232; IRA sourcing 40%→100% by 2027) raise input and market-access risk for AQ Group, while EV policies (EU 2035 ban; EVs ~14% new sales in 2023) and US IRA (≈369bn USD) boost demand for wiring and components. Geopolitical supply concentration (copper ≈9,500 USD/t in 2024; China ~85% rare earths 2023) forces multi-region sourcing and 3–6 month buffers. Grid funding (US ~65bn USD; global ~250bn USD) expands opportunities but procurement delays strain cash flow.
| Policy | Metric | Impact |
|---|---|---|
| IRA | ≈369bn USD; $7,500 tax credit | Demand + localization |
| EV mandates | EU 2035; EVs ~14% (2023) | Product demand growth |
| Supply risk | Copper ~9,500 USD/t; China 85% rare earths | Sourcing risk |
| Grid spend | US ~65bn; global ~250bn | Addressable market |
What is included in the product
 Detailed Word Document
Explores how macro-environmental forces—Political, Economic, Social, Technological, Environmental and Legal—specifically impact AQ Group, combining data-backed trends and region/industry-specific examples to identify risks, opportunities and forward-looking scenarios for executives, investors and strategists.

 Customizable Excel Spreadsheet
A concise, visually segmented AQ Group PESTLE summary that relieves meeting prep by distilling external risks and opportunities into editable notes, ready to drop into presentations or share across teams for quick alignment.
Economic factors

Industrial demand cycles
Macro slowdowns and PMI swings directly affect AQ Groups order intake from OEMs and utilities, causing quarter-to-quarter volatility in volumes. AQ should balance exposure across automotive, industrial and energy segments to smooth revenue cycles. Flexible staffing models and modular production lines enable rapid capacity adjustments and lower fixed-cost risk. This mix reduces margin pressure during demand troughs.
Commodity price volatility
Copper (LME ~9,200 USD/t in 2024), aluminium (~2,300 USD/t) and steel (hot‑rolled coil ~800 USD/t) directly drive AQ Group BOMs and cost of goods sold. Index‑linked pricing and active hedging strategies smooth input cost swings and protect margins. Continuous value engineering and design‑to‑cost programs lower material intensity over time, improving resilience against price spikes.

FX and currency exposure
Multi-country operations create revenue-cost mismatches for AQ Group as sales in EUR/USD and costs in SEK expose margins to exchange swings; the Swedish krona traded near 11–12 SEK per USD in 2024, amplifying translation effects. Natural hedging through local sourcing and invoicing in local currencies plus forward contracts has stabilized earnings and reduced spot volatility impact. Transparent surcharge mechanisms in long-term contracts limit FX leakage by passing through significant currency moves to customers.

Interest rates and capex
Rising interest rates (Riksbank policy rate 4.00% in mid‑2025) increase financing costs for plant automation and working capital, prompting longer customer approval cycles and delayed installations; AQ Group can respond by prioritizing high‑ROIC automation projects and expanding vendor‑managed inventory to preserve cash.
- Impact: higher financing costs
- Effect: elongated sales cycles
- Action: prioritize high‑ROIC automation
- Action: use vendor‑managed inventory to conserve cash
Labor markets and productivity
Tight skilled labor markets pressure wages and delivery times for AQ Group; Sweden's unemployment rate was 7.3% in 2024 (Statistics Sweden), tightening recruitment for engineers. Lean practices and standardized work have raised throughput per headcount, with manufacturing productivity gains reported around 4–6% in 2024. Apprenticeships and nearshore hubs in Poland and Romania help mitigate shortages and shorten lead times.
- Skilled tightness: Sweden unemployment 7.3% (2024)
- Productivity lift: manufacturing +4–6% (2024)
- Mitigation: apprenticeships + nearshore hubs
Tariffs and localization raise risks as EV and grid spending drive wiring demand
Macro slowdowns cause OEM/utilities order volatility; diversify across auto, industrial, energy and use modular production to smooth volumes. Key inputs: copper 9,200 USD/t (2024), aluminium 2,300 USD/t, HRC ~800 USD/t—hedging and design‑to‑cost protect margins. FX: SEK ~11–12 per USD (2024) and Riksbank rate 4.00% (mid‑2025) raise financing costs; vendor inventory and high‑ROIC prioritization conserve cash.
| Metric | Value |
|---|---|
| Copper (LME 2024) | 9,200 USD/t |
| Aluminium (2024) | 2,300 USD/t |
| HRC (2024) | ~800 USD/t |
| SEK/USD (2024) | 11–12 |
| Riksbank rate | 4.00% (mid‑2025) |
| Sweden unemployment (2024) | 7.3% |
| Manufacturing productivity (2024) | +4–6% |
Preview the Actual Deliverable
AQ Group PESTLE Analysis
The preview shown here is the exact AQ Group PESTLE Analysis you’ll receive after purchase—fully formatted and ready to use. It covers Political, Economic, Social, Technological, Legal and Environmental factors with professional structure and concise insights. No placeholders or teasers; this is the final file you'll download immediately after payment.

Your Shortcut to Market Insight Starts Here
Discover how political shifts, economic cycles, social trends, technological advances, legal changes, and environmental pressures are shaping AQ Group's strategy and performance. This concise PESTLE snapshot highlights key external risks and opportunities. Purchase the full report to access detailed, actionable insights and ready-to-use analysis for investors and strategists.
Political factors
Trade policies and tariffs
Shifts in tariffs and trade agreements, exemplified by US Section 232 duties (25% on steel, 10% on aluminum) and retaliatory tariffs covering about $370bn of US-China trade, affect cross-border sourcing of metals, electronics and subassemblies. AQ Group can mitigate customs delays by diversifying suppliers and using bonded warehouses to defer duties, while participation in free-trade zones reduces landed costs and smooths delivery timing.
Energy and EV industrial policy
EU mandate for 100% zero-emission new car sales by 2035 and US IRA energy investments of roughly 369 billion USD drive demand for wiring harnesses, cabinets and inductive components as EVs reached ~14% of global new-car sales in 2023. Policy rollbacks or incentive cuts create order volatility; close alignment with OEM roadmaps and public tenders hedges these swings and secures backlog visibility.
Geopolitical supply risk
Geopolitical strain on copper (LME ~US$9,500/t in 2024), China-dominant rare earths (China ~85% refined share in 2023) and semiconductor export controls raise input risk for AQ Group; multi-region qualification and dual-sourcing, plus scenario planning and 3–6 months buffer inventory, mitigate sudden export bans and supply shocks.
Localization and content rules
Government localization rules reshape AQ Group plant footprint and supplier choices; US Inflation Reduction Act requires 40% North American battery component sourcing in 2024 (rising to 100% by 2027) and critical minerals thresholds moving from 40% in 2024 toward 80% by 2027, while qualifying buyers can access up to 7,500 USD EV tax credit.
- Compliance unlocks tax credits: up to 7,500 USD per vehicle
- IRA sourcing targets: 40% battery components (2024) → 100% (2027)
- Local content can win public contracts and tariffs relief
- Regional supplier partnerships speed certification and delivery
Public infrastructure spending
Power grid modernization expands AQ Groups addressable market as US Bipartisan Infrastructure Law earmarked about 65 billion USD for grid upgrades and global electricity network investment was roughly 250 billion USD (IEA, 2023); budget cycles and elections can delay contract awards and cash flows by quarters; clear pipeline visibility with utilities and EPCs enables better capacity planning and working capital alignment.
- Market size: US grid funding ~65bn USD
- Global network spend: ~250bn USD (IEA 2023)
- Risk: procurement delays can shift cash flows by quarters
Tariffs and localization raise risks as EV and grid spending drive wiring demand
Trade tariffs, export controls and localization rules (US Section 232; IRA sourcing 40%→100% by 2027) raise input and market-access risk for AQ Group, while EV policies (EU 2035 ban; EVs ~14% new sales in 2023) and US IRA (≈369bn USD) boost demand for wiring and components. Geopolitical supply concentration (copper ≈9,500 USD/t in 2024; China ~85% rare earths 2023) forces multi-region sourcing and 3–6 month buffers. Grid funding (US ~65bn USD; global ~250bn USD) expands opportunities but procurement delays strain cash flow.
| Policy | Metric | Impact |
|---|---|---|
| IRA | ≈369bn USD; $7,500 tax credit | Demand + localization |
| EV mandates | EU 2035; EVs ~14% (2023) | Product demand growth |
| Supply risk | Copper ~9,500 USD/t; China 85% rare earths | Sourcing risk |
| Grid spend | US ~65bn; global ~250bn | Addressable market |
What is included in the product
Detailed Word Document
Explores how macro-environmental forces—Political, Economic, Social, Technological, Environmental and Legal—specifically impact AQ Group, combining data-backed trends and region/industry-specific examples to identify risks, opportunities and forward-looking scenarios for executives, investors and strategists.
Customizable Excel Spreadsheet
A concise, visually segmented AQ Group PESTLE summary that relieves meeting prep by distilling external risks and opportunities into editable notes, ready to drop into presentations or share across teams for quick alignment.
Economic factors
Industrial demand cycles
Macro slowdowns and PMI swings directly affect AQ Groups order intake from OEMs and utilities, causing quarter-to-quarter volatility in volumes. AQ should balance exposure across automotive, industrial and energy segments to smooth revenue cycles. Flexible staffing models and modular production lines enable rapid capacity adjustments and lower fixed-cost risk. This mix reduces margin pressure during demand troughs.
Commodity price volatility
Copper (LME ~9,200 USD/t in 2024), aluminium (~2,300 USD/t) and steel (hot‑rolled coil ~800 USD/t) directly drive AQ Group BOMs and cost of goods sold. Index‑linked pricing and active hedging strategies smooth input cost swings and protect margins. Continuous value engineering and design‑to‑cost programs lower material intensity over time, improving resilience against price spikes.
FX and currency exposure
Multi-country operations create revenue-cost mismatches for AQ Group as sales in EUR/USD and costs in SEK expose margins to exchange swings; the Swedish krona traded near 11–12 SEK per USD in 2024, amplifying translation effects. Natural hedging through local sourcing and invoicing in local currencies plus forward contracts has stabilized earnings and reduced spot volatility impact. Transparent surcharge mechanisms in long-term contracts limit FX leakage by passing through significant currency moves to customers.
Interest rates and capex
Rising interest rates (Riksbank policy rate 4.00% in mid‑2025) increase financing costs for plant automation and working capital, prompting longer customer approval cycles and delayed installations; AQ Group can respond by prioritizing high‑ROIC automation projects and expanding vendor‑managed inventory to preserve cash.
- Impact: higher financing costs
- Effect: elongated sales cycles
- Action: prioritize high‑ROIC automation
- Action: use vendor‑managed inventory to conserve cash
Labor markets and productivity
Tight skilled labor markets pressure wages and delivery times for AQ Group; Sweden's unemployment rate was 7.3% in 2024 (Statistics Sweden), tightening recruitment for engineers. Lean practices and standardized work have raised throughput per headcount, with manufacturing productivity gains reported around 4–6% in 2024. Apprenticeships and nearshore hubs in Poland and Romania help mitigate shortages and shorten lead times.
- Skilled tightness: Sweden unemployment 7.3% (2024)
- Productivity lift: manufacturing +4–6% (2024)
- Mitigation: apprenticeships + nearshore hubs
Tariffs and localization raise risks as EV and grid spending drive wiring demand
Macro slowdowns cause OEM/utilities order volatility; diversify across auto, industrial, energy and use modular production to smooth volumes. Key inputs: copper 9,200 USD/t (2024), aluminium 2,300 USD/t, HRC ~800 USD/t—hedging and design‑to‑cost protect margins. FX: SEK ~11–12 per USD (2024) and Riksbank rate 4.00% (mid‑2025) raise financing costs; vendor inventory and high‑ROIC prioritization conserve cash.
| Metric | Value |
|---|---|
| Copper (LME 2024) | 9,200 USD/t |
| Aluminium (2024) | 2,300 USD/t |
| HRC (2024) | ~800 USD/t |
| SEK/USD (2024) | 11–12 |
| Riksbank rate | 4.00% (mid‑2025) |
| Sweden unemployment (2024) | 7.3% |
| Manufacturing productivity (2024) | +4–6% |
Preview the Actual Deliverable
AQ Group PESTLE Analysis
The preview shown here is the exact AQ Group PESTLE Analysis you’ll receive after purchase—fully formatted and ready to use. It covers Political, Economic, Social, Technological, Legal and Environmental factors with professional structure and concise insights. No placeholders or teasers; this is the final file you'll download immediately after payment.
Original: $10.00
-65%$10.00
$3.50Description
Your Shortcut to Market Insight Starts Here
Discover how political shifts, economic cycles, social trends, technological advances, legal changes, and environmental pressures are shaping AQ Group's strategy and performance. This concise PESTLE snapshot highlights key external risks and opportunities. Purchase the full report to access detailed, actionable insights and ready-to-use analysis for investors and strategists.
Political factors
Trade policies and tariffs
Shifts in tariffs and trade agreements, exemplified by US Section 232 duties (25% on steel, 10% on aluminum) and retaliatory tariffs covering about $370bn of US-China trade, affect cross-border sourcing of metals, electronics and subassemblies. AQ Group can mitigate customs delays by diversifying suppliers and using bonded warehouses to defer duties, while participation in free-trade zones reduces landed costs and smooths delivery timing.
Energy and EV industrial policy
EU mandate for 100% zero-emission new car sales by 2035 and US IRA energy investments of roughly 369 billion USD drive demand for wiring harnesses, cabinets and inductive components as EVs reached ~14% of global new-car sales in 2023. Policy rollbacks or incentive cuts create order volatility; close alignment with OEM roadmaps and public tenders hedges these swings and secures backlog visibility.
Geopolitical supply risk
Geopolitical strain on copper (LME ~US$9,500/t in 2024), China-dominant rare earths (China ~85% refined share in 2023) and semiconductor export controls raise input risk for AQ Group; multi-region qualification and dual-sourcing, plus scenario planning and 3–6 months buffer inventory, mitigate sudden export bans and supply shocks.
Localization and content rules
Government localization rules reshape AQ Group plant footprint and supplier choices; US Inflation Reduction Act requires 40% North American battery component sourcing in 2024 (rising to 100% by 2027) and critical minerals thresholds moving from 40% in 2024 toward 80% by 2027, while qualifying buyers can access up to 7,500 USD EV tax credit.
- Compliance unlocks tax credits: up to 7,500 USD per vehicle
- IRA sourcing targets: 40% battery components (2024) → 100% (2027)
- Local content can win public contracts and tariffs relief
- Regional supplier partnerships speed certification and delivery
Public infrastructure spending
Power grid modernization expands AQ Groups addressable market as US Bipartisan Infrastructure Law earmarked about 65 billion USD for grid upgrades and global electricity network investment was roughly 250 billion USD (IEA, 2023); budget cycles and elections can delay contract awards and cash flows by quarters; clear pipeline visibility with utilities and EPCs enables better capacity planning and working capital alignment.
- Market size: US grid funding ~65bn USD
- Global network spend: ~250bn USD (IEA 2023)
- Risk: procurement delays can shift cash flows by quarters
Tariffs and localization raise risks as EV and grid spending drive wiring demand
Trade tariffs, export controls and localization rules (US Section 232; IRA sourcing 40%→100% by 2027) raise input and market-access risk for AQ Group, while EV policies (EU 2035 ban; EVs ~14% new sales in 2023) and US IRA (≈369bn USD) boost demand for wiring and components. Geopolitical supply concentration (copper ≈9,500 USD/t in 2024; China ~85% rare earths 2023) forces multi-region sourcing and 3–6 month buffers. Grid funding (US ~65bn USD; global ~250bn USD) expands opportunities but procurement delays strain cash flow.
| Policy | Metric | Impact |
|---|---|---|
| IRA | ≈369bn USD; $7,500 tax credit | Demand + localization |
| EV mandates | EU 2035; EVs ~14% (2023) | Product demand growth |
| Supply risk | Copper ~9,500 USD/t; China 85% rare earths | Sourcing risk |
| Grid spend | US ~65bn; global ~250bn | Addressable market |
What is included in the product
Detailed Word Document
Explores how macro-environmental forces—Political, Economic, Social, Technological, Environmental and Legal—specifically impact AQ Group, combining data-backed trends and region/industry-specific examples to identify risks, opportunities and forward-looking scenarios for executives, investors and strategists.
Customizable Excel Spreadsheet
A concise, visually segmented AQ Group PESTLE summary that relieves meeting prep by distilling external risks and opportunities into editable notes, ready to drop into presentations or share across teams for quick alignment.
Economic factors
Industrial demand cycles
Macro slowdowns and PMI swings directly affect AQ Groups order intake from OEMs and utilities, causing quarter-to-quarter volatility in volumes. AQ should balance exposure across automotive, industrial and energy segments to smooth revenue cycles. Flexible staffing models and modular production lines enable rapid capacity adjustments and lower fixed-cost risk. This mix reduces margin pressure during demand troughs.
Commodity price volatility
Copper (LME ~9,200 USD/t in 2024), aluminium (~2,300 USD/t) and steel (hot‑rolled coil ~800 USD/t) directly drive AQ Group BOMs and cost of goods sold. Index‑linked pricing and active hedging strategies smooth input cost swings and protect margins. Continuous value engineering and design‑to‑cost programs lower material intensity over time, improving resilience against price spikes.
FX and currency exposure
Multi-country operations create revenue-cost mismatches for AQ Group as sales in EUR/USD and costs in SEK expose margins to exchange swings; the Swedish krona traded near 11–12 SEK per USD in 2024, amplifying translation effects. Natural hedging through local sourcing and invoicing in local currencies plus forward contracts has stabilized earnings and reduced spot volatility impact. Transparent surcharge mechanisms in long-term contracts limit FX leakage by passing through significant currency moves to customers.
Interest rates and capex
Rising interest rates (Riksbank policy rate 4.00% in mid‑2025) increase financing costs for plant automation and working capital, prompting longer customer approval cycles and delayed installations; AQ Group can respond by prioritizing high‑ROIC automation projects and expanding vendor‑managed inventory to preserve cash.
- Impact: higher financing costs
- Effect: elongated sales cycles
- Action: prioritize high‑ROIC automation
- Action: use vendor‑managed inventory to conserve cash
Labor markets and productivity
Tight skilled labor markets pressure wages and delivery times for AQ Group; Sweden's unemployment rate was 7.3% in 2024 (Statistics Sweden), tightening recruitment for engineers. Lean practices and standardized work have raised throughput per headcount, with manufacturing productivity gains reported around 4–6% in 2024. Apprenticeships and nearshore hubs in Poland and Romania help mitigate shortages and shorten lead times.
- Skilled tightness: Sweden unemployment 7.3% (2024)
- Productivity lift: manufacturing +4–6% (2024)
- Mitigation: apprenticeships + nearshore hubs
Tariffs and localization raise risks as EV and grid spending drive wiring demand
Macro slowdowns cause OEM/utilities order volatility; diversify across auto, industrial, energy and use modular production to smooth volumes. Key inputs: copper 9,200 USD/t (2024), aluminium 2,300 USD/t, HRC ~800 USD/t—hedging and design‑to‑cost protect margins. FX: SEK ~11–12 per USD (2024) and Riksbank rate 4.00% (mid‑2025) raise financing costs; vendor inventory and high‑ROIC prioritization conserve cash.
| Metric | Value |
|---|---|
| Copper (LME 2024) | 9,200 USD/t |
| Aluminium (2024) | 2,300 USD/t |
| HRC (2024) | ~800 USD/t |
| SEK/USD (2024) | 11–12 |
| Riksbank rate | 4.00% (mid‑2025) |
| Sweden unemployment (2024) | 7.3% |
| Manufacturing productivity (2024) | +4–6% |
Preview the Actual Deliverable
AQ Group PESTLE Analysis
The preview shown here is the exact AQ Group PESTLE Analysis you’ll receive after purchase—fully formatted and ready to use. It covers Political, Economic, Social, Technological, Legal and Environmental factors with professional structure and concise insights. No placeholders or teasers; this is the final file you'll download immediately after payment.











