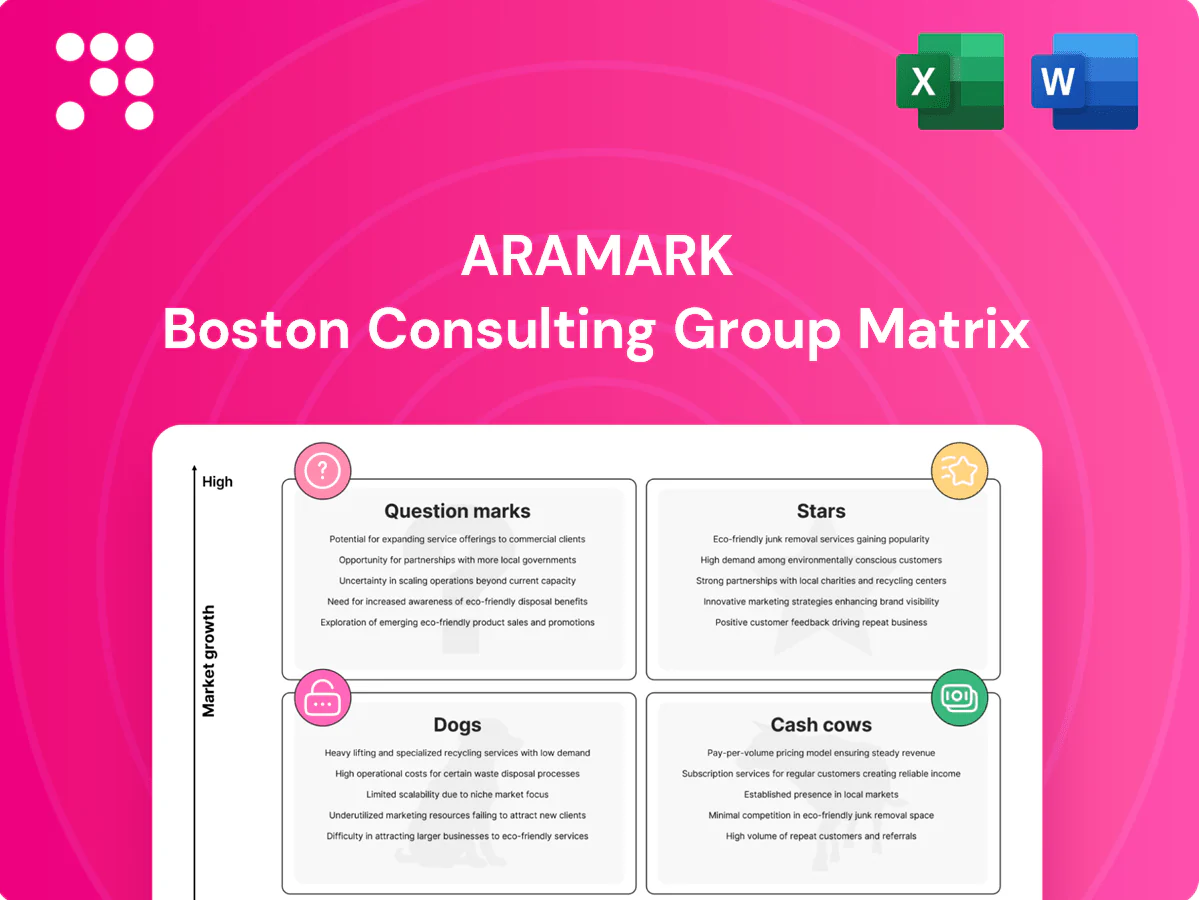
Aramark Boston Consulting Group Matrix

Unlock Strategic Clarity
Want a clear snapshot of Aramark’s portfolio—what’s a Star, Cash Cow, Dog, or Question Mark—and what to do about it? This preview scratches the surface; the full BCG Matrix gives you quadrant-by-quadrant placements, data-backed recommendations, and a strategic playbook tailored to Aramark’s market moves. Skip the guesswork: purchase the complete report for ready-to-use Word and Excel files, plus actionable guidance you can present and deploy right away.
Stars

Healthcare dining & facilities
Aramark’s healthcare dining is entrenched in hospitals as outsourcing demand accelerates; healthcare segment momentum helped drive company revenue to about $17.1 billion in fiscal 2024, underscoring scale and share stability. High patient satisfaction and compliance metrics support stickiness and share retention, while hospital foodservice outsourcing trends point to continued tailwinds. Continued investment in menu innovation, clinical nutrition and tech-driven labor efficiency is required to sustain the lead.
Sports & entertainment venues
Stadium and arena services are roaring back as live-sport crowds resume — NFL average attendance around 66,000 per game in 2023 — and fan spend is trending up. Aramark holds marquee venue contracts with strong renewal visibility and growing share in premium suites. Mobile ordering and dynamic menus are expanding ticket-size and frequency. Continue targeted capex into tech and premium concepts to lock share.

Higher ed dining ecosystems
Higher ed dining ecosystems sit as Stars for Aramark as universities demand flexible meal plans, local sourcing, and digital ordering; Aramark already operates on 1,000+ campus locations, positioning it to capture rising student spend. Student expectations drive growth and upsell as on-campus foodservice spend grows with enrollment and convenience trends. Doubling down on personalization, allergen-safe programs, and sustainability will defend share and enable premium pricing.

Integrated facilities management for enterprises
Integrated facilities management is a Star for Aramark as large employers consolidate vendors to single IFM partners; the IFM market was estimated at about $110 billion in 2024, and Aramark’s scale and safety record position it to capture growth. Cross-sell between cleaning, maintenance, and food drives higher wallet share, and Aramark’s analytics and investments in smart-building tech can cement leadership as the category expands.
- Scale: Aramark breadth enables enterprise IFM wins
- Cross-sell: cleaning + maintenance + food increases revenue per client
- Tech: smart-building investments lock retention
- Market: IFM ~ $110B (2024)
Data-enabled retail inside client sites
Stars: Data-enabled retail inside client sites — grab-and-go, micro-markets and cashless kiosks are scaling fast and are outpacing traditional cafeterias in share gains as onsite convenience demand rises in 2024. Aramark’s closed-loop data lets merchandisers tune assortment and cut spoilage, turning higher velocity into margin upside. Continued funding for rollout and UX is required to convert fast growth into a durable lead.
Healthcare dining, stadium rebound and IFM growth — invest in tech, menu & UX
Aramark Stars: healthcare dining fuels scale with ~$17.1B revenue in FY2024 and high hospital stickiness; stadiums rebounding (NFL avg attendance ~66,000 in 2023) boost venue spend; higher ed (1,000+ campuses) and IFM (market ~$110B in 2024) show strong growth — invest in tech, menu innovation and UX to lock share.
| Metric | Value |
|---|---|
| Revenue (FY2024) | $17.1B |
| NFL avg attendance (2023) | ~66,000 |
| Higher ed locations | 1,000+ |
| IFM market (2024) | $110B |
What is included in the product
 Detailed Word Document
Aramark BCG Matrix mapping Stars, Cash Cows, Question Marks and Dogs with strategic invest, hold or divest guidance.

 Customizable Excel Spreadsheet
One-page Aramark BCG Matrix placing each business unit in a quadrant to cut analysis time and align leadership fast.
Cash Cows

K–12 food service contracts
K–12 food service contracts are mature, recurring and compliance-heavy with sticky district relationships; US K–12 enrollment is about 50.5 million (2023–24 NCES), underpinning predictable volume and stable menu cycles. Margins improve via centralized procurement and waste control, lowering cost per meal and boosting unit economics. Maintain quality and efficiency; avoid overspending on promotions that erode steady margins.
Corporate dining in legacy accounts
Corporate dining in legacy accounts shows stable headcounts and predictable demand; in 2024 renewal rates for established workplace contracts often exceed 80% with operating margins typically in the high single digits. Low market growth but high renewals mean process discipline and labor planning drive profitability. Milk cash flows; reinvest selectively to increase throughput and reduce unit labor hours.

Uniform rental & maintenance for core trades
Blue-collar sectors need reliable workwear week in, week out, making Aramark’s uniform rental for core trades a high-stability cash cow; route density and plant utilization drive down unit costs and bolster margins. Switching costs and embedded logistics keep churn low, supporting predictable recurring revenue. Tight capex and optimized routing maximize yield per route and maintain strong free cash flow.

Public sector facilities upkeep
Public sector facilities upkeep sits squarely in Aramark's Cash Cows: municipal and institutional clients rarely churn vendors, contracts commonly run 5–10 years, and built-in price escalators (CPI ~3% in 2024) plus operational efficiencies deliver predictable, high-margin cash flow. Maintaining SLAs and safety is critical; promotional spend is minimal versus commercial segments.
- Low churn: long tenures 5–10 yrs
- Steady cash: CPI ~3% escalators (2024)
- High margin via efficiency
- Focus: SLAs & safety; minimal promo spend
Catering for recurring institutional events
Catering for recurring institutional events
Commencements, hospital galas and corporate town halls are calendar staples with annual predictability, enabling forecastable demand and repurposable menus. Ops teams are already trained and overhead is shared across sites, improving margin leverage; keep menus refreshed to maintain renewal cycles and avoid commoditization.- Annual events: predictable demand
- Repurposable menus: lower cost per event
- Shared ops overhead: higher margins
- Menu refresh required to sustain renewals
Stable high-margin cash: 50.5M K-12, >80% corporate renewals, 5-10yr public contracts
K–12 food service (50.5M students 2023–24 NCES) and legacy corporate dining (renewal >80% 2024) generate stable, high-margin cash flows via scale, centralized procurement and low churn. Uniform rentals and public facilities (5–10 yr contracts) add predictable recurring revenue; CPI escalators ~3% (2024) protect margins.
| Segment | Key metric | 2023–24/2024 |
|---|---|---|
| K–12 | Enrollment | 50.5M |
| Corporate | Renewal rate | >80% |
| Public | Contract length/CPI | 5–10 yr / ~3% |
What You’re Viewing Is Included
Aramark BCG Matrix
The file you're previewing here is the exact BCG Matrix document you'll receive after purchase—no watermarks, no demo text, just the finished, fully formatted report. It's crafted for clarity and strategic use, ready to edit, print, or present to stakeholders. Buy once and download immediately; what you see is what you get, designed by strategy pros for instant deployment.

Unlock Strategic Clarity
Want a clear snapshot of Aramark’s portfolio—what’s a Star, Cash Cow, Dog, or Question Mark—and what to do about it? This preview scratches the surface; the full BCG Matrix gives you quadrant-by-quadrant placements, data-backed recommendations, and a strategic playbook tailored to Aramark’s market moves. Skip the guesswork: purchase the complete report for ready-to-use Word and Excel files, plus actionable guidance you can present and deploy right away.
Stars
Healthcare dining & facilities
Aramark’s healthcare dining is entrenched in hospitals as outsourcing demand accelerates; healthcare segment momentum helped drive company revenue to about $17.1 billion in fiscal 2024, underscoring scale and share stability. High patient satisfaction and compliance metrics support stickiness and share retention, while hospital foodservice outsourcing trends point to continued tailwinds. Continued investment in menu innovation, clinical nutrition and tech-driven labor efficiency is required to sustain the lead.
Sports & entertainment venues
Stadium and arena services are roaring back as live-sport crowds resume — NFL average attendance around 66,000 per game in 2023 — and fan spend is trending up. Aramark holds marquee venue contracts with strong renewal visibility and growing share in premium suites. Mobile ordering and dynamic menus are expanding ticket-size and frequency. Continue targeted capex into tech and premium concepts to lock share.
Higher ed dining ecosystems
Higher ed dining ecosystems sit as Stars for Aramark as universities demand flexible meal plans, local sourcing, and digital ordering; Aramark already operates on 1,000+ campus locations, positioning it to capture rising student spend. Student expectations drive growth and upsell as on-campus foodservice spend grows with enrollment and convenience trends. Doubling down on personalization, allergen-safe programs, and sustainability will defend share and enable premium pricing.
Integrated facilities management for enterprises
Integrated facilities management is a Star for Aramark as large employers consolidate vendors to single IFM partners; the IFM market was estimated at about $110 billion in 2024, and Aramark’s scale and safety record position it to capture growth. Cross-sell between cleaning, maintenance, and food drives higher wallet share, and Aramark’s analytics and investments in smart-building tech can cement leadership as the category expands.
- Scale: Aramark breadth enables enterprise IFM wins
- Cross-sell: cleaning + maintenance + food increases revenue per client
- Tech: smart-building investments lock retention
- Market: IFM ~ $110B (2024)
Data-enabled retail inside client sites
Stars: Data-enabled retail inside client sites — grab-and-go, micro-markets and cashless kiosks are scaling fast and are outpacing traditional cafeterias in share gains as onsite convenience demand rises in 2024. Aramark’s closed-loop data lets merchandisers tune assortment and cut spoilage, turning higher velocity into margin upside. Continued funding for rollout and UX is required to convert fast growth into a durable lead.
Healthcare dining, stadium rebound and IFM growth — invest in tech, menu & UX
Aramark Stars: healthcare dining fuels scale with ~$17.1B revenue in FY2024 and high hospital stickiness; stadiums rebounding (NFL avg attendance ~66,000 in 2023) boost venue spend; higher ed (1,000+ campuses) and IFM (market ~$110B in 2024) show strong growth — invest in tech, menu innovation and UX to lock share.
| Metric | Value |
|---|---|
| Revenue (FY2024) | $17.1B |
| NFL avg attendance (2023) | ~66,000 |
| Higher ed locations | 1,000+ |
| IFM market (2024) | $110B |
What is included in the product
Detailed Word Document
Aramark BCG Matrix mapping Stars, Cash Cows, Question Marks and Dogs with strategic invest, hold or divest guidance.
Customizable Excel Spreadsheet
One-page Aramark BCG Matrix placing each business unit in a quadrant to cut analysis time and align leadership fast.
Cash Cows
K–12 food service contracts
K–12 food service contracts are mature, recurring and compliance-heavy with sticky district relationships; US K–12 enrollment is about 50.5 million (2023–24 NCES), underpinning predictable volume and stable menu cycles. Margins improve via centralized procurement and waste control, lowering cost per meal and boosting unit economics. Maintain quality and efficiency; avoid overspending on promotions that erode steady margins.
Corporate dining in legacy accounts
Corporate dining in legacy accounts shows stable headcounts and predictable demand; in 2024 renewal rates for established workplace contracts often exceed 80% with operating margins typically in the high single digits. Low market growth but high renewals mean process discipline and labor planning drive profitability. Milk cash flows; reinvest selectively to increase throughput and reduce unit labor hours.
Uniform rental & maintenance for core trades
Blue-collar sectors need reliable workwear week in, week out, making Aramark’s uniform rental for core trades a high-stability cash cow; route density and plant utilization drive down unit costs and bolster margins. Switching costs and embedded logistics keep churn low, supporting predictable recurring revenue. Tight capex and optimized routing maximize yield per route and maintain strong free cash flow.
Public sector facilities upkeep
Public sector facilities upkeep sits squarely in Aramark's Cash Cows: municipal and institutional clients rarely churn vendors, contracts commonly run 5–10 years, and built-in price escalators (CPI ~3% in 2024) plus operational efficiencies deliver predictable, high-margin cash flow. Maintaining SLAs and safety is critical; promotional spend is minimal versus commercial segments.
- Low churn: long tenures 5–10 yrs
- Steady cash: CPI ~3% escalators (2024)
- High margin via efficiency
- Focus: SLAs & safety; minimal promo spend
Catering for recurring institutional events
Catering for recurring institutional events
Commencements, hospital galas and corporate town halls are calendar staples with annual predictability, enabling forecastable demand and repurposable menus. Ops teams are already trained and overhead is shared across sites, improving margin leverage; keep menus refreshed to maintain renewal cycles and avoid commoditization.- Annual events: predictable demand
- Repurposable menus: lower cost per event
- Shared ops overhead: higher margins
- Menu refresh required to sustain renewals
Stable high-margin cash: 50.5M K-12, >80% corporate renewals, 5-10yr public contracts
K–12 food service (50.5M students 2023–24 NCES) and legacy corporate dining (renewal >80% 2024) generate stable, high-margin cash flows via scale, centralized procurement and low churn. Uniform rentals and public facilities (5–10 yr contracts) add predictable recurring revenue; CPI escalators ~3% (2024) protect margins.
| Segment | Key metric | 2023–24/2024 |
|---|---|---|
| K–12 | Enrollment | 50.5M |
| Corporate | Renewal rate | >80% |
| Public | Contract length/CPI | 5–10 yr / ~3% |
What You’re Viewing Is Included
Aramark BCG Matrix
The file you're previewing here is the exact BCG Matrix document you'll receive after purchase—no watermarks, no demo text, just the finished, fully formatted report. It's crafted for clarity and strategic use, ready to edit, print, or present to stakeholders. Buy once and download immediately; what you see is what you get, designed by strategy pros for instant deployment.
Description
Unlock Strategic Clarity
Want a clear snapshot of Aramark’s portfolio—what’s a Star, Cash Cow, Dog, or Question Mark—and what to do about it? This preview scratches the surface; the full BCG Matrix gives you quadrant-by-quadrant placements, data-backed recommendations, and a strategic playbook tailored to Aramark’s market moves. Skip the guesswork: purchase the complete report for ready-to-use Word and Excel files, plus actionable guidance you can present and deploy right away.
Stars
Healthcare dining & facilities
Aramark’s healthcare dining is entrenched in hospitals as outsourcing demand accelerates; healthcare segment momentum helped drive company revenue to about $17.1 billion in fiscal 2024, underscoring scale and share stability. High patient satisfaction and compliance metrics support stickiness and share retention, while hospital foodservice outsourcing trends point to continued tailwinds. Continued investment in menu innovation, clinical nutrition and tech-driven labor efficiency is required to sustain the lead.
Sports & entertainment venues
Stadium and arena services are roaring back as live-sport crowds resume — NFL average attendance around 66,000 per game in 2023 — and fan spend is trending up. Aramark holds marquee venue contracts with strong renewal visibility and growing share in premium suites. Mobile ordering and dynamic menus are expanding ticket-size and frequency. Continue targeted capex into tech and premium concepts to lock share.
Higher ed dining ecosystems
Higher ed dining ecosystems sit as Stars for Aramark as universities demand flexible meal plans, local sourcing, and digital ordering; Aramark already operates on 1,000+ campus locations, positioning it to capture rising student spend. Student expectations drive growth and upsell as on-campus foodservice spend grows with enrollment and convenience trends. Doubling down on personalization, allergen-safe programs, and sustainability will defend share and enable premium pricing.
Integrated facilities management for enterprises
Integrated facilities management is a Star for Aramark as large employers consolidate vendors to single IFM partners; the IFM market was estimated at about $110 billion in 2024, and Aramark’s scale and safety record position it to capture growth. Cross-sell between cleaning, maintenance, and food drives higher wallet share, and Aramark’s analytics and investments in smart-building tech can cement leadership as the category expands.
- Scale: Aramark breadth enables enterprise IFM wins
- Cross-sell: cleaning + maintenance + food increases revenue per client
- Tech: smart-building investments lock retention
- Market: IFM ~ $110B (2024)
Data-enabled retail inside client sites
Stars: Data-enabled retail inside client sites — grab-and-go, micro-markets and cashless kiosks are scaling fast and are outpacing traditional cafeterias in share gains as onsite convenience demand rises in 2024. Aramark’s closed-loop data lets merchandisers tune assortment and cut spoilage, turning higher velocity into margin upside. Continued funding for rollout and UX is required to convert fast growth into a durable lead.
Healthcare dining, stadium rebound and IFM growth — invest in tech, menu & UX
Aramark Stars: healthcare dining fuels scale with ~$17.1B revenue in FY2024 and high hospital stickiness; stadiums rebounding (NFL avg attendance ~66,000 in 2023) boost venue spend; higher ed (1,000+ campuses) and IFM (market ~$110B in 2024) show strong growth — invest in tech, menu innovation and UX to lock share.
| Metric | Value |
|---|---|
| Revenue (FY2024) | $17.1B |
| NFL avg attendance (2023) | ~66,000 |
| Higher ed locations | 1,000+ |
| IFM market (2024) | $110B |
What is included in the product
Detailed Word Document
Aramark BCG Matrix mapping Stars, Cash Cows, Question Marks and Dogs with strategic invest, hold or divest guidance.
Customizable Excel Spreadsheet
One-page Aramark BCG Matrix placing each business unit in a quadrant to cut analysis time and align leadership fast.
Cash Cows
K–12 food service contracts
K–12 food service contracts are mature, recurring and compliance-heavy with sticky district relationships; US K–12 enrollment is about 50.5 million (2023–24 NCES), underpinning predictable volume and stable menu cycles. Margins improve via centralized procurement and waste control, lowering cost per meal and boosting unit economics. Maintain quality and efficiency; avoid overspending on promotions that erode steady margins.
Corporate dining in legacy accounts
Corporate dining in legacy accounts shows stable headcounts and predictable demand; in 2024 renewal rates for established workplace contracts often exceed 80% with operating margins typically in the high single digits. Low market growth but high renewals mean process discipline and labor planning drive profitability. Milk cash flows; reinvest selectively to increase throughput and reduce unit labor hours.
Uniform rental & maintenance for core trades
Blue-collar sectors need reliable workwear week in, week out, making Aramark’s uniform rental for core trades a high-stability cash cow; route density and plant utilization drive down unit costs and bolster margins. Switching costs and embedded logistics keep churn low, supporting predictable recurring revenue. Tight capex and optimized routing maximize yield per route and maintain strong free cash flow.
Public sector facilities upkeep
Public sector facilities upkeep sits squarely in Aramark's Cash Cows: municipal and institutional clients rarely churn vendors, contracts commonly run 5–10 years, and built-in price escalators (CPI ~3% in 2024) plus operational efficiencies deliver predictable, high-margin cash flow. Maintaining SLAs and safety is critical; promotional spend is minimal versus commercial segments.
- Low churn: long tenures 5–10 yrs
- Steady cash: CPI ~3% escalators (2024)
- High margin via efficiency
- Focus: SLAs & safety; minimal promo spend
Catering for recurring institutional events
Catering for recurring institutional events
Commencements, hospital galas and corporate town halls are calendar staples with annual predictability, enabling forecastable demand and repurposable menus. Ops teams are already trained and overhead is shared across sites, improving margin leverage; keep menus refreshed to maintain renewal cycles and avoid commoditization.- Annual events: predictable demand
- Repurposable menus: lower cost per event
- Shared ops overhead: higher margins
- Menu refresh required to sustain renewals
Stable high-margin cash: 50.5M K-12, >80% corporate renewals, 5-10yr public contracts
K–12 food service (50.5M students 2023–24 NCES) and legacy corporate dining (renewal >80% 2024) generate stable, high-margin cash flows via scale, centralized procurement and low churn. Uniform rentals and public facilities (5–10 yr contracts) add predictable recurring revenue; CPI escalators ~3% (2024) protect margins.
| Segment | Key metric | 2023–24/2024 |
|---|---|---|
| K–12 | Enrollment | 50.5M |
| Corporate | Renewal rate | >80% |
| Public | Contract length/CPI | 5–10 yr / ~3% |
What You’re Viewing Is Included
Aramark BCG Matrix
The file you're previewing here is the exact BCG Matrix document you'll receive after purchase—no watermarks, no demo text, just the finished, fully formatted report. It's crafted for clarity and strategic use, ready to edit, print, or present to stakeholders. Buy once and download immediately; what you see is what you get, designed by strategy pros for instant deployment.











