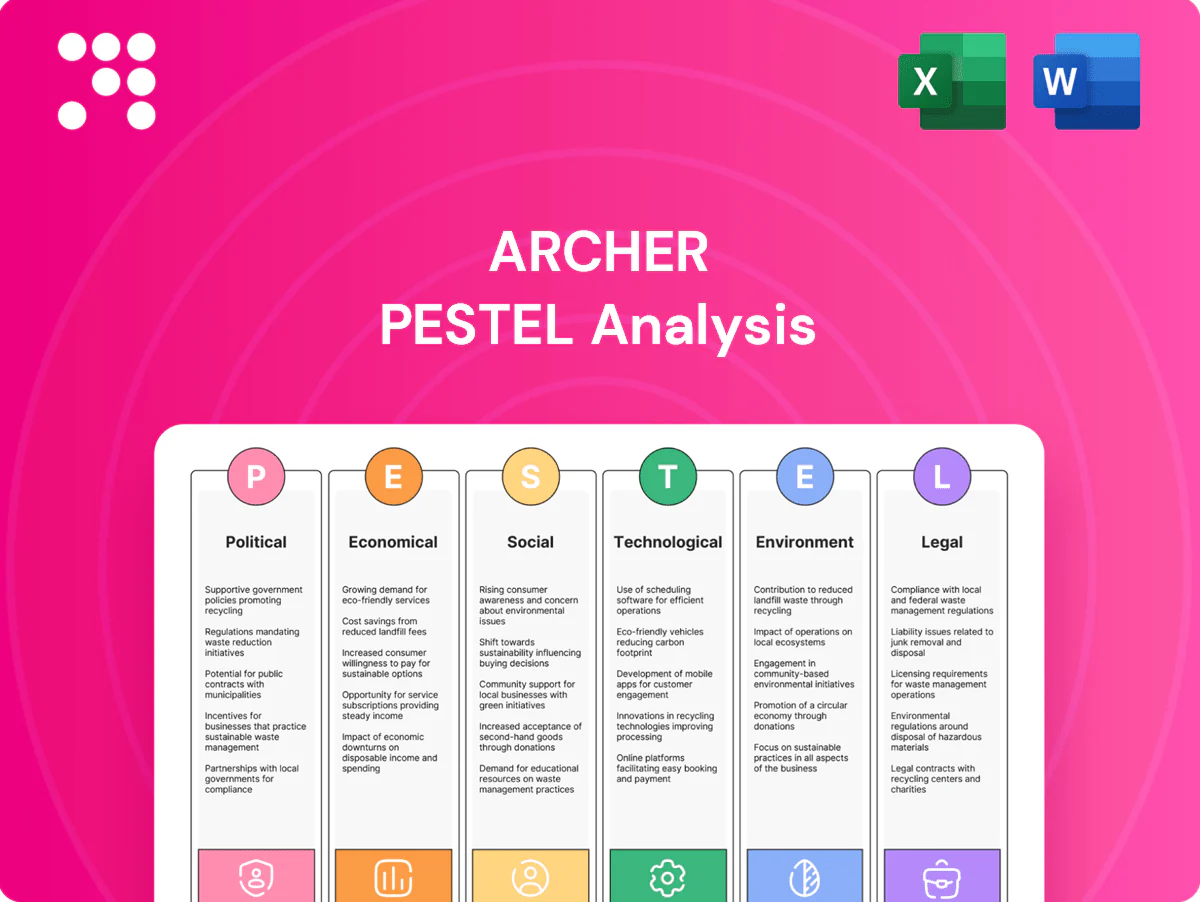
Archer PESTLE Analysis

Your Shortcut to Market Insight Starts Here
Unlock strategic clarity with our PESTLE Analysis of Archer—three- to five-year trends in politics, economics, social change, technology, law and environment are distilled into actionable insights. Ideal for investors, advisors, and strategists, it highlights regulatory risks and growth opportunities shaping Archer’s future. Purchase the full, editable report now for immediate, board-ready intelligence.
Political factors

Energy policy shifts
Government emphasis on hydrocarbons versus renewables drives drilling permits, subsidies and public investment—e.g., the US Inflation Reduction Act commits about $369 billion to clean energy, reshaping project pipelines. Policy reversals after elections can rapidly accelerate or halt well intervention and decommissioning programs. Constant monitoring and scenario planning align capacity to policy trajectories. Diversifying across jurisdictions (Archer operates in more than 15 countries) reduces single-country exposure.
Geopolitical stability
Regional tensions and conflicts disrupt field access, logistics, and crew safety, squeezing service continuity and margins. Sanctions regimes have proliferated since 2022, complicating customer, partner, and equipment flows. UCDP recorded 56 state-based conflicts in 2023, underscoring exposure. Archer needs robust country-risk screening, contingency routing, comprehensive insurance and tightened security protocols.

Regulatory licensing
Regulatory licensing—local content rules, work permits and service licenses—directly govern Archer’s market entry and contract eligibility, and shifts in offshore/onshore lease rounds and environmental approvals can delay demand timing. Archer, listed on Oslo Børs (ticker ARCHER), must maintain compliant vendor status and strong regulator relationships to protect commercial access. Proactive compliance reduces project delays and bid disqualifications, protecting revenue windows.

State-owned counterparties
National oil companies dominate many Archer target markets, holding about 80% of proven oil reserves, and they shape procurement terms and payment cycles; energy ministry mandates in 2024 continued to influence project scope and cadence. Building long-term partnerships and frame agreements helps stabilize utilization, while payment risk management is vital as 90–180 day payment delays were reported in fiscally constrained states in 2024.
- NOC dominance ~80% of proven reserves
- Payment delays reported 90–180 days (2024)
- Long-term partnerships stabilize utilization; prioritize payment-risk controls
Fiscal regimes
Policy, taxes and NOC deals shape oil markets; Norway tax ~78%
Energy policy, fiscal regimes and NOC procurement drive demand and pricing—Norway petroleum tax ~78% (2024), UK decommissioning ~£49bn (2023), US IRA ~$369bn shifts investment. Geopolitical conflicts and sanctions since 2022 raise access and logistics risk across 15+ countries. Strong compliance, country-risk screening and long-term NOC contracts mitigate exposure.
| Metric | Value |
|---|---|
| NOC share reserves | ~80% |
| Norway tax (2024) | ~78% |
| UK decommissioning (2023) | £49bn |
| US IRA | $369bn |
What is included in the product
 Detailed Word Document
Explores how external macro-environmental factors uniquely affect the Archer across six dimensions—Political, Economic, Social, Technological, Environmental, and Legal—backed by current data and trends to inform executives, support scenario planning, and highlight actionable threats and opportunities for strategy and funding.

 Customizable Excel Spreadsheet
Archer PESTLE Analysis delivers a concise, visually segmented summary of external risks and market factors that’s easily editable and shareable, ideal for quick team alignment, presentations, and strategic planning sessions.
Economic factors

Oil price volatility
Crude swings—Brent averaged about $84.5/bbl in 2024 and traded near $79/bbl in June 2025—drive E&P capex and directly affect demand for drilling, intervention and P&A services; higher prices unlock brownfield optimization work aligned with Archer’s portfolio, while downcycles shift activity to cost-out and integrity life-extension jobs; active hedging and flexible staffing preserve margins.
Cost inflation
Cost inflation in consumables, steel and logistics compresses Archer’s service margins where contracts lack escalators, forcing margin erosion on fixed-price projects.
Tight labor markets have driven up technician wages and training costs, increasing operating expense intensity and crew turnover risks.
Archer needs index-linked pricing clauses and long-term supply agreements to transfer input-price volatility, while operational efficiency and improved tool reliability can offset input-pressure and protect margins.

Currency movements
Mismatches between contract currencies and local costs expose Archer to FX risk as the US dollar remains dominant, involved in roughly 88% of global FX transactions (BIS), so USD-denominated contracts can hurt local‑currency cost bases. Depreciations of local currencies versus the dollar can cut reported revenue or inflate expenses; the DXY averaged about 104 in mid-2025, signaling persistent dollar strength. Natural hedging through matched currency cash flows reduces this exposure, while targeted hedging policies (forwards, swaps) have proven to stabilize project returns and earnings volatility.

Customer capex cycles
Operators rebalance capex toward drilling, workovers and decommissioning as reservoirs mature; global offshore decommissioning spend reached roughly USD 12bn in 2024, creating countercyclical demand for integrity work and P&A that offsets softer drilling revenues. Archer can smooth utilization by redeploying crews across service lines and by converting spot work into multi-year MSAs; long-term MSAs and a 2024 industry backlog near USD 20bn help buffer troughs in spot demand.
- Late-life focus: higher P&A/integrity share
- Countercyclical revenue: decommissioning ~USD 12bn (2024)
- Operational flexibility: crew redeployment across lines
- Risk buffer: MSAs + industry backlog ~USD 20bn
Industry consolidation
Accelerating E&P and service-sector M&A has concentrated spend, reducing tender volumes and shifting pricing power to larger buyers; industry reports showed a roughly 25–35% rise in deal activity in 2024 versus 2023, amplifying centralized procurement and stricter KPIs.
Archer must differentiate on demonstrated reliability, HSE performance and lower total cost of ownership to retain margins, while selective partnerships broaden service scope and improve bid competitiveness.
- Consolidation: 25–35% rise in 2024 deal activity
- Buyer power: centralized procurement with tighter KPIs
- Archer focus: reliability, HSE, TCO
- Strategy: selective partnerships to expand bids
Policy, taxes and NOC deals shape oil markets; Norway tax ~78%
Brent ~$84.5/bbl (2024) and ~$79/bbl (Jun‑2025) drive E&P capex and service mix; decommissioning ~$12bn (2024) and industry backlog ~$20bn smooth demand. Cost inflation, tight labour and USD strength (DXY ~104 mid‑2025; USD ~88% FX share) compress margins; consolidation (+25–35% deal activity 2024) increases buyer power. Index‑linked pricing, MSAs and hedging preserve returns.
| Metric | Value |
|---|---|
| Brent | $84.5 (2024) / $79 (Jun‑2025) |
| Decom spend | $12bn (2024) |
| DXY / USD share | ~104 / ~88% |
What You See Is What You Get
Archer PESTLE Analysis
The preview shown here is the exact Archer PESTLE Analysis document you’ll receive after purchase—fully formatted and ready to use. The layout, content, and structure visible are identical to the file you’ll download immediately after payment. No placeholders, no surprises—this is the final, professionally structured report.

Your Shortcut to Market Insight Starts Here
Unlock strategic clarity with our PESTLE Analysis of Archer—three- to five-year trends in politics, economics, social change, technology, law and environment are distilled into actionable insights. Ideal for investors, advisors, and strategists, it highlights regulatory risks and growth opportunities shaping Archer’s future. Purchase the full, editable report now for immediate, board-ready intelligence.
Political factors
Energy policy shifts
Government emphasis on hydrocarbons versus renewables drives drilling permits, subsidies and public investment—e.g., the US Inflation Reduction Act commits about $369 billion to clean energy, reshaping project pipelines. Policy reversals after elections can rapidly accelerate or halt well intervention and decommissioning programs. Constant monitoring and scenario planning align capacity to policy trajectories. Diversifying across jurisdictions (Archer operates in more than 15 countries) reduces single-country exposure.
Geopolitical stability
Regional tensions and conflicts disrupt field access, logistics, and crew safety, squeezing service continuity and margins. Sanctions regimes have proliferated since 2022, complicating customer, partner, and equipment flows. UCDP recorded 56 state-based conflicts in 2023, underscoring exposure. Archer needs robust country-risk screening, contingency routing, comprehensive insurance and tightened security protocols.
Regulatory licensing
Regulatory licensing—local content rules, work permits and service licenses—directly govern Archer’s market entry and contract eligibility, and shifts in offshore/onshore lease rounds and environmental approvals can delay demand timing. Archer, listed on Oslo Børs (ticker ARCHER), must maintain compliant vendor status and strong regulator relationships to protect commercial access. Proactive compliance reduces project delays and bid disqualifications, protecting revenue windows.
State-owned counterparties
National oil companies dominate many Archer target markets, holding about 80% of proven oil reserves, and they shape procurement terms and payment cycles; energy ministry mandates in 2024 continued to influence project scope and cadence. Building long-term partnerships and frame agreements helps stabilize utilization, while payment risk management is vital as 90–180 day payment delays were reported in fiscally constrained states in 2024.
- NOC dominance ~80% of proven reserves
- Payment delays reported 90–180 days (2024)
- Long-term partnerships stabilize utilization; prioritize payment-risk controls
Fiscal regimes
Policy, taxes and NOC deals shape oil markets; Norway tax ~78%
Energy policy, fiscal regimes and NOC procurement drive demand and pricing—Norway petroleum tax ~78% (2024), UK decommissioning ~£49bn (2023), US IRA ~$369bn shifts investment. Geopolitical conflicts and sanctions since 2022 raise access and logistics risk across 15+ countries. Strong compliance, country-risk screening and long-term NOC contracts mitigate exposure.
| Metric | Value |
|---|---|
| NOC share reserves | ~80% |
| Norway tax (2024) | ~78% |
| UK decommissioning (2023) | £49bn |
| US IRA | $369bn |
What is included in the product
Detailed Word Document
Explores how external macro-environmental factors uniquely affect the Archer across six dimensions—Political, Economic, Social, Technological, Environmental, and Legal—backed by current data and trends to inform executives, support scenario planning, and highlight actionable threats and opportunities for strategy and funding.
Customizable Excel Spreadsheet
Archer PESTLE Analysis delivers a concise, visually segmented summary of external risks and market factors that’s easily editable and shareable, ideal for quick team alignment, presentations, and strategic planning sessions.
Economic factors
Oil price volatility
Crude swings—Brent averaged about $84.5/bbl in 2024 and traded near $79/bbl in June 2025—drive E&P capex and directly affect demand for drilling, intervention and P&A services; higher prices unlock brownfield optimization work aligned with Archer’s portfolio, while downcycles shift activity to cost-out and integrity life-extension jobs; active hedging and flexible staffing preserve margins.
Cost inflation
Cost inflation in consumables, steel and logistics compresses Archer’s service margins where contracts lack escalators, forcing margin erosion on fixed-price projects.
Tight labor markets have driven up technician wages and training costs, increasing operating expense intensity and crew turnover risks.
Archer needs index-linked pricing clauses and long-term supply agreements to transfer input-price volatility, while operational efficiency and improved tool reliability can offset input-pressure and protect margins.
Currency movements
Mismatches between contract currencies and local costs expose Archer to FX risk as the US dollar remains dominant, involved in roughly 88% of global FX transactions (BIS), so USD-denominated contracts can hurt local‑currency cost bases. Depreciations of local currencies versus the dollar can cut reported revenue or inflate expenses; the DXY averaged about 104 in mid-2025, signaling persistent dollar strength. Natural hedging through matched currency cash flows reduces this exposure, while targeted hedging policies (forwards, swaps) have proven to stabilize project returns and earnings volatility.
Customer capex cycles
Operators rebalance capex toward drilling, workovers and decommissioning as reservoirs mature; global offshore decommissioning spend reached roughly USD 12bn in 2024, creating countercyclical demand for integrity work and P&A that offsets softer drilling revenues. Archer can smooth utilization by redeploying crews across service lines and by converting spot work into multi-year MSAs; long-term MSAs and a 2024 industry backlog near USD 20bn help buffer troughs in spot demand.
- Late-life focus: higher P&A/integrity share
- Countercyclical revenue: decommissioning ~USD 12bn (2024)
- Operational flexibility: crew redeployment across lines
- Risk buffer: MSAs + industry backlog ~USD 20bn
Industry consolidation
Accelerating E&P and service-sector M&A has concentrated spend, reducing tender volumes and shifting pricing power to larger buyers; industry reports showed a roughly 25–35% rise in deal activity in 2024 versus 2023, amplifying centralized procurement and stricter KPIs.
Archer must differentiate on demonstrated reliability, HSE performance and lower total cost of ownership to retain margins, while selective partnerships broaden service scope and improve bid competitiveness.
- Consolidation: 25–35% rise in 2024 deal activity
- Buyer power: centralized procurement with tighter KPIs
- Archer focus: reliability, HSE, TCO
- Strategy: selective partnerships to expand bids
Policy, taxes and NOC deals shape oil markets; Norway tax ~78%
Brent ~$84.5/bbl (2024) and ~$79/bbl (Jun‑2025) drive E&P capex and service mix; decommissioning ~$12bn (2024) and industry backlog ~$20bn smooth demand. Cost inflation, tight labour and USD strength (DXY ~104 mid‑2025; USD ~88% FX share) compress margins; consolidation (+25–35% deal activity 2024) increases buyer power. Index‑linked pricing, MSAs and hedging preserve returns.
| Metric | Value |
|---|---|
| Brent | $84.5 (2024) / $79 (Jun‑2025) |
| Decom spend | $12bn (2024) |
| DXY / USD share | ~104 / ~88% |
What You See Is What You Get
Archer PESTLE Analysis
The preview shown here is the exact Archer PESTLE Analysis document you’ll receive after purchase—fully formatted and ready to use. The layout, content, and structure visible are identical to the file you’ll download immediately after payment. No placeholders, no surprises—this is the final, professionally structured report.
Original: $10.00
-65%$10.00
$3.50Description
Your Shortcut to Market Insight Starts Here
Unlock strategic clarity with our PESTLE Analysis of Archer—three- to five-year trends in politics, economics, social change, technology, law and environment are distilled into actionable insights. Ideal for investors, advisors, and strategists, it highlights regulatory risks and growth opportunities shaping Archer’s future. Purchase the full, editable report now for immediate, board-ready intelligence.
Political factors
Energy policy shifts
Government emphasis on hydrocarbons versus renewables drives drilling permits, subsidies and public investment—e.g., the US Inflation Reduction Act commits about $369 billion to clean energy, reshaping project pipelines. Policy reversals after elections can rapidly accelerate or halt well intervention and decommissioning programs. Constant monitoring and scenario planning align capacity to policy trajectories. Diversifying across jurisdictions (Archer operates in more than 15 countries) reduces single-country exposure.
Geopolitical stability
Regional tensions and conflicts disrupt field access, logistics, and crew safety, squeezing service continuity and margins. Sanctions regimes have proliferated since 2022, complicating customer, partner, and equipment flows. UCDP recorded 56 state-based conflicts in 2023, underscoring exposure. Archer needs robust country-risk screening, contingency routing, comprehensive insurance and tightened security protocols.
Regulatory licensing
Regulatory licensing—local content rules, work permits and service licenses—directly govern Archer’s market entry and contract eligibility, and shifts in offshore/onshore lease rounds and environmental approvals can delay demand timing. Archer, listed on Oslo Børs (ticker ARCHER), must maintain compliant vendor status and strong regulator relationships to protect commercial access. Proactive compliance reduces project delays and bid disqualifications, protecting revenue windows.
State-owned counterparties
National oil companies dominate many Archer target markets, holding about 80% of proven oil reserves, and they shape procurement terms and payment cycles; energy ministry mandates in 2024 continued to influence project scope and cadence. Building long-term partnerships and frame agreements helps stabilize utilization, while payment risk management is vital as 90–180 day payment delays were reported in fiscally constrained states in 2024.
- NOC dominance ~80% of proven reserves
- Payment delays reported 90–180 days (2024)
- Long-term partnerships stabilize utilization; prioritize payment-risk controls
Fiscal regimes
Policy, taxes and NOC deals shape oil markets; Norway tax ~78%
Energy policy, fiscal regimes and NOC procurement drive demand and pricing—Norway petroleum tax ~78% (2024), UK decommissioning ~£49bn (2023), US IRA ~$369bn shifts investment. Geopolitical conflicts and sanctions since 2022 raise access and logistics risk across 15+ countries. Strong compliance, country-risk screening and long-term NOC contracts mitigate exposure.
| Metric | Value |
|---|---|
| NOC share reserves | ~80% |
| Norway tax (2024) | ~78% |
| UK decommissioning (2023) | £49bn |
| US IRA | $369bn |
What is included in the product
Detailed Word Document
Explores how external macro-environmental factors uniquely affect the Archer across six dimensions—Political, Economic, Social, Technological, Environmental, and Legal—backed by current data and trends to inform executives, support scenario planning, and highlight actionable threats and opportunities for strategy and funding.
Customizable Excel Spreadsheet
Archer PESTLE Analysis delivers a concise, visually segmented summary of external risks and market factors that’s easily editable and shareable, ideal for quick team alignment, presentations, and strategic planning sessions.
Economic factors
Oil price volatility
Crude swings—Brent averaged about $84.5/bbl in 2024 and traded near $79/bbl in June 2025—drive E&P capex and directly affect demand for drilling, intervention and P&A services; higher prices unlock brownfield optimization work aligned with Archer’s portfolio, while downcycles shift activity to cost-out and integrity life-extension jobs; active hedging and flexible staffing preserve margins.
Cost inflation
Cost inflation in consumables, steel and logistics compresses Archer’s service margins where contracts lack escalators, forcing margin erosion on fixed-price projects.
Tight labor markets have driven up technician wages and training costs, increasing operating expense intensity and crew turnover risks.
Archer needs index-linked pricing clauses and long-term supply agreements to transfer input-price volatility, while operational efficiency and improved tool reliability can offset input-pressure and protect margins.
Currency movements
Mismatches between contract currencies and local costs expose Archer to FX risk as the US dollar remains dominant, involved in roughly 88% of global FX transactions (BIS), so USD-denominated contracts can hurt local‑currency cost bases. Depreciations of local currencies versus the dollar can cut reported revenue or inflate expenses; the DXY averaged about 104 in mid-2025, signaling persistent dollar strength. Natural hedging through matched currency cash flows reduces this exposure, while targeted hedging policies (forwards, swaps) have proven to stabilize project returns and earnings volatility.
Customer capex cycles
Operators rebalance capex toward drilling, workovers and decommissioning as reservoirs mature; global offshore decommissioning spend reached roughly USD 12bn in 2024, creating countercyclical demand for integrity work and P&A that offsets softer drilling revenues. Archer can smooth utilization by redeploying crews across service lines and by converting spot work into multi-year MSAs; long-term MSAs and a 2024 industry backlog near USD 20bn help buffer troughs in spot demand.
- Late-life focus: higher P&A/integrity share
- Countercyclical revenue: decommissioning ~USD 12bn (2024)
- Operational flexibility: crew redeployment across lines
- Risk buffer: MSAs + industry backlog ~USD 20bn
Industry consolidation
Accelerating E&P and service-sector M&A has concentrated spend, reducing tender volumes and shifting pricing power to larger buyers; industry reports showed a roughly 25–35% rise in deal activity in 2024 versus 2023, amplifying centralized procurement and stricter KPIs.
Archer must differentiate on demonstrated reliability, HSE performance and lower total cost of ownership to retain margins, while selective partnerships broaden service scope and improve bid competitiveness.
- Consolidation: 25–35% rise in 2024 deal activity
- Buyer power: centralized procurement with tighter KPIs
- Archer focus: reliability, HSE, TCO
- Strategy: selective partnerships to expand bids
Policy, taxes and NOC deals shape oil markets; Norway tax ~78%
Brent ~$84.5/bbl (2024) and ~$79/bbl (Jun‑2025) drive E&P capex and service mix; decommissioning ~$12bn (2024) and industry backlog ~$20bn smooth demand. Cost inflation, tight labour and USD strength (DXY ~104 mid‑2025; USD ~88% FX share) compress margins; consolidation (+25–35% deal activity 2024) increases buyer power. Index‑linked pricing, MSAs and hedging preserve returns.
| Metric | Value |
|---|---|
| Brent | $84.5 (2024) / $79 (Jun‑2025) |
| Decom spend | $12bn (2024) |
| DXY / USD share | ~104 / ~88% |
What You See Is What You Get
Archer PESTLE Analysis
The preview shown here is the exact Archer PESTLE Analysis document you’ll receive after purchase—fully formatted and ready to use. The layout, content, and structure visible are identical to the file you’ll download immediately after payment. No placeholders, no surprises—this is the final, professionally structured report.











