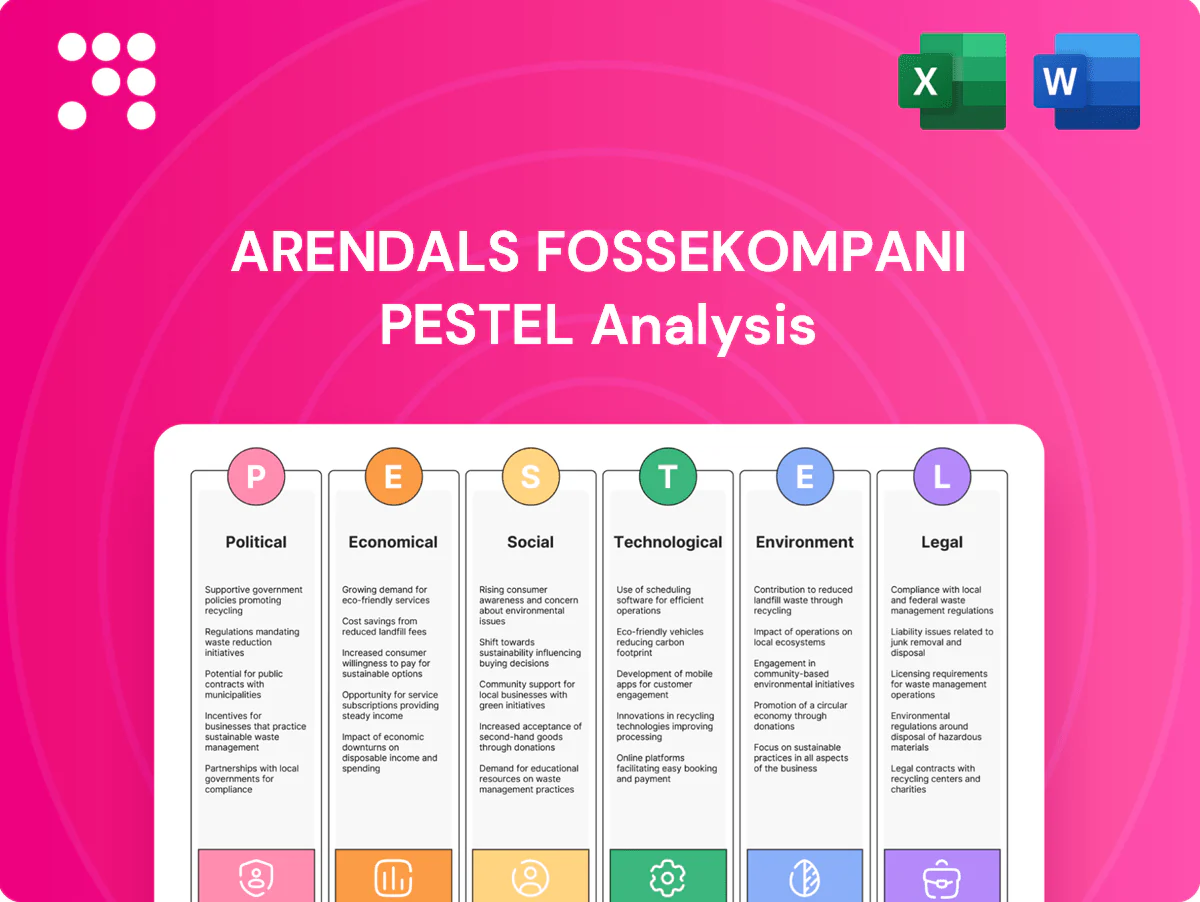
Arendals Fossekompani PESTLE Analysis

Skip the Research. Get the Strategy.
Our PESTLE Analysis for Arendals Fossekompani reveals how political shifts, economic cycles, environmental regulations and technological trends converge to shape the company’s outlook; it highlights risks and strategic opportunities for investors and managers. Ready-made and research-backed, this brief guides immediate decisions. Purchase the full report for actionable, detailed insights.
Political factors

EU and Norwegian energy policy alignment
Arendals Fossekompani’s growth hinges on stable Norway–EEA green-transition alignment; Norway already sources ~98% of electricity from renewables while the EU targets about 45% renewables by 2030. Consistent incentives for renewables, grid upgrades and electrification underpin project economics and capital flows. Post-election policy shifts can change subsidy and permitting priorities, so active policy engagement hedges regulatory drift.
Geopolitics and energy security
Russian supply shocks—Russia supplied about 40% of EU gas pre-2022 but fell below 10% by 2024—have accelerated Europe’s move to domestic clean power and storage, favoring AFK’s renewable and battery investments. This surge raises competition for assets as EU demand for renewables and storage scales toward 2030 targets (renewables share ~42–45%). Heightened security reviews increasingly delay cross-border deals. Supply-chain diversification is now a political priority shaping AFK’s portfolio choices.

Public funding and green industrial strategies
Expansion of EU/EEA instruments such as NextGenerationEU (€800bn), the EU Innovation Fund (≈€38bn for 2020–2030) and IPCEI battery support (~€3.2bn public aid) can de-risk scale-up; AFK can leverage co-funding for battery technologies and power projects. Access hinges on strict eligibility and national co-financing rules, and crowding-in from subsidized players may compress returns in those segments.

Permitting and local governance
Regional authorities control hydropower, wind and grid permits critical to Arendals Fossekompani timelines; Norway's hydropower supplies about 90% of national electricity, concentrating regulatory influence. Streamlined fast-track regimes shorten permitting uncertainty and improve IRR visibility, while fragmented processes raise delay risk and capex carry costs. Municipal stakeholder politics drive local acceptance; early engagement lowers appeal likelihood and political backlash.
- Regulatory control: regional authorities (hydro/wind/grid)
- Market fact: hydropower ~90% of Norway's generation
- Risk: fragmented permitting → delays, higher carry costs
- Mitigation: early municipal engagement reduces appeals
Trade policy and tariffs on critical inputs
Import controls on batteries, cells and power electronics compress Arendals Fossekompani cost curves by lifting input landed costs; tariffs or anti-dumping measures can protect local producers but raise capex for domestic assembly. Rules-of-origin force rerouting and higher inventory buffers. China supplied roughly 70% of global battery cell capacity in 2024, so AFK must balance domestic sourcing with global cost competitiveness.
- Import controls raise landed costs
- Tariffs favor local build but increase capex
- Rules-of-origin complicate routing & inventory
- China ~70% cell capacity (2024) — strategic exposure
Norway-EEA renewables surge, EU funds compress returns; China cell control raises costs
Political risks shape AFK: Norway–EEA renewables alignment (Norway ~98% renewables; hydropower ~90%) and post-2024 EU targets (~42–45% by 2030) drive demand and subsidies. Russia gas fell from ~40% pre‑2022 to <10% by 2024, accelerating electrification and competition. EU funds (NextGenerationEU €800bn; Innovation Fund ≈€38bn; IPCEI batteries ~€3.2bn) de‑risk but compress returns. Import controls (China ~70% cell capacity 2024) raise landed costs.
| Metric | Value |
|---|---|
| Norway renewables | ~98% |
| Hydropower share Norway | ~90% |
| EU renewables 2030 | ~42–45% |
| Russia gas to EU | ~40% pre‑2022 → <10% (2024) |
| China battery cells (2024) | ~70% |
| EU funds | NextGen €800bn; Innovation €38bn; IPCEI €3.2bn |
What is included in the product
 Detailed Word Document
Explores how macro-environmental factors uniquely affect Arendals Fossekompani across Political, Economic, Social, Technological, Environmental and Legal dimensions, with data-driven insights and region-specific trends. Designed to help executives and investors identify tangible threats, opportunities and forward-looking scenarios.

 Customizable Excel Spreadsheet
A concise, visually segmented PESTLE summary for Arendals Fossekompani that can be dropped into presentations and shared across teams, enabling quick alignment on external risks and market positioning. Editable notes allow tailoring to region or business line, making it ideal for consultants and strategy sessions.
Economic factors

Power prices and merchant exposure
Nord Pool day-ahead dynamics drive Arendals Fossekompani's hydropower revenues, with the 2024 Nordic system price averaging about €72/MWh and heightened intrayear volatility. Hedging and PPAs (roughly 60% of generation contracted) stabilize cash flows but limit upside when spot spikes occur. Weather-driven inflows and interconnector capacity determine seasonal spreads and scarcity premiums. Balancing contracted versus merchant exposure remains a key value lever for volatility capture.
Interest rates and cost of capital
Higher rates (Norges Bank policy rate 4.25% in mid‑2025) compress asset valuations and limit leverage for infrastructure and scale‑ups, while 10y global yields near 4.3% raise refinancing risk; a 100bp WACC increase can materially delay project timing. Policy green financing (global green bond market ~USD 500–550bn annual issuance) can partly offset rate headwinds. Prudent duration and fixed/floating mix management are critical.

Inflation and capex escalation
Materials, EPC and grid-connection costs have driven project capex up materially, with industry reports citing escalation ranges of 15–25% in recent cycles; index-linked PPAs and escalation clauses (tied to CPI) mitigate but do not fully prevent margin squeeze. Long-term supply agreements and early procurement typically cut cost variance by an estimated 10–15%, while strict cost discipline has enabled bidders to undercut competitors by roughly 10–20% in recent renewable auctions.

Access to private and public capital
Energy-transition themes continue to attract institutional capital, but investor selectivity has tightened; AFK’s active-ownership model and operational improvements can unlock operational alpha to improve funding access and valuation premia.
- Diversified funding: listing venues, green bonds, project finance
- Competitive edge: active ownership drives project de-risking
- Risk: downturns stress-test liquidity and covenant headroom
Currency fluctuations (NOK vs EUR/USD)
Arendals Fossekompani faces FX risk as global tech and equipment purchases are invoiced in EUR/USD while core revenues are NOK, which can compress margins when NOK weakens. Effective hedging programs and natural operational offsets are essential to stabilize EBIT. Cross-border M&A valuations are sensitive to NOK moves, affecting deal pricing and earn-outs.
- Exposure: EUR/USD payables vs NOK revenues
- Mitigation: forward hedges, natural offsets
- Impact: margin volatility, deal valuation swings
Norway-EEA renewables surge, EU funds compress returns; China cell control raises costs
Nord Pool spot (2024 avg €72/MWh) and 60% contracted generation shape revenues and volatility capture. Norges Bank policy ~4.25% (mid‑2025) and 10y yields ~4.3% pressure valuations; green bonds (~USD 500–550bn p.a.) ease funding. Capex inflation 15–25% and FX (EUR/USD vs NOK) drive margin risk; hedges and long‑term procurement reduce exposure.
| Metric | Value |
|---|---|
| Nordic price 2024 | €72/MWh |
| Contracted generation | ~60% |
| Policy rate | 4.25% (mid‑2025) |
| Capex inflation | 15–25% |
Full Version Awaits
Arendals Fossekompani PESTLE Analysis
The Arendals Fossekompani PESTLE Analysis preview shown here is the exact document you’ll receive after purchase—fully formatted and ready to use. The file contains the same structured political, economic, social, technological, legal and environmental assessment visible now. No placeholders or teasers—this is the final, download-ready report.

Skip the Research. Get the Strategy.
Our PESTLE Analysis for Arendals Fossekompani reveals how political shifts, economic cycles, environmental regulations and technological trends converge to shape the company’s outlook; it highlights risks and strategic opportunities for investors and managers. Ready-made and research-backed, this brief guides immediate decisions. Purchase the full report for actionable, detailed insights.
Political factors
EU and Norwegian energy policy alignment
Arendals Fossekompani’s growth hinges on stable Norway–EEA green-transition alignment; Norway already sources ~98% of electricity from renewables while the EU targets about 45% renewables by 2030. Consistent incentives for renewables, grid upgrades and electrification underpin project economics and capital flows. Post-election policy shifts can change subsidy and permitting priorities, so active policy engagement hedges regulatory drift.
Geopolitics and energy security
Russian supply shocks—Russia supplied about 40% of EU gas pre-2022 but fell below 10% by 2024—have accelerated Europe’s move to domestic clean power and storage, favoring AFK’s renewable and battery investments. This surge raises competition for assets as EU demand for renewables and storage scales toward 2030 targets (renewables share ~42–45%). Heightened security reviews increasingly delay cross-border deals. Supply-chain diversification is now a political priority shaping AFK’s portfolio choices.
Public funding and green industrial strategies
Expansion of EU/EEA instruments such as NextGenerationEU (€800bn), the EU Innovation Fund (≈€38bn for 2020–2030) and IPCEI battery support (~€3.2bn public aid) can de-risk scale-up; AFK can leverage co-funding for battery technologies and power projects. Access hinges on strict eligibility and national co-financing rules, and crowding-in from subsidized players may compress returns in those segments.
Permitting and local governance
Regional authorities control hydropower, wind and grid permits critical to Arendals Fossekompani timelines; Norway's hydropower supplies about 90% of national electricity, concentrating regulatory influence. Streamlined fast-track regimes shorten permitting uncertainty and improve IRR visibility, while fragmented processes raise delay risk and capex carry costs. Municipal stakeholder politics drive local acceptance; early engagement lowers appeal likelihood and political backlash.
- Regulatory control: regional authorities (hydro/wind/grid)
- Market fact: hydropower ~90% of Norway's generation
- Risk: fragmented permitting → delays, higher carry costs
- Mitigation: early municipal engagement reduces appeals
Trade policy and tariffs on critical inputs
Import controls on batteries, cells and power electronics compress Arendals Fossekompani cost curves by lifting input landed costs; tariffs or anti-dumping measures can protect local producers but raise capex for domestic assembly. Rules-of-origin force rerouting and higher inventory buffers. China supplied roughly 70% of global battery cell capacity in 2024, so AFK must balance domestic sourcing with global cost competitiveness.
- Import controls raise landed costs
- Tariffs favor local build but increase capex
- Rules-of-origin complicate routing & inventory
- China ~70% cell capacity (2024) — strategic exposure
Norway-EEA renewables surge, EU funds compress returns; China cell control raises costs
Political risks shape AFK: Norway–EEA renewables alignment (Norway ~98% renewables; hydropower ~90%) and post-2024 EU targets (~42–45% by 2030) drive demand and subsidies. Russia gas fell from ~40% pre‑2022 to <10% by 2024, accelerating electrification and competition. EU funds (NextGenerationEU €800bn; Innovation Fund ≈€38bn; IPCEI batteries ~€3.2bn) de‑risk but compress returns. Import controls (China ~70% cell capacity 2024) raise landed costs.
| Metric | Value |
|---|---|
| Norway renewables | ~98% |
| Hydropower share Norway | ~90% |
| EU renewables 2030 | ~42–45% |
| Russia gas to EU | ~40% pre‑2022 → <10% (2024) |
| China battery cells (2024) | ~70% |
| EU funds | NextGen €800bn; Innovation €38bn; IPCEI €3.2bn |
What is included in the product
Detailed Word Document
Explores how macro-environmental factors uniquely affect Arendals Fossekompani across Political, Economic, Social, Technological, Environmental and Legal dimensions, with data-driven insights and region-specific trends. Designed to help executives and investors identify tangible threats, opportunities and forward-looking scenarios.
Customizable Excel Spreadsheet
A concise, visually segmented PESTLE summary for Arendals Fossekompani that can be dropped into presentations and shared across teams, enabling quick alignment on external risks and market positioning. Editable notes allow tailoring to region or business line, making it ideal for consultants and strategy sessions.
Economic factors
Power prices and merchant exposure
Nord Pool day-ahead dynamics drive Arendals Fossekompani's hydropower revenues, with the 2024 Nordic system price averaging about €72/MWh and heightened intrayear volatility. Hedging and PPAs (roughly 60% of generation contracted) stabilize cash flows but limit upside when spot spikes occur. Weather-driven inflows and interconnector capacity determine seasonal spreads and scarcity premiums. Balancing contracted versus merchant exposure remains a key value lever for volatility capture.
Interest rates and cost of capital
Higher rates (Norges Bank policy rate 4.25% in mid‑2025) compress asset valuations and limit leverage for infrastructure and scale‑ups, while 10y global yields near 4.3% raise refinancing risk; a 100bp WACC increase can materially delay project timing. Policy green financing (global green bond market ~USD 500–550bn annual issuance) can partly offset rate headwinds. Prudent duration and fixed/floating mix management are critical.
Inflation and capex escalation
Materials, EPC and grid-connection costs have driven project capex up materially, with industry reports citing escalation ranges of 15–25% in recent cycles; index-linked PPAs and escalation clauses (tied to CPI) mitigate but do not fully prevent margin squeeze. Long-term supply agreements and early procurement typically cut cost variance by an estimated 10–15%, while strict cost discipline has enabled bidders to undercut competitors by roughly 10–20% in recent renewable auctions.
Access to private and public capital
Energy-transition themes continue to attract institutional capital, but investor selectivity has tightened; AFK’s active-ownership model and operational improvements can unlock operational alpha to improve funding access and valuation premia.
- Diversified funding: listing venues, green bonds, project finance
- Competitive edge: active ownership drives project de-risking
- Risk: downturns stress-test liquidity and covenant headroom
Currency fluctuations (NOK vs EUR/USD)
Arendals Fossekompani faces FX risk as global tech and equipment purchases are invoiced in EUR/USD while core revenues are NOK, which can compress margins when NOK weakens. Effective hedging programs and natural operational offsets are essential to stabilize EBIT. Cross-border M&A valuations are sensitive to NOK moves, affecting deal pricing and earn-outs.
- Exposure: EUR/USD payables vs NOK revenues
- Mitigation: forward hedges, natural offsets
- Impact: margin volatility, deal valuation swings
Norway-EEA renewables surge, EU funds compress returns; China cell control raises costs
Nord Pool spot (2024 avg €72/MWh) and 60% contracted generation shape revenues and volatility capture. Norges Bank policy ~4.25% (mid‑2025) and 10y yields ~4.3% pressure valuations; green bonds (~USD 500–550bn p.a.) ease funding. Capex inflation 15–25% and FX (EUR/USD vs NOK) drive margin risk; hedges and long‑term procurement reduce exposure.
| Metric | Value |
|---|---|
| Nordic price 2024 | €72/MWh |
| Contracted generation | ~60% |
| Policy rate | 4.25% (mid‑2025) |
| Capex inflation | 15–25% |
Full Version Awaits
Arendals Fossekompani PESTLE Analysis
The Arendals Fossekompani PESTLE Analysis preview shown here is the exact document you’ll receive after purchase—fully formatted and ready to use. The file contains the same structured political, economic, social, technological, legal and environmental assessment visible now. No placeholders or teasers—this is the final, download-ready report.
Original: $10.00
-65%$10.00
$3.50Description
Skip the Research. Get the Strategy.
Our PESTLE Analysis for Arendals Fossekompani reveals how political shifts, economic cycles, environmental regulations and technological trends converge to shape the company’s outlook; it highlights risks and strategic opportunities for investors and managers. Ready-made and research-backed, this brief guides immediate decisions. Purchase the full report for actionable, detailed insights.
Political factors
EU and Norwegian energy policy alignment
Arendals Fossekompani’s growth hinges on stable Norway–EEA green-transition alignment; Norway already sources ~98% of electricity from renewables while the EU targets about 45% renewables by 2030. Consistent incentives for renewables, grid upgrades and electrification underpin project economics and capital flows. Post-election policy shifts can change subsidy and permitting priorities, so active policy engagement hedges regulatory drift.
Geopolitics and energy security
Russian supply shocks—Russia supplied about 40% of EU gas pre-2022 but fell below 10% by 2024—have accelerated Europe’s move to domestic clean power and storage, favoring AFK’s renewable and battery investments. This surge raises competition for assets as EU demand for renewables and storage scales toward 2030 targets (renewables share ~42–45%). Heightened security reviews increasingly delay cross-border deals. Supply-chain diversification is now a political priority shaping AFK’s portfolio choices.
Public funding and green industrial strategies
Expansion of EU/EEA instruments such as NextGenerationEU (€800bn), the EU Innovation Fund (≈€38bn for 2020–2030) and IPCEI battery support (~€3.2bn public aid) can de-risk scale-up; AFK can leverage co-funding for battery technologies and power projects. Access hinges on strict eligibility and national co-financing rules, and crowding-in from subsidized players may compress returns in those segments.
Permitting and local governance
Regional authorities control hydropower, wind and grid permits critical to Arendals Fossekompani timelines; Norway's hydropower supplies about 90% of national electricity, concentrating regulatory influence. Streamlined fast-track regimes shorten permitting uncertainty and improve IRR visibility, while fragmented processes raise delay risk and capex carry costs. Municipal stakeholder politics drive local acceptance; early engagement lowers appeal likelihood and political backlash.
- Regulatory control: regional authorities (hydro/wind/grid)
- Market fact: hydropower ~90% of Norway's generation
- Risk: fragmented permitting → delays, higher carry costs
- Mitigation: early municipal engagement reduces appeals
Trade policy and tariffs on critical inputs
Import controls on batteries, cells and power electronics compress Arendals Fossekompani cost curves by lifting input landed costs; tariffs or anti-dumping measures can protect local producers but raise capex for domestic assembly. Rules-of-origin force rerouting and higher inventory buffers. China supplied roughly 70% of global battery cell capacity in 2024, so AFK must balance domestic sourcing with global cost competitiveness.
- Import controls raise landed costs
- Tariffs favor local build but increase capex
- Rules-of-origin complicate routing & inventory
- China ~70% cell capacity (2024) — strategic exposure
Norway-EEA renewables surge, EU funds compress returns; China cell control raises costs
Political risks shape AFK: Norway–EEA renewables alignment (Norway ~98% renewables; hydropower ~90%) and post-2024 EU targets (~42–45% by 2030) drive demand and subsidies. Russia gas fell from ~40% pre‑2022 to <10% by 2024, accelerating electrification and competition. EU funds (NextGenerationEU €800bn; Innovation Fund ≈€38bn; IPCEI batteries ~€3.2bn) de‑risk but compress returns. Import controls (China ~70% cell capacity 2024) raise landed costs.
| Metric | Value |
|---|---|
| Norway renewables | ~98% |
| Hydropower share Norway | ~90% |
| EU renewables 2030 | ~42–45% |
| Russia gas to EU | ~40% pre‑2022 → <10% (2024) |
| China battery cells (2024) | ~70% |
| EU funds | NextGen €800bn; Innovation €38bn; IPCEI €3.2bn |
What is included in the product
Detailed Word Document
Explores how macro-environmental factors uniquely affect Arendals Fossekompani across Political, Economic, Social, Technological, Environmental and Legal dimensions, with data-driven insights and region-specific trends. Designed to help executives and investors identify tangible threats, opportunities and forward-looking scenarios.
Customizable Excel Spreadsheet
A concise, visually segmented PESTLE summary for Arendals Fossekompani that can be dropped into presentations and shared across teams, enabling quick alignment on external risks and market positioning. Editable notes allow tailoring to region or business line, making it ideal for consultants and strategy sessions.
Economic factors
Power prices and merchant exposure
Nord Pool day-ahead dynamics drive Arendals Fossekompani's hydropower revenues, with the 2024 Nordic system price averaging about €72/MWh and heightened intrayear volatility. Hedging and PPAs (roughly 60% of generation contracted) stabilize cash flows but limit upside when spot spikes occur. Weather-driven inflows and interconnector capacity determine seasonal spreads and scarcity premiums. Balancing contracted versus merchant exposure remains a key value lever for volatility capture.
Interest rates and cost of capital
Higher rates (Norges Bank policy rate 4.25% in mid‑2025) compress asset valuations and limit leverage for infrastructure and scale‑ups, while 10y global yields near 4.3% raise refinancing risk; a 100bp WACC increase can materially delay project timing. Policy green financing (global green bond market ~USD 500–550bn annual issuance) can partly offset rate headwinds. Prudent duration and fixed/floating mix management are critical.
Inflation and capex escalation
Materials, EPC and grid-connection costs have driven project capex up materially, with industry reports citing escalation ranges of 15–25% in recent cycles; index-linked PPAs and escalation clauses (tied to CPI) mitigate but do not fully prevent margin squeeze. Long-term supply agreements and early procurement typically cut cost variance by an estimated 10–15%, while strict cost discipline has enabled bidders to undercut competitors by roughly 10–20% in recent renewable auctions.
Access to private and public capital
Energy-transition themes continue to attract institutional capital, but investor selectivity has tightened; AFK’s active-ownership model and operational improvements can unlock operational alpha to improve funding access and valuation premia.
- Diversified funding: listing venues, green bonds, project finance
- Competitive edge: active ownership drives project de-risking
- Risk: downturns stress-test liquidity and covenant headroom
Currency fluctuations (NOK vs EUR/USD)
Arendals Fossekompani faces FX risk as global tech and equipment purchases are invoiced in EUR/USD while core revenues are NOK, which can compress margins when NOK weakens. Effective hedging programs and natural operational offsets are essential to stabilize EBIT. Cross-border M&A valuations are sensitive to NOK moves, affecting deal pricing and earn-outs.
- Exposure: EUR/USD payables vs NOK revenues
- Mitigation: forward hedges, natural offsets
- Impact: margin volatility, deal valuation swings
Norway-EEA renewables surge, EU funds compress returns; China cell control raises costs
Nord Pool spot (2024 avg €72/MWh) and 60% contracted generation shape revenues and volatility capture. Norges Bank policy ~4.25% (mid‑2025) and 10y yields ~4.3% pressure valuations; green bonds (~USD 500–550bn p.a.) ease funding. Capex inflation 15–25% and FX (EUR/USD vs NOK) drive margin risk; hedges and long‑term procurement reduce exposure.
| Metric | Value |
|---|---|
| Nordic price 2024 | €72/MWh |
| Contracted generation | ~60% |
| Policy rate | 4.25% (mid‑2025) |
| Capex inflation | 15–25% |
Full Version Awaits
Arendals Fossekompani PESTLE Analysis
The Arendals Fossekompani PESTLE Analysis preview shown here is the exact document you’ll receive after purchase—fully formatted and ready to use. The file contains the same structured political, economic, social, technological, legal and environmental assessment visible now. No placeholders or teasers—this is the final, download-ready report.











