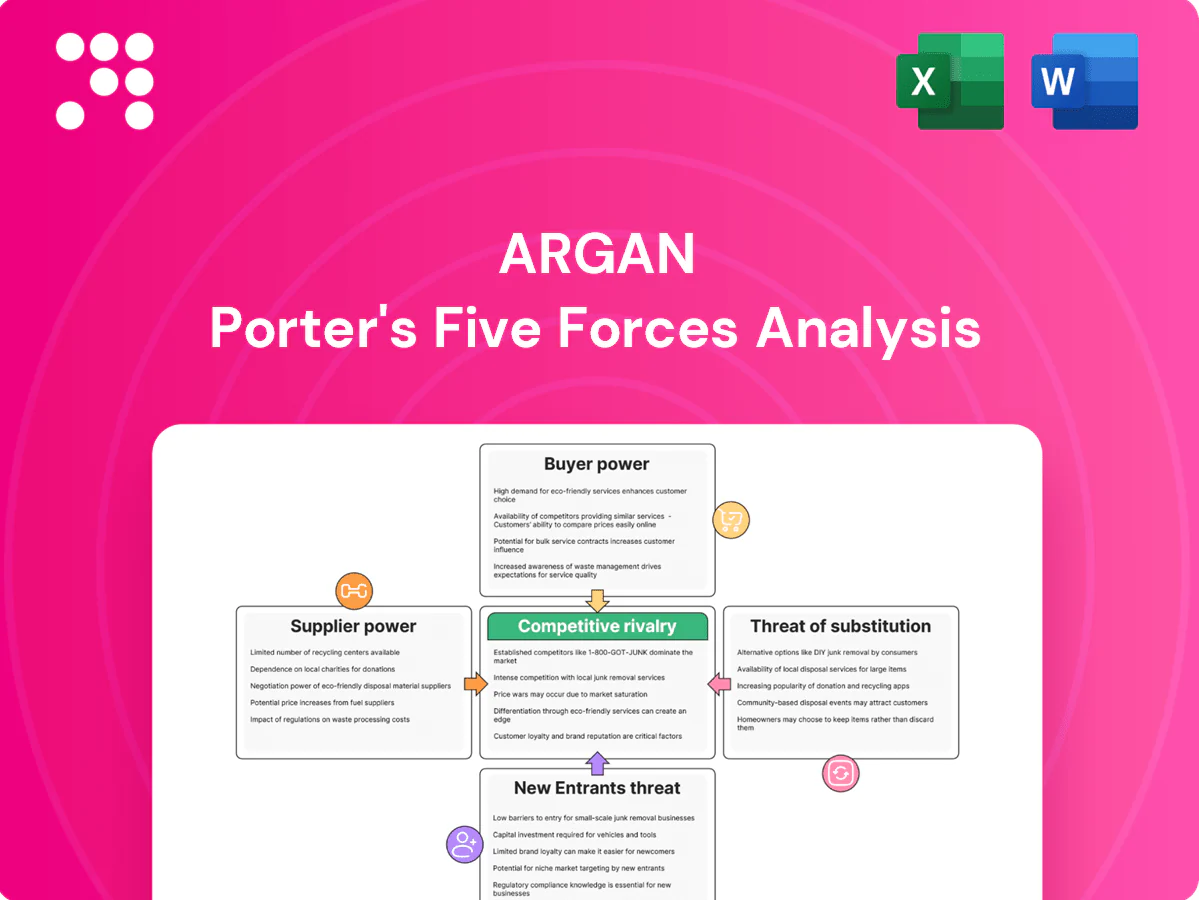
Argan Porter's Five Forces Analysis

A Must-Have Tool for Decision-Makers
Argan's Porter's Five Forces snapshot highlights supplier leverage, buyer pressure, competitive rivalry, threat of new entrants, and substitutes, revealing key strategic tensions. This brief overview flags areas of strength and vulnerability. Ready for deeper insight? Unlock the full Porter's Five Forces Analysis to get force-by-force ratings, visuals, and actionable recommendations.
Suppliers Bargaining Power

Concentrated OEM equipment
Utility-scale turbines, HRSGs, switchgear and telecom systems are concentrated among a few global OEMs (top five OEMs control ~70% of global turbine shipments in 2024), giving suppliers significant leverage. Long lead times (turbines 12–24 months, HRSGs 9–18 months) and strict specs limit substitution, letting OEMs push unfavorable contract terms, spares markups (often 20–40%) and premium delivery slots (10–30% surcharge). Framework agreements and early procurement reduce but do not eliminate this supplier power.
Specialized skilled labor
EPC and telecom builds rely on certified craft labor and niche engineers, and 2024 BLS/JOLTS showed over 350,000 open construction jobs, pushing wage growth near 5% YoY and higher retention costs. Union rules and regional licensing constrain redeployment, while targeted workforce development and strategic subcontracting reduce supplier power and project risk.

Commodity and logistics volatility
Steel, copper, concrete and cabling costs remain cyclical: copper averaged about $9,500/ton in 2024 and hot‑rolled coil traded roughly $700–1,000/ton, with swings of 15–30% year‑to‑year.
Freight volatility — Shanghai‑LA box rates near $1,200/FEU in 2024, plus oversize and congestion surcharges adding 10–25% — disrupts schedules and raises costs.
Suppliers commonly pass through surcharges during spikes; hedging, indexed contracts and diversified lanes reduce but do not eliminate exposure.

Quality, safety, and compliance gating
Stringent QA/QC, safety and ESG gates (eg, ISO 9001, ISO 45001, NERC/industry-specific standards and formal ESG reporting) shrink the eligible supplier pool, increasing reliance on proven vendors; lapses in certification or safety audits can trigger stop-work orders and project delays. Approved vendor lists and recurring third-party audits sustain reliability while concentrating bargaining power with certified suppliers.
- Required certifications: ISO 9001, ISO 45001, NERC/industry standards
- Certification lapse → stop-work/project delay risk
- Approved vendor lists + audits increase supplier leverage
Digital tools and IP lock-in
Supplier squeeze in wind: top-5 OEMs ~70%, 12–24m lead times, labor gap
Suppliers hold strong bargaining power: top-five turbine OEMs ~70% of global shipments in 2024, long lead times (turbines 12–24m) and 20–40% spares markups. Skilled labor shortage (≈350,000 open construction jobs in 2024) and certification gates (ISO 9001/45001, NERC) concentrate leverage. Commodity and freight volatility (copper ~$9,500/ton; Shanghai‑LA ~$1,200/FEU) drive passthroughs; hedging and framework contracts partially mitigate.
| Metric | 2024 Value | Impact |
|---|---|---|
| Top-5 OEM share | ~70% | High supplier leverage |
| Lead times | 12–24m (turbines) | Switching friction |
| Open construction jobs | ≈350k | Wage pressure |
What is included in the product
 Detailed Word Document
Concise Five Forces analysis tailored to Argan Porter that uncovers competitive drivers, supplier and buyer power, entrant and substitute threats, and strategic levers to protect margins and guide investor or management decisions.

 Customizable Excel Spreadsheet
Clear one-sheet Porter's Five Forces for Argan—instantly highlights supplier, buyer, entrant, substitute and rivalry pressures so decision-makers can prioritize strategic fixes. Customizable pressure levels and a ready-to-use radar chart make it effortless to drop into decks or scenario tabs for rapid action.
Customers Bargaining Power

Large, sophisticated buyers
Utilities, IPPs, renewables developers, data centers and carriers run competitive RFPs benchmarking price, schedule and warranties across multiple EPCs; professional procurement teams routinely push concessions and tighter SLAs. Buyer scale—often multi-hundred‑MW or multi-site deals—amplifies negotiating leverage, shortening bid cycles to 3–6 months and compressing EPC margins.
Project-based, price-sensitive awards
Fixed-bid and GMP structures transfer cost and schedule risk to contractors, compressing typical contractor gross margins and forcing tight cost controls. Industry surveys in 2024 show awards often hinge on 1–3% margin differentials, so small pricing moves determine winners. Owners increasingly insist on liquidated damages and performance guarantees, while rigorous bid qualification processes in 2024 limit scope for premium pricing.

Switching costs moderate
Pre-award switching is relatively easy for clients, but post-award switching becomes costly due to mobilization and design-integration lock-in. Contract step-in rights and lender/owner remedies can still be used to pressure commercial terms. Strong documentation and change-order controls in Argan contracts reduce disputes and rework. Argan’s proven execution track record in 2024 increases perceived switching costs in its favor.

Financing and schedule pressures
Lenders’ technical advisors shape scope, milestones and covenants, and their approvals often determine draw schedules and compliance reporting. Delays can jeopardize tax-credit eligibility and IRS safe-harbor/COD timing that affected ITC/PTC claims in 2024, while missed CODs risk PPA penalties and buyer claims. Buyers use these timing pressures to demand acceleration without full compensation; demonstrable, credible schedule control reduces that leverage.
- Lender oversight: controls scope and draws
- Timing risk: IRS safe-harbor/COD impact on ITC/PTC (2024)
- Buyer leverage: acceleration demands vs. compensation
- Mitigation: credible schedule control lowers buyer bargaining power
Cross-selling O&M optionality
Owners can unbundle O&M, commissioning and telecom maintenance to separate vendors, increasing buyer options and diluting wallet share; the global renewable O&M market was estimated at about 27 billion USD in 2024, raising competitive pressure. Bundled lifecycle offerings create customer lock-in and recurring revenue, while transparent performance KPIs (availability, MTTR) improve retention.
- Unbundling: increases vendor choice
- Bundled lifecycle: locks recurring revenue
- KPIs: availability/MTTR drive renewals
3–6 month RFPs squeeze 1–3% margins as fixed‑price risk shifts to EPCs
Buyers run competitive RFPs (3–6 month cycles) on multi‑hundred‑MW deals, forcing 1–3% margin differentials in 2024 awards and strong price leverage.
Fixed‑price/GMPs and liquidated damages shift cost and schedule risk to EPCs, compressing contractor gross margins and increasing concessions.
Unbundling O&M (global market ~$27B in 2024) expands supplier choice; bundled lifecycle and Argan’s 2024 execution record raise perceived switching costs.
| Metric | 2024 | Impact |
|---|---|---|
| Bid cycle | 3–6 months | Faster decisions, tighter margins |
| Margin sensitivity | 1–3% | Win by small pricing moves |
| O&M market | $27B | More vendors, more pressure |
| Contract type | Fixed/GMP | Risk shifted to EPC |
What You See Is What You Get
Argan Porter's Five Forces Analysis
This preview shows Argan Porter's Five Forces Analysis exactly as delivered upon purchase, with full, professionally formatted content and no placeholders. The file you see is the same document you’ll download instantly after buying. It’s complete, ready to use, and tailored for immediate application.

A Must-Have Tool for Decision-Makers
Argan's Porter's Five Forces snapshot highlights supplier leverage, buyer pressure, competitive rivalry, threat of new entrants, and substitutes, revealing key strategic tensions. This brief overview flags areas of strength and vulnerability. Ready for deeper insight? Unlock the full Porter's Five Forces Analysis to get force-by-force ratings, visuals, and actionable recommendations.
Suppliers Bargaining Power
Concentrated OEM equipment
Utility-scale turbines, HRSGs, switchgear and telecom systems are concentrated among a few global OEMs (top five OEMs control ~70% of global turbine shipments in 2024), giving suppliers significant leverage. Long lead times (turbines 12–24 months, HRSGs 9–18 months) and strict specs limit substitution, letting OEMs push unfavorable contract terms, spares markups (often 20–40%) and premium delivery slots (10–30% surcharge). Framework agreements and early procurement reduce but do not eliminate this supplier power.
Specialized skilled labor
EPC and telecom builds rely on certified craft labor and niche engineers, and 2024 BLS/JOLTS showed over 350,000 open construction jobs, pushing wage growth near 5% YoY and higher retention costs. Union rules and regional licensing constrain redeployment, while targeted workforce development and strategic subcontracting reduce supplier power and project risk.
Commodity and logistics volatility
Steel, copper, concrete and cabling costs remain cyclical: copper averaged about $9,500/ton in 2024 and hot‑rolled coil traded roughly $700–1,000/ton, with swings of 15–30% year‑to‑year.
Freight volatility — Shanghai‑LA box rates near $1,200/FEU in 2024, plus oversize and congestion surcharges adding 10–25% — disrupts schedules and raises costs.
Suppliers commonly pass through surcharges during spikes; hedging, indexed contracts and diversified lanes reduce but do not eliminate exposure.
Quality, safety, and compliance gating
Stringent QA/QC, safety and ESG gates (eg, ISO 9001, ISO 45001, NERC/industry-specific standards and formal ESG reporting) shrink the eligible supplier pool, increasing reliance on proven vendors; lapses in certification or safety audits can trigger stop-work orders and project delays. Approved vendor lists and recurring third-party audits sustain reliability while concentrating bargaining power with certified suppliers.
- Required certifications: ISO 9001, ISO 45001, NERC/industry standards
- Certification lapse → stop-work/project delay risk
- Approved vendor lists + audits increase supplier leverage
Digital tools and IP lock-in
Supplier squeeze in wind: top-5 OEMs ~70%, 12–24m lead times, labor gap
Suppliers hold strong bargaining power: top-five turbine OEMs ~70% of global shipments in 2024, long lead times (turbines 12–24m) and 20–40% spares markups. Skilled labor shortage (≈350,000 open construction jobs in 2024) and certification gates (ISO 9001/45001, NERC) concentrate leverage. Commodity and freight volatility (copper ~$9,500/ton; Shanghai‑LA ~$1,200/FEU) drive passthroughs; hedging and framework contracts partially mitigate.
| Metric | 2024 Value | Impact |
|---|---|---|
| Top-5 OEM share | ~70% | High supplier leverage |
| Lead times | 12–24m (turbines) | Switching friction |
| Open construction jobs | ≈350k | Wage pressure |
What is included in the product
Detailed Word Document
Concise Five Forces analysis tailored to Argan Porter that uncovers competitive drivers, supplier and buyer power, entrant and substitute threats, and strategic levers to protect margins and guide investor or management decisions.
Customizable Excel Spreadsheet
Clear one-sheet Porter's Five Forces for Argan—instantly highlights supplier, buyer, entrant, substitute and rivalry pressures so decision-makers can prioritize strategic fixes. Customizable pressure levels and a ready-to-use radar chart make it effortless to drop into decks or scenario tabs for rapid action.
Customers Bargaining Power
Large, sophisticated buyers
Utilities, IPPs, renewables developers, data centers and carriers run competitive RFPs benchmarking price, schedule and warranties across multiple EPCs; professional procurement teams routinely push concessions and tighter SLAs. Buyer scale—often multi-hundred‑MW or multi-site deals—amplifies negotiating leverage, shortening bid cycles to 3–6 months and compressing EPC margins.
Project-based, price-sensitive awards
Fixed-bid and GMP structures transfer cost and schedule risk to contractors, compressing typical contractor gross margins and forcing tight cost controls. Industry surveys in 2024 show awards often hinge on 1–3% margin differentials, so small pricing moves determine winners. Owners increasingly insist on liquidated damages and performance guarantees, while rigorous bid qualification processes in 2024 limit scope for premium pricing.
Switching costs moderate
Pre-award switching is relatively easy for clients, but post-award switching becomes costly due to mobilization and design-integration lock-in. Contract step-in rights and lender/owner remedies can still be used to pressure commercial terms. Strong documentation and change-order controls in Argan contracts reduce disputes and rework. Argan’s proven execution track record in 2024 increases perceived switching costs in its favor.
Financing and schedule pressures
Lenders’ technical advisors shape scope, milestones and covenants, and their approvals often determine draw schedules and compliance reporting. Delays can jeopardize tax-credit eligibility and IRS safe-harbor/COD timing that affected ITC/PTC claims in 2024, while missed CODs risk PPA penalties and buyer claims. Buyers use these timing pressures to demand acceleration without full compensation; demonstrable, credible schedule control reduces that leverage.
- Lender oversight: controls scope and draws
- Timing risk: IRS safe-harbor/COD impact on ITC/PTC (2024)
- Buyer leverage: acceleration demands vs. compensation
- Mitigation: credible schedule control lowers buyer bargaining power
Cross-selling O&M optionality
Owners can unbundle O&M, commissioning and telecom maintenance to separate vendors, increasing buyer options and diluting wallet share; the global renewable O&M market was estimated at about 27 billion USD in 2024, raising competitive pressure. Bundled lifecycle offerings create customer lock-in and recurring revenue, while transparent performance KPIs (availability, MTTR) improve retention.
- Unbundling: increases vendor choice
- Bundled lifecycle: locks recurring revenue
- KPIs: availability/MTTR drive renewals
3–6 month RFPs squeeze 1–3% margins as fixed‑price risk shifts to EPCs
Buyers run competitive RFPs (3–6 month cycles) on multi‑hundred‑MW deals, forcing 1–3% margin differentials in 2024 awards and strong price leverage.
Fixed‑price/GMPs and liquidated damages shift cost and schedule risk to EPCs, compressing contractor gross margins and increasing concessions.
Unbundling O&M (global market ~$27B in 2024) expands supplier choice; bundled lifecycle and Argan’s 2024 execution record raise perceived switching costs.
| Metric | 2024 | Impact |
|---|---|---|
| Bid cycle | 3–6 months | Faster decisions, tighter margins |
| Margin sensitivity | 1–3% | Win by small pricing moves |
| O&M market | $27B | More vendors, more pressure |
| Contract type | Fixed/GMP | Risk shifted to EPC |
What You See Is What You Get
Argan Porter's Five Forces Analysis
This preview shows Argan Porter's Five Forces Analysis exactly as delivered upon purchase, with full, professionally formatted content and no placeholders. The file you see is the same document you’ll download instantly after buying. It’s complete, ready to use, and tailored for immediate application.
Original: $10.00
-65%$10.00
$3.50Description
A Must-Have Tool for Decision-Makers
Argan's Porter's Five Forces snapshot highlights supplier leverage, buyer pressure, competitive rivalry, threat of new entrants, and substitutes, revealing key strategic tensions. This brief overview flags areas of strength and vulnerability. Ready for deeper insight? Unlock the full Porter's Five Forces Analysis to get force-by-force ratings, visuals, and actionable recommendations.
Suppliers Bargaining Power
Concentrated OEM equipment
Utility-scale turbines, HRSGs, switchgear and telecom systems are concentrated among a few global OEMs (top five OEMs control ~70% of global turbine shipments in 2024), giving suppliers significant leverage. Long lead times (turbines 12–24 months, HRSGs 9–18 months) and strict specs limit substitution, letting OEMs push unfavorable contract terms, spares markups (often 20–40%) and premium delivery slots (10–30% surcharge). Framework agreements and early procurement reduce but do not eliminate this supplier power.
Specialized skilled labor
EPC and telecom builds rely on certified craft labor and niche engineers, and 2024 BLS/JOLTS showed over 350,000 open construction jobs, pushing wage growth near 5% YoY and higher retention costs. Union rules and regional licensing constrain redeployment, while targeted workforce development and strategic subcontracting reduce supplier power and project risk.
Commodity and logistics volatility
Steel, copper, concrete and cabling costs remain cyclical: copper averaged about $9,500/ton in 2024 and hot‑rolled coil traded roughly $700–1,000/ton, with swings of 15–30% year‑to‑year.
Freight volatility — Shanghai‑LA box rates near $1,200/FEU in 2024, plus oversize and congestion surcharges adding 10–25% — disrupts schedules and raises costs.
Suppliers commonly pass through surcharges during spikes; hedging, indexed contracts and diversified lanes reduce but do not eliminate exposure.
Quality, safety, and compliance gating
Stringent QA/QC, safety and ESG gates (eg, ISO 9001, ISO 45001, NERC/industry-specific standards and formal ESG reporting) shrink the eligible supplier pool, increasing reliance on proven vendors; lapses in certification or safety audits can trigger stop-work orders and project delays. Approved vendor lists and recurring third-party audits sustain reliability while concentrating bargaining power with certified suppliers.
- Required certifications: ISO 9001, ISO 45001, NERC/industry standards
- Certification lapse → stop-work/project delay risk
- Approved vendor lists + audits increase supplier leverage
Digital tools and IP lock-in
Supplier squeeze in wind: top-5 OEMs ~70%, 12–24m lead times, labor gap
Suppliers hold strong bargaining power: top-five turbine OEMs ~70% of global shipments in 2024, long lead times (turbines 12–24m) and 20–40% spares markups. Skilled labor shortage (≈350,000 open construction jobs in 2024) and certification gates (ISO 9001/45001, NERC) concentrate leverage. Commodity and freight volatility (copper ~$9,500/ton; Shanghai‑LA ~$1,200/FEU) drive passthroughs; hedging and framework contracts partially mitigate.
| Metric | 2024 Value | Impact |
|---|---|---|
| Top-5 OEM share | ~70% | High supplier leverage |
| Lead times | 12–24m (turbines) | Switching friction |
| Open construction jobs | ≈350k | Wage pressure |
What is included in the product
Detailed Word Document
Concise Five Forces analysis tailored to Argan Porter that uncovers competitive drivers, supplier and buyer power, entrant and substitute threats, and strategic levers to protect margins and guide investor or management decisions.
Customizable Excel Spreadsheet
Clear one-sheet Porter's Five Forces for Argan—instantly highlights supplier, buyer, entrant, substitute and rivalry pressures so decision-makers can prioritize strategic fixes. Customizable pressure levels and a ready-to-use radar chart make it effortless to drop into decks or scenario tabs for rapid action.
Customers Bargaining Power
Large, sophisticated buyers
Utilities, IPPs, renewables developers, data centers and carriers run competitive RFPs benchmarking price, schedule and warranties across multiple EPCs; professional procurement teams routinely push concessions and tighter SLAs. Buyer scale—often multi-hundred‑MW or multi-site deals—amplifies negotiating leverage, shortening bid cycles to 3–6 months and compressing EPC margins.
Project-based, price-sensitive awards
Fixed-bid and GMP structures transfer cost and schedule risk to contractors, compressing typical contractor gross margins and forcing tight cost controls. Industry surveys in 2024 show awards often hinge on 1–3% margin differentials, so small pricing moves determine winners. Owners increasingly insist on liquidated damages and performance guarantees, while rigorous bid qualification processes in 2024 limit scope for premium pricing.
Switching costs moderate
Pre-award switching is relatively easy for clients, but post-award switching becomes costly due to mobilization and design-integration lock-in. Contract step-in rights and lender/owner remedies can still be used to pressure commercial terms. Strong documentation and change-order controls in Argan contracts reduce disputes and rework. Argan’s proven execution track record in 2024 increases perceived switching costs in its favor.
Financing and schedule pressures
Lenders’ technical advisors shape scope, milestones and covenants, and their approvals often determine draw schedules and compliance reporting. Delays can jeopardize tax-credit eligibility and IRS safe-harbor/COD timing that affected ITC/PTC claims in 2024, while missed CODs risk PPA penalties and buyer claims. Buyers use these timing pressures to demand acceleration without full compensation; demonstrable, credible schedule control reduces that leverage.
- Lender oversight: controls scope and draws
- Timing risk: IRS safe-harbor/COD impact on ITC/PTC (2024)
- Buyer leverage: acceleration demands vs. compensation
- Mitigation: credible schedule control lowers buyer bargaining power
Cross-selling O&M optionality
Owners can unbundle O&M, commissioning and telecom maintenance to separate vendors, increasing buyer options and diluting wallet share; the global renewable O&M market was estimated at about 27 billion USD in 2024, raising competitive pressure. Bundled lifecycle offerings create customer lock-in and recurring revenue, while transparent performance KPIs (availability, MTTR) improve retention.
- Unbundling: increases vendor choice
- Bundled lifecycle: locks recurring revenue
- KPIs: availability/MTTR drive renewals
3–6 month RFPs squeeze 1–3% margins as fixed‑price risk shifts to EPCs
Buyers run competitive RFPs (3–6 month cycles) on multi‑hundred‑MW deals, forcing 1–3% margin differentials in 2024 awards and strong price leverage.
Fixed‑price/GMPs and liquidated damages shift cost and schedule risk to EPCs, compressing contractor gross margins and increasing concessions.
Unbundling O&M (global market ~$27B in 2024) expands supplier choice; bundled lifecycle and Argan’s 2024 execution record raise perceived switching costs.
| Metric | 2024 | Impact |
|---|---|---|
| Bid cycle | 3–6 months | Faster decisions, tighter margins |
| Margin sensitivity | 1–3% | Win by small pricing moves |
| O&M market | $27B | More vendors, more pressure |
| Contract type | Fixed/GMP | Risk shifted to EPC |
What You See Is What You Get
Argan Porter's Five Forces Analysis
This preview shows Argan Porter's Five Forces Analysis exactly as delivered upon purchase, with full, professionally formatted content and no placeholders. The file you see is the same document you’ll download instantly after buying. It’s complete, ready to use, and tailored for immediate application.











