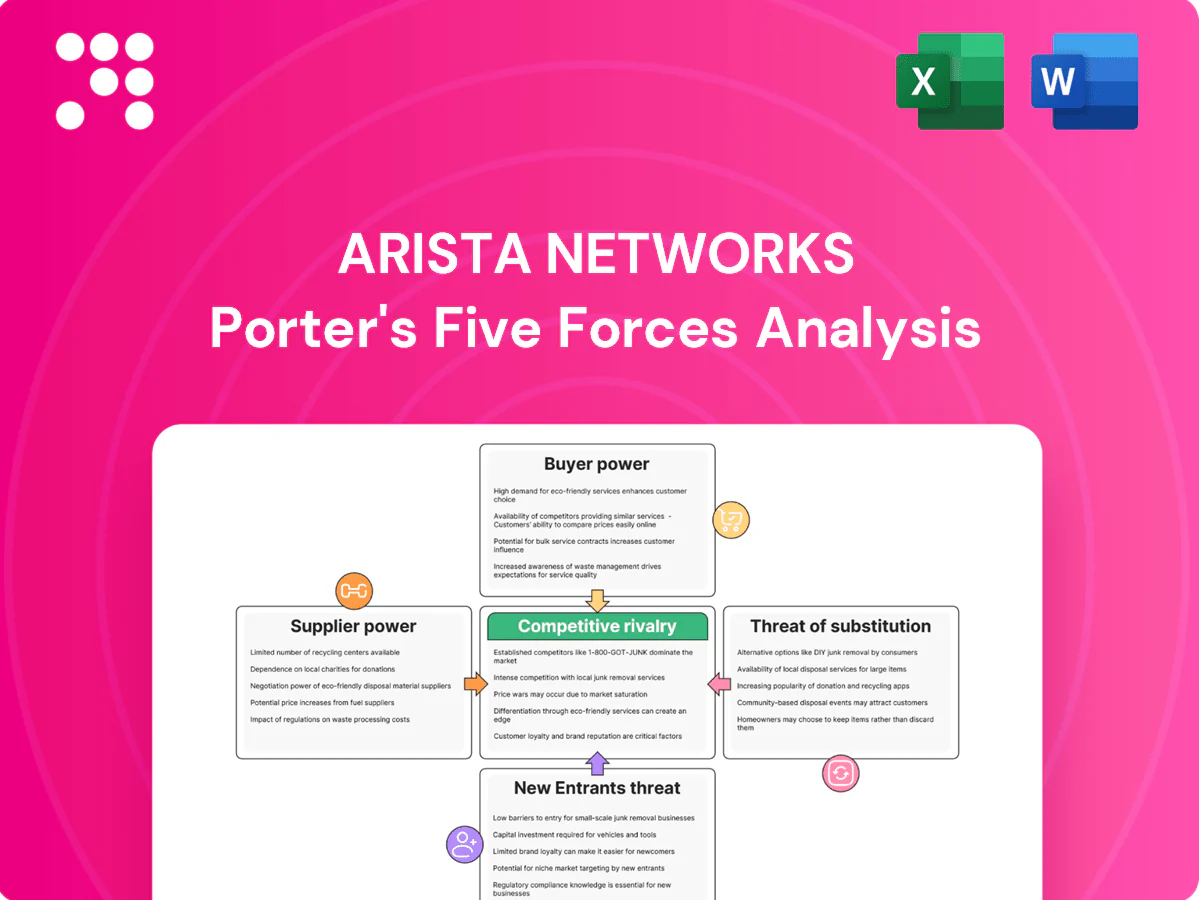
Arista Networks Porter's Five Forces Analysis

A Must-Have Tool for Decision-Makers
Arista Networks faces intense rivalry from legacy and cloud-native network vendors, strong buyer bargaining from hyperscalers, and moderate supplier influence for specialized silicon and optics; barriers to entry are high but software differentiation and cloud shifts create evolving threats. This brief snapshot only scratches the surface. Unlock the full Porter's Five Forces Analysis to explore Arista’s competitive dynamics in detail.
Suppliers Bargaining Power

Concentrated merchant silicon
Arista depends heavily on a few advanced merchant silicon suppliers, with Broadcom serving as the primary source for high‑speed switch ASICs, concentrating supplier power and raising switching costs. This concentration strengthens supplier leverage over pricing and product roadmaps, while alternatives such as Marvell (including Innovium) and Intel Tofino exist but are fewer at bleeding‑edge speeds. Multi‑sourcing and internal software/hardware design mitigations are improving redundancy but remain uneven across product tiers.
Optics and components tightness
Optics and components tightness: high-speed 400G/800G optics, PAM4 DSPs and advanced PCBs come from a handful of qualified vendors, with industry lead times often 12–24 weeks in 2024 and reported yield variability raising spot prices during demand spikes. Arista qualifies multiple suppliers but rigorous interoperability and reliability testing limits quick substitution. That testing cycle sustains supplier pricing power and influence.

Contract manufacturing dependence
Arista relies on EMS partners for assembly and testing, and while multiple global EMS providers exist, switching production lines or geographies is non-trivial and can take months. In 2024 the global EMS market was roughly $600 billion, and constrained capacity during tight cycles lets top EMS partners influence allocation, NPI speed and cost targets. Dual-sourcing and regional diversification reduce but do not eliminate supplier leverage.

Software and standards inputs
Arista’s core EOS is proprietary but interoperates with open standards, Linux and third-party platforms; dependence on merchant silicon SDKs (Broadcom held over 50% share of switch ASICs in 2024) can slow feature velocity and force roadmap reprioritization when vendors change APIs, yet Arista’s deep software stack mitigates single-supplier lock-in.
- EOS proprietary + open standards
- Merchant SDK dependence; Broadcom >50% (2024)
- Vendor API changes affect sequencing
- Software depth reduces supplier lock-in
Geopolitical and IP constraints
Geopolitical export controls and IP licensing shape Arista supplier choices: US/ALLIED restrictions expanded through 2023–2024 have concentrated advanced wafer supply (TSMC ~53% foundry share in 2023) and can abruptly favor or sideline specific suppliers, inserting regulatory shocks into supply relationships and non-market bargaining dynamics.
- Diversify suppliers and fabs
- Prioritize compliant sourcing
- Stress-test for regulatory shocks
- Protect IP via licensed stacks and audits
Supply concentration: >50% ASIC share, 12–24 wks optics
Supplier power high: Broadcom >50% switch ASIC share (2024), optics/PCBs with 12–24 week lead times in 2024, EMS market ~$600B (2024) concentrates allocation. Arista mitigates via multi‑sourcing, software depth (EOS) and qualifying alternatives, but substitution at bleeding edge remains slow. Geopolitics and foundry concentration (TSMC ~53% 2023) add regulatory risk.
| Metric | 2023/24 |
|---|---|
| Broadcom ASIC share | >50% (2024) |
| EMS market | ~$600B (2024) |
| Optics lead times | 12–24 wks (2024) |
| TSMC foundry share | ~53% (2023) |
What is included in the product
 Detailed Word Document
Tailored Porter's Five Forces analysis for Arista Networks uncovering key drivers of competitive rivalry, buyer and supplier power, threats from substitutes and new entrants, and identifying disruptive technologies and market dynamics that shape pricing, profitability, and strategic positioning.

 Customizable Excel Spreadsheet
One-sheet Porter's Five Forces for Arista Networks—quickly spot competitive pressures and reduce analysis time for board decks or investment memos.
Customers Bargaining Power

Hyperscaler volume leverage
Large cloud and AI data center customers (AWS, Microsoft, Google, Meta) concentrate a majority of Arista demand, with Arista reporting approximately $4.81B revenue in FY2024 and top hyperscalers driving roughly 60–65% of sales. Their scale grants strong price negotiation and sway over custom features and SLAs. They can dictate product roadmaps and delivery schedules, and losing one major hyperscaler would materially reduce growth visibility.
High switching costs, but not absolute
Arista’s EOS-driven network operating model and automation create high switching costs by embedding operational workflows, APIs and telemetry, supporting Arista’s FY2024 revenue of $3.95 billion and reinforcing customer stickiness. Yet many enterprise and cloud buyers pursue multi-vendor strategies—industry surveys in 2024 showed a majority opting for heterogeneous fabrics—to avoid single-vendor dependency. Standards-based architectures and SONiC adoption at the OSI layer reduce lock-in for whitebox and merchant-silicon deployments, balancing Arista’s differentiated value with sustained buyer leverage.

Performance and time-to-deploy focus
For AI/ML clusters and cloud fabrics buyers in 2024, latency (sub-millisecond), throughput (400G/800G fabrics) and power efficiency dominate purchase criteria, letting customers justify premium pricing when Arista shows clear performance leadership. When generations reach parity, aggressive discounting and deal-level rebates become common. Service levels, supply assurance and optics availability remain deal-critical and can swing procurement decisions rapidly.

Customization and co-development
Top customers, especially hyperscalers and cloud providers, request features, telemetry, and stack-specific integrations that deepen technical relationships but drive customer-specific engineering and higher implementation cost; successful co-development shifts bargaining power toward the customer while increasing product stickiness and renewal likelihood.
- Customer-driven features increase engineering effort
- Co-development elevates customer bargaining power
- Delivered integrations raise switching costs and stickiness
Global enterprise diversification
Enterprises, service providers and financials broaden Arista's customer base; fiscal 2024 revenue was $3.83B, with hyperscalers still concentrated but individual non-hyperscalers exerting less bargaining power. Collectively they stabilize pricing and product mix, reducing revenue volatility. Channel partners retain negotiation room but face more standardized commercial terms.
- Diversified base
- Pricing stability
- Mix benefits
- Limited channel leverage
Hyperscalers drive 60–65% demand; FY24 revenue $4.81B
Large hyperscalers drive 60–65% of Arista demand, giving them strong price and roadmap leverage; FY2024 revenue was $4.81B. EOS/automation create high switching costs and stickiness, but multi-vendor strategies and SONiC soften lock-in. Performance leadership (400G/800G, low latency) lets Arista command premiums until parity triggers discounts.
| Metric | Value |
|---|---|
| FY2024 revenue | $4.81B |
| Hyperscaler share | 60–65% |
| Key priorities | 400G/800G, sub-ms latency |
What You See Is What You Get
Arista Networks Porter's Five Forces Analysis
This preview shows the exact Porter's Five Forces analysis of Arista Networks you'll receive upon purchase—no placeholders or condensed samples. It evaluates competitive rivalry, supplier and buyer power, threat of substitutes, and barriers to entry with data-driven insights and actionable implications. The full document is fully formatted and available for immediate download after payment.

A Must-Have Tool for Decision-Makers
Arista Networks faces intense rivalry from legacy and cloud-native network vendors, strong buyer bargaining from hyperscalers, and moderate supplier influence for specialized silicon and optics; barriers to entry are high but software differentiation and cloud shifts create evolving threats. This brief snapshot only scratches the surface. Unlock the full Porter's Five Forces Analysis to explore Arista’s competitive dynamics in detail.
Suppliers Bargaining Power
Concentrated merchant silicon
Arista depends heavily on a few advanced merchant silicon suppliers, with Broadcom serving as the primary source for high‑speed switch ASICs, concentrating supplier power and raising switching costs. This concentration strengthens supplier leverage over pricing and product roadmaps, while alternatives such as Marvell (including Innovium) and Intel Tofino exist but are fewer at bleeding‑edge speeds. Multi‑sourcing and internal software/hardware design mitigations are improving redundancy but remain uneven across product tiers.
Optics and components tightness
Optics and components tightness: high-speed 400G/800G optics, PAM4 DSPs and advanced PCBs come from a handful of qualified vendors, with industry lead times often 12–24 weeks in 2024 and reported yield variability raising spot prices during demand spikes. Arista qualifies multiple suppliers but rigorous interoperability and reliability testing limits quick substitution. That testing cycle sustains supplier pricing power and influence.
Contract manufacturing dependence
Arista relies on EMS partners for assembly and testing, and while multiple global EMS providers exist, switching production lines or geographies is non-trivial and can take months. In 2024 the global EMS market was roughly $600 billion, and constrained capacity during tight cycles lets top EMS partners influence allocation, NPI speed and cost targets. Dual-sourcing and regional diversification reduce but do not eliminate supplier leverage.
Software and standards inputs
Arista’s core EOS is proprietary but interoperates with open standards, Linux and third-party platforms; dependence on merchant silicon SDKs (Broadcom held over 50% share of switch ASICs in 2024) can slow feature velocity and force roadmap reprioritization when vendors change APIs, yet Arista’s deep software stack mitigates single-supplier lock-in.
- EOS proprietary + open standards
- Merchant SDK dependence; Broadcom >50% (2024)
- Vendor API changes affect sequencing
- Software depth reduces supplier lock-in
Geopolitical and IP constraints
Geopolitical export controls and IP licensing shape Arista supplier choices: US/ALLIED restrictions expanded through 2023–2024 have concentrated advanced wafer supply (TSMC ~53% foundry share in 2023) and can abruptly favor or sideline specific suppliers, inserting regulatory shocks into supply relationships and non-market bargaining dynamics.
- Diversify suppliers and fabs
- Prioritize compliant sourcing
- Stress-test for regulatory shocks
- Protect IP via licensed stacks and audits
Supply concentration: >50% ASIC share, 12–24 wks optics
Supplier power high: Broadcom >50% switch ASIC share (2024), optics/PCBs with 12–24 week lead times in 2024, EMS market ~$600B (2024) concentrates allocation. Arista mitigates via multi‑sourcing, software depth (EOS) and qualifying alternatives, but substitution at bleeding edge remains slow. Geopolitics and foundry concentration (TSMC ~53% 2023) add regulatory risk.
| Metric | 2023/24 |
|---|---|
| Broadcom ASIC share | >50% (2024) |
| EMS market | ~$600B (2024) |
| Optics lead times | 12–24 wks (2024) |
| TSMC foundry share | ~53% (2023) |
What is included in the product
Detailed Word Document
Tailored Porter's Five Forces analysis for Arista Networks uncovering key drivers of competitive rivalry, buyer and supplier power, threats from substitutes and new entrants, and identifying disruptive technologies and market dynamics that shape pricing, profitability, and strategic positioning.
Customizable Excel Spreadsheet
One-sheet Porter's Five Forces for Arista Networks—quickly spot competitive pressures and reduce analysis time for board decks or investment memos.
Customers Bargaining Power
Hyperscaler volume leverage
Large cloud and AI data center customers (AWS, Microsoft, Google, Meta) concentrate a majority of Arista demand, with Arista reporting approximately $4.81B revenue in FY2024 and top hyperscalers driving roughly 60–65% of sales. Their scale grants strong price negotiation and sway over custom features and SLAs. They can dictate product roadmaps and delivery schedules, and losing one major hyperscaler would materially reduce growth visibility.
High switching costs, but not absolute
Arista’s EOS-driven network operating model and automation create high switching costs by embedding operational workflows, APIs and telemetry, supporting Arista’s FY2024 revenue of $3.95 billion and reinforcing customer stickiness. Yet many enterprise and cloud buyers pursue multi-vendor strategies—industry surveys in 2024 showed a majority opting for heterogeneous fabrics—to avoid single-vendor dependency. Standards-based architectures and SONiC adoption at the OSI layer reduce lock-in for whitebox and merchant-silicon deployments, balancing Arista’s differentiated value with sustained buyer leverage.
Performance and time-to-deploy focus
For AI/ML clusters and cloud fabrics buyers in 2024, latency (sub-millisecond), throughput (400G/800G fabrics) and power efficiency dominate purchase criteria, letting customers justify premium pricing when Arista shows clear performance leadership. When generations reach parity, aggressive discounting and deal-level rebates become common. Service levels, supply assurance and optics availability remain deal-critical and can swing procurement decisions rapidly.
Customization and co-development
Top customers, especially hyperscalers and cloud providers, request features, telemetry, and stack-specific integrations that deepen technical relationships but drive customer-specific engineering and higher implementation cost; successful co-development shifts bargaining power toward the customer while increasing product stickiness and renewal likelihood.
- Customer-driven features increase engineering effort
- Co-development elevates customer bargaining power
- Delivered integrations raise switching costs and stickiness
Global enterprise diversification
Enterprises, service providers and financials broaden Arista's customer base; fiscal 2024 revenue was $3.83B, with hyperscalers still concentrated but individual non-hyperscalers exerting less bargaining power. Collectively they stabilize pricing and product mix, reducing revenue volatility. Channel partners retain negotiation room but face more standardized commercial terms.
- Diversified base
- Pricing stability
- Mix benefits
- Limited channel leverage
Hyperscalers drive 60–65% demand; FY24 revenue $4.81B
Large hyperscalers drive 60–65% of Arista demand, giving them strong price and roadmap leverage; FY2024 revenue was $4.81B. EOS/automation create high switching costs and stickiness, but multi-vendor strategies and SONiC soften lock-in. Performance leadership (400G/800G, low latency) lets Arista command premiums until parity triggers discounts.
| Metric | Value |
|---|---|
| FY2024 revenue | $4.81B |
| Hyperscaler share | 60–65% |
| Key priorities | 400G/800G, sub-ms latency |
What You See Is What You Get
Arista Networks Porter's Five Forces Analysis
This preview shows the exact Porter's Five Forces analysis of Arista Networks you'll receive upon purchase—no placeholders or condensed samples. It evaluates competitive rivalry, supplier and buyer power, threat of substitutes, and barriers to entry with data-driven insights and actionable implications. The full document is fully formatted and available for immediate download after payment.
Description
A Must-Have Tool for Decision-Makers
Arista Networks faces intense rivalry from legacy and cloud-native network vendors, strong buyer bargaining from hyperscalers, and moderate supplier influence for specialized silicon and optics; barriers to entry are high but software differentiation and cloud shifts create evolving threats. This brief snapshot only scratches the surface. Unlock the full Porter's Five Forces Analysis to explore Arista’s competitive dynamics in detail.
Suppliers Bargaining Power
Concentrated merchant silicon
Arista depends heavily on a few advanced merchant silicon suppliers, with Broadcom serving as the primary source for high‑speed switch ASICs, concentrating supplier power and raising switching costs. This concentration strengthens supplier leverage over pricing and product roadmaps, while alternatives such as Marvell (including Innovium) and Intel Tofino exist but are fewer at bleeding‑edge speeds. Multi‑sourcing and internal software/hardware design mitigations are improving redundancy but remain uneven across product tiers.
Optics and components tightness
Optics and components tightness: high-speed 400G/800G optics, PAM4 DSPs and advanced PCBs come from a handful of qualified vendors, with industry lead times often 12–24 weeks in 2024 and reported yield variability raising spot prices during demand spikes. Arista qualifies multiple suppliers but rigorous interoperability and reliability testing limits quick substitution. That testing cycle sustains supplier pricing power and influence.
Contract manufacturing dependence
Arista relies on EMS partners for assembly and testing, and while multiple global EMS providers exist, switching production lines or geographies is non-trivial and can take months. In 2024 the global EMS market was roughly $600 billion, and constrained capacity during tight cycles lets top EMS partners influence allocation, NPI speed and cost targets. Dual-sourcing and regional diversification reduce but do not eliminate supplier leverage.
Software and standards inputs
Arista’s core EOS is proprietary but interoperates with open standards, Linux and third-party platforms; dependence on merchant silicon SDKs (Broadcom held over 50% share of switch ASICs in 2024) can slow feature velocity and force roadmap reprioritization when vendors change APIs, yet Arista’s deep software stack mitigates single-supplier lock-in.
- EOS proprietary + open standards
- Merchant SDK dependence; Broadcom >50% (2024)
- Vendor API changes affect sequencing
- Software depth reduces supplier lock-in
Geopolitical and IP constraints
Geopolitical export controls and IP licensing shape Arista supplier choices: US/ALLIED restrictions expanded through 2023–2024 have concentrated advanced wafer supply (TSMC ~53% foundry share in 2023) and can abruptly favor or sideline specific suppliers, inserting regulatory shocks into supply relationships and non-market bargaining dynamics.
- Diversify suppliers and fabs
- Prioritize compliant sourcing
- Stress-test for regulatory shocks
- Protect IP via licensed stacks and audits
Supply concentration: >50% ASIC share, 12–24 wks optics
Supplier power high: Broadcom >50% switch ASIC share (2024), optics/PCBs with 12–24 week lead times in 2024, EMS market ~$600B (2024) concentrates allocation. Arista mitigates via multi‑sourcing, software depth (EOS) and qualifying alternatives, but substitution at bleeding edge remains slow. Geopolitics and foundry concentration (TSMC ~53% 2023) add regulatory risk.
| Metric | 2023/24 |
|---|---|
| Broadcom ASIC share | >50% (2024) |
| EMS market | ~$600B (2024) |
| Optics lead times | 12–24 wks (2024) |
| TSMC foundry share | ~53% (2023) |
What is included in the product
Detailed Word Document
Tailored Porter's Five Forces analysis for Arista Networks uncovering key drivers of competitive rivalry, buyer and supplier power, threats from substitutes and new entrants, and identifying disruptive technologies and market dynamics that shape pricing, profitability, and strategic positioning.
Customizable Excel Spreadsheet
One-sheet Porter's Five Forces for Arista Networks—quickly spot competitive pressures and reduce analysis time for board decks or investment memos.
Customers Bargaining Power
Hyperscaler volume leverage
Large cloud and AI data center customers (AWS, Microsoft, Google, Meta) concentrate a majority of Arista demand, with Arista reporting approximately $4.81B revenue in FY2024 and top hyperscalers driving roughly 60–65% of sales. Their scale grants strong price negotiation and sway over custom features and SLAs. They can dictate product roadmaps and delivery schedules, and losing one major hyperscaler would materially reduce growth visibility.
High switching costs, but not absolute
Arista’s EOS-driven network operating model and automation create high switching costs by embedding operational workflows, APIs and telemetry, supporting Arista’s FY2024 revenue of $3.95 billion and reinforcing customer stickiness. Yet many enterprise and cloud buyers pursue multi-vendor strategies—industry surveys in 2024 showed a majority opting for heterogeneous fabrics—to avoid single-vendor dependency. Standards-based architectures and SONiC adoption at the OSI layer reduce lock-in for whitebox and merchant-silicon deployments, balancing Arista’s differentiated value with sustained buyer leverage.
Performance and time-to-deploy focus
For AI/ML clusters and cloud fabrics buyers in 2024, latency (sub-millisecond), throughput (400G/800G fabrics) and power efficiency dominate purchase criteria, letting customers justify premium pricing when Arista shows clear performance leadership. When generations reach parity, aggressive discounting and deal-level rebates become common. Service levels, supply assurance and optics availability remain deal-critical and can swing procurement decisions rapidly.
Customization and co-development
Top customers, especially hyperscalers and cloud providers, request features, telemetry, and stack-specific integrations that deepen technical relationships but drive customer-specific engineering and higher implementation cost; successful co-development shifts bargaining power toward the customer while increasing product stickiness and renewal likelihood.
- Customer-driven features increase engineering effort
- Co-development elevates customer bargaining power
- Delivered integrations raise switching costs and stickiness
Global enterprise diversification
Enterprises, service providers and financials broaden Arista's customer base; fiscal 2024 revenue was $3.83B, with hyperscalers still concentrated but individual non-hyperscalers exerting less bargaining power. Collectively they stabilize pricing and product mix, reducing revenue volatility. Channel partners retain negotiation room but face more standardized commercial terms.
- Diversified base
- Pricing stability
- Mix benefits
- Limited channel leverage
Hyperscalers drive 60–65% demand; FY24 revenue $4.81B
Large hyperscalers drive 60–65% of Arista demand, giving them strong price and roadmap leverage; FY2024 revenue was $4.81B. EOS/automation create high switching costs and stickiness, but multi-vendor strategies and SONiC soften lock-in. Performance leadership (400G/800G, low latency) lets Arista command premiums until parity triggers discounts.
| Metric | Value |
|---|---|
| FY2024 revenue | $4.81B |
| Hyperscaler share | 60–65% |
| Key priorities | 400G/800G, sub-ms latency |
What You See Is What You Get
Arista Networks Porter's Five Forces Analysis
This preview shows the exact Porter's Five Forces analysis of Arista Networks you'll receive upon purchase—no placeholders or condensed samples. It evaluates competitive rivalry, supplier and buyer power, threat of substitutes, and barriers to entry with data-driven insights and actionable implications. The full document is fully formatted and available for immediate download after payment.











