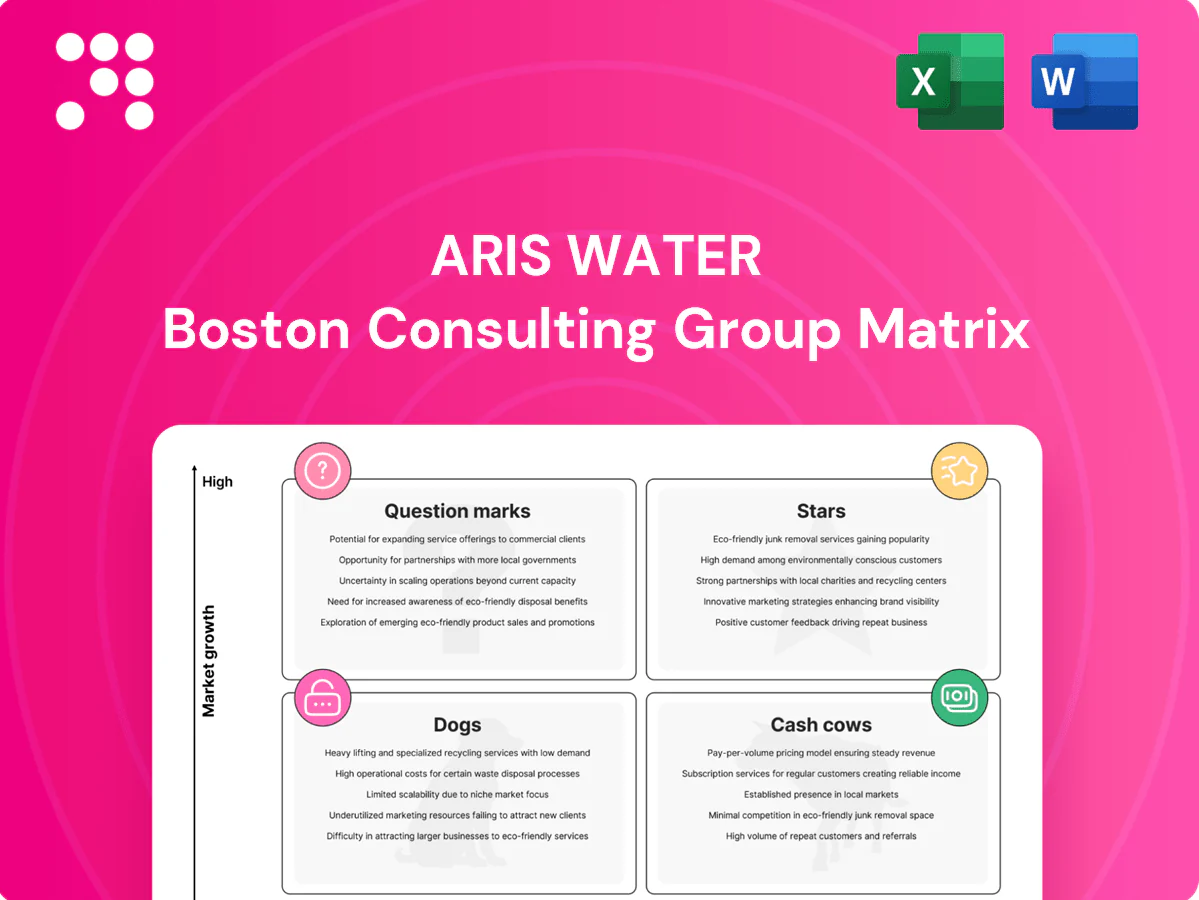
Aris Water Boston Consulting Group Matrix

Visual. Strategic. Downloadable.
Aris Water’s BCG Matrix here gives you a quick snapshot of who’s leading, who’s draining cash, and where the real upside sits—but it’s only the tip of the iceberg. Buy the full BCG Matrix for quadrant-by-quadrant placements, data-backed recommendations, and a clear action plan you can use now. You’ll get a polished Word report plus an editable Excel summary, ready to present or plug into your planning. Purchase now and stop guessing—start allocating capital with confidence.
Stars

Recycling hubs
Recycling hubs hold >40% market share in produced-water recycling across Aris Water’s key plays in 2024, with the produced-water services market still expanding at roughly 10% YoY. These hubs increase customer stickiness by displacing trucking and freshwater sourcing, delivering unit cost reductions and operational resilience. They absorb capital for capacity, storage and quality upgrades (capex ~$50–100m range today) but should be continuously funded to mature into cash cows as growth moderates.
Integrated pipelines
End-to-end integrated pipelines are category leaders in the expanding midstream water market, winning on safety, lower unit cost and uptime, and they scale rapidly; capital hungry, yes, but cash in roughly matches cash out today. Focus investment on infill laterals and interconnects to lock in share and raise network barriers to entry, accelerating utilization and margin capture as volumes grow.

Permian scale
Aris’s large Permian footprint gives it high local share in the fastest-growing basin — the Permian averaged about 5.7 million b/d in 2024 per EIA, driving outsized water demand. Scale lowers unit costs and improves service levels through denser logistics and reuse networks. Defending nodes requires incremental sales effort and tie-in capital to secure well connections. Continue building density to pre-empt challengers closing gaps.

Closed-loop ops
Closed-loop systems are becoming the standard for ESG-minded operators; the global water reuse market was ~USD 8B in 2024 and is expanding as regulations tighten, where Aris leads deployments and wins integrated customers. Rapid project growth soaks up project cash and working capital; fund aggressively to sustain momentum and deepen the moat.
- Position: Stars
- 2024 market: ~USD 8B
- Cash: high working capital draw
- Action: aggressive funding
- Moat: strengthens with each integrated customer
Operator alliances
Operator alliances are multi-year, multi-asset partnerships that place Aris at the center of customer water strategies; in 2024 industry surveys indicated roughly 68% of U.S. shale operators favor integrated water service partners. These alliances scale with customers’ drilling programs and require continuous service upgrades and systems integration. Aris should invest to cement exclusivity and protect share as volumes ramp.
- Multi-year centrality
- Scales with drilling
- Requires integration
- Invest to secure exclusivity
Recycling hubs >40% share; reuse market ~USD 8B; Permian density builds moat
Stars: recycling hubs >40% share in produced-water recycling (2024); produced-water services growing ~10% YoY. Integrated pipelines and closed-loop reuse (global reuse market ~USD 8B in 2024) scale quickly but absorb capex (~USD 50–100m per hub) and working capital; Permian density (5.7M b/d 2024) and 68% operator preference for integrated partners drive stickiness and moat.
| Metric | 2024 |
|---|---|
| Recycling hub share | >40% |
| Market growth | ~10% YoY |
| Reuse market | ~USD 8B |
| Permian crude | 5.7M b/d |
| Operator preference | 68% |
| Hub capex | USD 50–100m |
What is included in the product
 Detailed Word Document
Aris Water BCG Matrix: quadrant-specific analysis with clear invest, hold, and divest recommendations.

 Customizable Excel Spreadsheet
One-page Aris Water BCG Matrix highlighting weak assets and growth opportunities for faster, clearer portfolio fixes.
Cash Cows

Disposal network
Established SWD capacity in mature zones delivers steady cash flows with modest growth but high margins on base volumes. Capex requirements are low in 2024, focused on maintenance and regulatory compliance rather than expansion. Priority is maintaining permits, optimizing injection rates and well integrity, and milking predictable EBITDA from stable disposal throughput.
Long-term contracts
Long-term take-or-pay and MVC contracts deliver steady cash flow, typically covering about 80% of contracted volumes in 2024 with limited upside; pricing is largely fixed and annual churn remains low, often under 5%. Support costs fall to roughly 8–10% of revenue once operations stabilize. Priorities: maintain 99.5%+ uptime, drive renewals, and minimize leakage and claims.

Tariff revenues
Pipeline tariffs on recurring barrels deliver high-margin, low-touch income, with midstream transport EBITDA margins typically in the 50–70% range in 2024; mature corridor growth is often single-digit. With infrastructure already in the ground, efficiency tweaks—reducing leak loss by 1–2% and lowering OPEX—add material dollars. Protecting integrity and indexing tariffs to 2024 CPI (US 3.4%) preserves real cash flows.

O&M services
O&M services generate predictable, high-margin cash flows for Aris Water by servicing existing assets; margins are stable because revenue ties to base volumes rather than new-build cycles. Cash outlay for O&M is low relative to inflows, supporting strong free cash conversion. Industry studies 2022–2024 show digitalization can cut O&M costs 15–25%, so standardize SOPs and automate reporting to harvest the cost curve.
- Recurring revenue focus
- Low capital intensity
- Standardize SOPs
- Automate reporting
- Target 15–25% O&M cost reduction (2022–24 studies)
Water balancing
Water balancing is a sticky, low-growth daily sourcing, transfer, and scheduling service for core customers that in 2024 continues to monetize established relationships with minimal incremental capex. Margins benefit from network density and route optimization, making it a cash cow within Aris Water’s BCG matrix. Maintain service quality and bundle with higher-value offerings to protect churn and unlock upsell.
- Service: daily sourcing, transfer, scheduling
- Growth: low, stable in 2024
- Capex: minimal incremental
- Margin drivers: network density, optimization
- Strategy: preserve quality, bundle upsells
High-margin SWD pipeline: 2024 cash flow with ~80% contract cover and 50-70% EBITDA
Established SWD and pipeline assets produce steady high-margin cash flow in 2024 (pipeline EBITDA 50–70%, contracts cover ~80% volumes, churn <5%).
Low 2024 capex (maintenance-focused), support costs ~8–10% revenue, uptime target 99.5%+, CPI indexing ~3.4% preserves real tariffs.
O&M digitalization can cut costs 15–25%, improving free cash conversion; water balancing and daily services remain low-growth, sticky cash cows.
| Metric | 2024 Value |
|---|---|
| Contract coverage | ~80% |
| Pipeline EBITDA | 50–70% |
| Support costs | 8–10% |
| CPI (US) | 3.4% |
| O&M savings (est.) | 15–25% |
What You’re Viewing Is Included
Aris Water BCG Matrix
The Aris Water BCG Matrix you’re previewing is the exact file you’ll receive after purchase. No watermarks, no demo text—just the finished, fully formatted strategic report. It’s built for immediate editing, printing, or presenting to stakeholders. After purchase the same document is delivered straight to your inbox—no surprises, no extra work. Ready to plug into your planning or client decks right away.

Visual. Strategic. Downloadable.
Aris Water’s BCG Matrix here gives you a quick snapshot of who’s leading, who’s draining cash, and where the real upside sits—but it’s only the tip of the iceberg. Buy the full BCG Matrix for quadrant-by-quadrant placements, data-backed recommendations, and a clear action plan you can use now. You’ll get a polished Word report plus an editable Excel summary, ready to present or plug into your planning. Purchase now and stop guessing—start allocating capital with confidence.
Stars
Recycling hubs
Recycling hubs hold >40% market share in produced-water recycling across Aris Water’s key plays in 2024, with the produced-water services market still expanding at roughly 10% YoY. These hubs increase customer stickiness by displacing trucking and freshwater sourcing, delivering unit cost reductions and operational resilience. They absorb capital for capacity, storage and quality upgrades (capex ~$50–100m range today) but should be continuously funded to mature into cash cows as growth moderates.
Integrated pipelines
End-to-end integrated pipelines are category leaders in the expanding midstream water market, winning on safety, lower unit cost and uptime, and they scale rapidly; capital hungry, yes, but cash in roughly matches cash out today. Focus investment on infill laterals and interconnects to lock in share and raise network barriers to entry, accelerating utilization and margin capture as volumes grow.
Permian scale
Aris’s large Permian footprint gives it high local share in the fastest-growing basin — the Permian averaged about 5.7 million b/d in 2024 per EIA, driving outsized water demand. Scale lowers unit costs and improves service levels through denser logistics and reuse networks. Defending nodes requires incremental sales effort and tie-in capital to secure well connections. Continue building density to pre-empt challengers closing gaps.
Closed-loop ops
Closed-loop systems are becoming the standard for ESG-minded operators; the global water reuse market was ~USD 8B in 2024 and is expanding as regulations tighten, where Aris leads deployments and wins integrated customers. Rapid project growth soaks up project cash and working capital; fund aggressively to sustain momentum and deepen the moat.
- Position: Stars
- 2024 market: ~USD 8B
- Cash: high working capital draw
- Action: aggressive funding
- Moat: strengthens with each integrated customer
Operator alliances
Operator alliances are multi-year, multi-asset partnerships that place Aris at the center of customer water strategies; in 2024 industry surveys indicated roughly 68% of U.S. shale operators favor integrated water service partners. These alliances scale with customers’ drilling programs and require continuous service upgrades and systems integration. Aris should invest to cement exclusivity and protect share as volumes ramp.
- Multi-year centrality
- Scales with drilling
- Requires integration
- Invest to secure exclusivity
Recycling hubs >40% share; reuse market ~USD 8B; Permian density builds moat
Stars: recycling hubs >40% share in produced-water recycling (2024); produced-water services growing ~10% YoY. Integrated pipelines and closed-loop reuse (global reuse market ~USD 8B in 2024) scale quickly but absorb capex (~USD 50–100m per hub) and working capital; Permian density (5.7M b/d 2024) and 68% operator preference for integrated partners drive stickiness and moat.
| Metric | 2024 |
|---|---|
| Recycling hub share | >40% |
| Market growth | ~10% YoY |
| Reuse market | ~USD 8B |
| Permian crude | 5.7M b/d |
| Operator preference | 68% |
| Hub capex | USD 50–100m |
What is included in the product
Detailed Word Document
Aris Water BCG Matrix: quadrant-specific analysis with clear invest, hold, and divest recommendations.
Customizable Excel Spreadsheet
One-page Aris Water BCG Matrix highlighting weak assets and growth opportunities for faster, clearer portfolio fixes.
Cash Cows
Disposal network
Established SWD capacity in mature zones delivers steady cash flows with modest growth but high margins on base volumes. Capex requirements are low in 2024, focused on maintenance and regulatory compliance rather than expansion. Priority is maintaining permits, optimizing injection rates and well integrity, and milking predictable EBITDA from stable disposal throughput.
Long-term contracts
Long-term take-or-pay and MVC contracts deliver steady cash flow, typically covering about 80% of contracted volumes in 2024 with limited upside; pricing is largely fixed and annual churn remains low, often under 5%. Support costs fall to roughly 8–10% of revenue once operations stabilize. Priorities: maintain 99.5%+ uptime, drive renewals, and minimize leakage and claims.
Tariff revenues
Pipeline tariffs on recurring barrels deliver high-margin, low-touch income, with midstream transport EBITDA margins typically in the 50–70% range in 2024; mature corridor growth is often single-digit. With infrastructure already in the ground, efficiency tweaks—reducing leak loss by 1–2% and lowering OPEX—add material dollars. Protecting integrity and indexing tariffs to 2024 CPI (US 3.4%) preserves real cash flows.
O&M services
O&M services generate predictable, high-margin cash flows for Aris Water by servicing existing assets; margins are stable because revenue ties to base volumes rather than new-build cycles. Cash outlay for O&M is low relative to inflows, supporting strong free cash conversion. Industry studies 2022–2024 show digitalization can cut O&M costs 15–25%, so standardize SOPs and automate reporting to harvest the cost curve.
- Recurring revenue focus
- Low capital intensity
- Standardize SOPs
- Automate reporting
- Target 15–25% O&M cost reduction (2022–24 studies)
Water balancing
Water balancing is a sticky, low-growth daily sourcing, transfer, and scheduling service for core customers that in 2024 continues to monetize established relationships with minimal incremental capex. Margins benefit from network density and route optimization, making it a cash cow within Aris Water’s BCG matrix. Maintain service quality and bundle with higher-value offerings to protect churn and unlock upsell.
- Service: daily sourcing, transfer, scheduling
- Growth: low, stable in 2024
- Capex: minimal incremental
- Margin drivers: network density, optimization
- Strategy: preserve quality, bundle upsells
High-margin SWD pipeline: 2024 cash flow with ~80% contract cover and 50-70% EBITDA
Established SWD and pipeline assets produce steady high-margin cash flow in 2024 (pipeline EBITDA 50–70%, contracts cover ~80% volumes, churn <5%).
Low 2024 capex (maintenance-focused), support costs ~8–10% revenue, uptime target 99.5%+, CPI indexing ~3.4% preserves real tariffs.
O&M digitalization can cut costs 15–25%, improving free cash conversion; water balancing and daily services remain low-growth, sticky cash cows.
| Metric | 2024 Value |
|---|---|
| Contract coverage | ~80% |
| Pipeline EBITDA | 50–70% |
| Support costs | 8–10% |
| CPI (US) | 3.4% |
| O&M savings (est.) | 15–25% |
What You’re Viewing Is Included
Aris Water BCG Matrix
The Aris Water BCG Matrix you’re previewing is the exact file you’ll receive after purchase. No watermarks, no demo text—just the finished, fully formatted strategic report. It’s built for immediate editing, printing, or presenting to stakeholders. After purchase the same document is delivered straight to your inbox—no surprises, no extra work. Ready to plug into your planning or client decks right away.
Original: $10.00
-65%$10.00
$3.50Description
Visual. Strategic. Downloadable.
Aris Water’s BCG Matrix here gives you a quick snapshot of who’s leading, who’s draining cash, and where the real upside sits—but it’s only the tip of the iceberg. Buy the full BCG Matrix for quadrant-by-quadrant placements, data-backed recommendations, and a clear action plan you can use now. You’ll get a polished Word report plus an editable Excel summary, ready to present or plug into your planning. Purchase now and stop guessing—start allocating capital with confidence.
Stars
Recycling hubs
Recycling hubs hold >40% market share in produced-water recycling across Aris Water’s key plays in 2024, with the produced-water services market still expanding at roughly 10% YoY. These hubs increase customer stickiness by displacing trucking and freshwater sourcing, delivering unit cost reductions and operational resilience. They absorb capital for capacity, storage and quality upgrades (capex ~$50–100m range today) but should be continuously funded to mature into cash cows as growth moderates.
Integrated pipelines
End-to-end integrated pipelines are category leaders in the expanding midstream water market, winning on safety, lower unit cost and uptime, and they scale rapidly; capital hungry, yes, but cash in roughly matches cash out today. Focus investment on infill laterals and interconnects to lock in share and raise network barriers to entry, accelerating utilization and margin capture as volumes grow.
Permian scale
Aris’s large Permian footprint gives it high local share in the fastest-growing basin — the Permian averaged about 5.7 million b/d in 2024 per EIA, driving outsized water demand. Scale lowers unit costs and improves service levels through denser logistics and reuse networks. Defending nodes requires incremental sales effort and tie-in capital to secure well connections. Continue building density to pre-empt challengers closing gaps.
Closed-loop ops
Closed-loop systems are becoming the standard for ESG-minded operators; the global water reuse market was ~USD 8B in 2024 and is expanding as regulations tighten, where Aris leads deployments and wins integrated customers. Rapid project growth soaks up project cash and working capital; fund aggressively to sustain momentum and deepen the moat.
- Position: Stars
- 2024 market: ~USD 8B
- Cash: high working capital draw
- Action: aggressive funding
- Moat: strengthens with each integrated customer
Operator alliances
Operator alliances are multi-year, multi-asset partnerships that place Aris at the center of customer water strategies; in 2024 industry surveys indicated roughly 68% of U.S. shale operators favor integrated water service partners. These alliances scale with customers’ drilling programs and require continuous service upgrades and systems integration. Aris should invest to cement exclusivity and protect share as volumes ramp.
- Multi-year centrality
- Scales with drilling
- Requires integration
- Invest to secure exclusivity
Recycling hubs >40% share; reuse market ~USD 8B; Permian density builds moat
Stars: recycling hubs >40% share in produced-water recycling (2024); produced-water services growing ~10% YoY. Integrated pipelines and closed-loop reuse (global reuse market ~USD 8B in 2024) scale quickly but absorb capex (~USD 50–100m per hub) and working capital; Permian density (5.7M b/d 2024) and 68% operator preference for integrated partners drive stickiness and moat.
| Metric | 2024 |
|---|---|
| Recycling hub share | >40% |
| Market growth | ~10% YoY |
| Reuse market | ~USD 8B |
| Permian crude | 5.7M b/d |
| Operator preference | 68% |
| Hub capex | USD 50–100m |
What is included in the product
Detailed Word Document
Aris Water BCG Matrix: quadrant-specific analysis with clear invest, hold, and divest recommendations.
Customizable Excel Spreadsheet
One-page Aris Water BCG Matrix highlighting weak assets and growth opportunities for faster, clearer portfolio fixes.
Cash Cows
Disposal network
Established SWD capacity in mature zones delivers steady cash flows with modest growth but high margins on base volumes. Capex requirements are low in 2024, focused on maintenance and regulatory compliance rather than expansion. Priority is maintaining permits, optimizing injection rates and well integrity, and milking predictable EBITDA from stable disposal throughput.
Long-term contracts
Long-term take-or-pay and MVC contracts deliver steady cash flow, typically covering about 80% of contracted volumes in 2024 with limited upside; pricing is largely fixed and annual churn remains low, often under 5%. Support costs fall to roughly 8–10% of revenue once operations stabilize. Priorities: maintain 99.5%+ uptime, drive renewals, and minimize leakage and claims.
Tariff revenues
Pipeline tariffs on recurring barrels deliver high-margin, low-touch income, with midstream transport EBITDA margins typically in the 50–70% range in 2024; mature corridor growth is often single-digit. With infrastructure already in the ground, efficiency tweaks—reducing leak loss by 1–2% and lowering OPEX—add material dollars. Protecting integrity and indexing tariffs to 2024 CPI (US 3.4%) preserves real cash flows.
O&M services
O&M services generate predictable, high-margin cash flows for Aris Water by servicing existing assets; margins are stable because revenue ties to base volumes rather than new-build cycles. Cash outlay for O&M is low relative to inflows, supporting strong free cash conversion. Industry studies 2022–2024 show digitalization can cut O&M costs 15–25%, so standardize SOPs and automate reporting to harvest the cost curve.
- Recurring revenue focus
- Low capital intensity
- Standardize SOPs
- Automate reporting
- Target 15–25% O&M cost reduction (2022–24 studies)
Water balancing
Water balancing is a sticky, low-growth daily sourcing, transfer, and scheduling service for core customers that in 2024 continues to monetize established relationships with minimal incremental capex. Margins benefit from network density and route optimization, making it a cash cow within Aris Water’s BCG matrix. Maintain service quality and bundle with higher-value offerings to protect churn and unlock upsell.
- Service: daily sourcing, transfer, scheduling
- Growth: low, stable in 2024
- Capex: minimal incremental
- Margin drivers: network density, optimization
- Strategy: preserve quality, bundle upsells
High-margin SWD pipeline: 2024 cash flow with ~80% contract cover and 50-70% EBITDA
Established SWD and pipeline assets produce steady high-margin cash flow in 2024 (pipeline EBITDA 50–70%, contracts cover ~80% volumes, churn <5%).
Low 2024 capex (maintenance-focused), support costs ~8–10% revenue, uptime target 99.5%+, CPI indexing ~3.4% preserves real tariffs.
O&M digitalization can cut costs 15–25%, improving free cash conversion; water balancing and daily services remain low-growth, sticky cash cows.
| Metric | 2024 Value |
|---|---|
| Contract coverage | ~80% |
| Pipeline EBITDA | 50–70% |
| Support costs | 8–10% |
| CPI (US) | 3.4% |
| O&M savings (est.) | 15–25% |
What You’re Viewing Is Included
Aris Water BCG Matrix
The Aris Water BCG Matrix you’re previewing is the exact file you’ll receive after purchase. No watermarks, no demo text—just the finished, fully formatted strategic report. It’s built for immediate editing, printing, or presenting to stakeholders. After purchase the same document is delivered straight to your inbox—no surprises, no extra work. Ready to plug into your planning or client decks right away.











