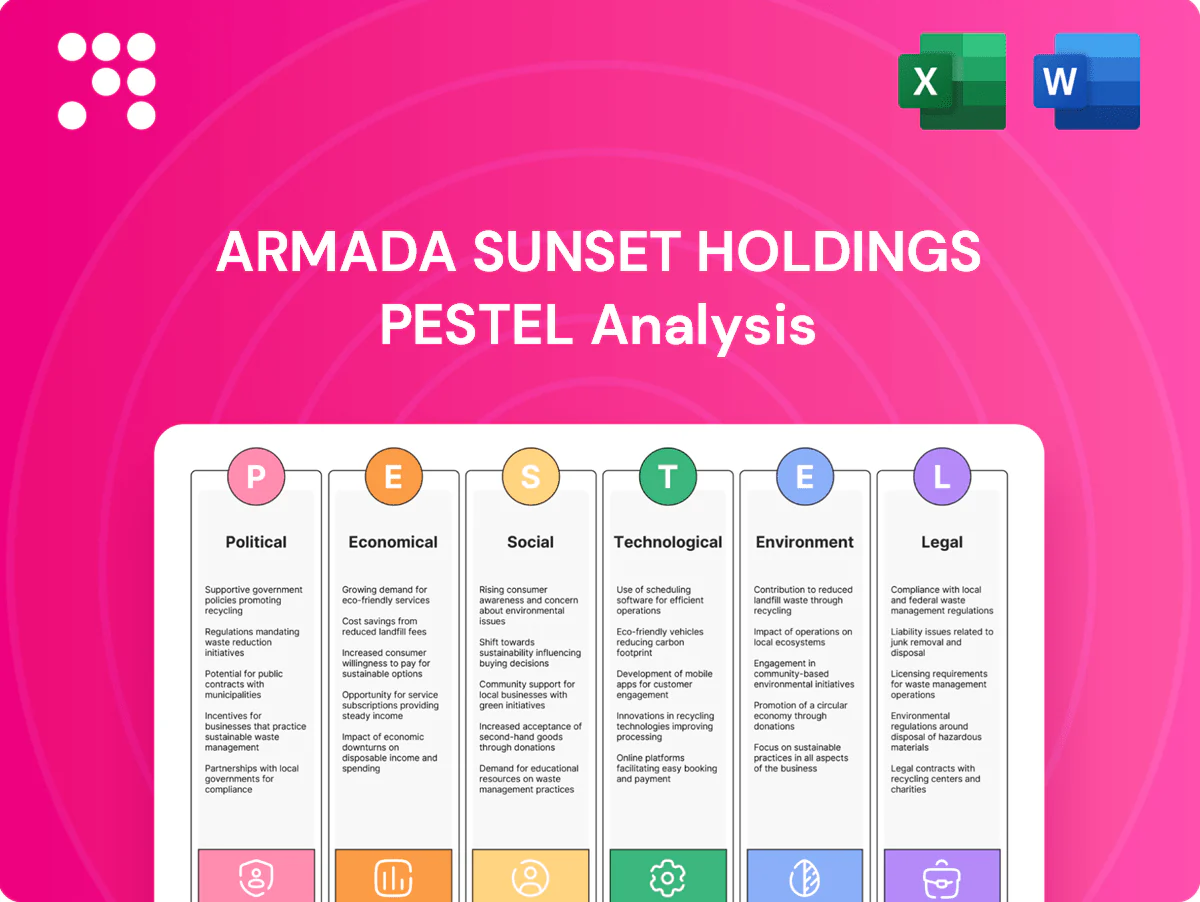
Armada Sunset Holdings PESTLE Analysis

Your Competitive Advantage Starts with This Report
Unlock competitive advantage with our PESTLE Analysis of Armada Sunset Holdings—three to five concise insights reveal how political shifts, economic trends, and technology adoption will reshape strategy. This ready-to-use briefing highlights regulatory risks and market opportunities to inform decisions. Purchase the full analysis for the complete, editable report and actionable recommendations.
Political factors

Trade policy volatility
Shifts in tariffs, quotas and sanctions—e.g., US Section 301 duties covering roughly $360 billion of Chinese imports—can reroute flows and spike landed costs overnight, so Armada Sunset Holdings must keep multi-route playbooks and dynamic sourcing to hedge policy risk. Close monitoring of USTR actions, WTO rulings and regional trade pacts is required, with scenario planning embedded in orchestration tools.
Customs and border modernization
Adoption of electronic customs, national single-window systems and advance data filings—implemented in over 100 economies by 2024—increases clearance speed, with World Bank studies showing up to 40% reductions in processing times. Compliance-ready data models and automation cut dwell times and penalties, lowering average port dwell by notable margins in pilot programs. Strategic partnerships with brokers and pre-clearance programs improve reliability and predictability of flows. Continuous HS code and origin-rule updates are required to avoid reclassification risks.

Infrastructure and public investment
Port dredging timelines and federal grants materially affect capacity and transit times: the 2021 Bipartisan Infrastructure Law committed about 110 billion dollars to roads/bridges and 66 billion dollars to rail, shifting modal economics and chokepoints. Policy-driven port or canal expansions can redraw optimal networks, so Armada must align capacity commitments with announced dredging and rail grant schedules. Active advocacy and public–private collaboration can secure priority access and timing.

Geopolitical disruptions
Geopolitical disruptions — conflicts, coups and maritime security incidents — have concentrated risk in key corridors like the Red Sea, where Lloyds List reported war-risk premiums rose up to 300% in 2023–24, sharply raising insurance costs and disrupting schedules. Rerouting around high-risk zones has lengthened voyages and eroded margins as carriers absorb or pass through higher bunker and time costs. Armada Sunset should integrate advisories and AIS feeds into risk dashboards for rapid response and keep contract flexibility with carriers to mitigate exposure.
- Impact: premiums +up to 300% (Red Sea, 2023–24)
- Operational: longer voyages, higher bunker/time costs
- Controls: AIS + advisory-fed risk dashboards
- Mitigation: flexible carrier contracts
Industrial policy and incentives
Reshoring and nearshoring incentives are shifting manufacturing footprints: the US CHIPS and Science Act directs roughly 52 billion USD to domestic semiconductor incentives and the Inflation Reduction Act allocates about 369 billion USD for clean energy, while USMCA auto rules mandate 75% regional content, driving new lane formation; Armada can design Mexico/LatAm and SE Asia alternatives and pursue government grants to co-fund tech and workforce upskilling.
- Reshoring: CHIPS 52B USD
- Clean energy: IRA 369B USD
- USMCA: 75% regional content
- Armada: Mexico/LatAm + SE Asia play; pursue grants for tech/upskilling
Tariffs, digital customs and reshoring reshape supply chains as Red Sea risk +300%
Tariff shifts such as US Section 301 on ~360 billion USD of Chinese goods can spike landed costs and force multi-route sourcing. Electronic customs in 100+ economies cut clearance up to 40%, reducing dwell and fines. Infrastructure funding (BIL: 110B roads, 66B rail) and reshoring incentives (CHIPS 52B, IRA 369B) reshape lanes. War-risk premiums rose ~300% in Red Sea 2023–24, raising insurance and rerouting costs.
| Metric | Value |
|---|---|
| Section 301 scope | ~360B USD |
| Customs speed gain | up to 40% |
| BIL (roads) | 110B USD |
| Rail | 66B USD |
| CHIPS | 52B USD |
| IRA | 369B USD |
| Red Sea premium | ~300% |
What is included in the product
 Detailed Word Document
Explores how external macro-environmental factors uniquely affect Armada Sunset Holdings across Political, Economic, Social, Technological, Environmental, and Legal dimensions, with each section grounded in current data and trends. Designed for executives and investors, it highlights threats, opportunities and forward-looking insights ready for inclusion in business plans, pitch decks, or scenario planning.

 Customizable Excel Spreadsheet
A concise, visually segmented PESTLE summary for Armada Sunset Holdings that can be dropped into presentations, shared across teams, and annotated for local context—enabling quick alignment on external risks and strategic positioning during planning sessions.
Economic factors

Freight rate cycles
Container and truckload rates remain highly cyclical—Drewry notes container WCI dropped roughly 80% from the 2021 peak to 2023 lows and US DAT spot van rates eased ~15% y/y in 2023—pressuring client budgets and margins. Index-linked contracts and mini-bids smooth volatility, Armada’s market intelligence should steer mode mix and tender timing, and dynamic pricing in the TMS can capture measurable savings.
Fuel and energy costs
Diesel, marine bunker (VLSFO ~ $600/ton average in 2024) and commercial electricity (~$0.17/kWh US average in 2024) cascade into customer surcharges, which accounted for roughly 10–15% of freight invoices in 2024. Energy hedging and efficiency programs—hedges often covering up to 70% of consumption for large operators—protect EBITDA against price swings. Mode shifting and load consolidation cut fuel exposure and emissions intensity. Transparent client fuel mechanisms strengthen trust and support renewals.

Inflation and interest rates
High inflation (US CPI ~3.4% in 2024) lifts labor, equipment and facility costs while policy rates near 5.25–5.5% raise borrowing and working capital costs, squeezing CapEx. Automated inventory optimization can cut carrying costs 20–30%, easing cash strain. Lease-versus-buy for fleets and warehouses must reflect higher financing and cap rates. S&OP should embed macro scenarios for inflation and rate paths.

Currency fluctuations
Currency fluctuations reshape comparative sourcing and transport costs across Armada’s network; USD strength linked to global rate differentials (US federal funds ~5.25–5.50% in 2024) increases import costs for non-dollar purchases. Multi-currency billing and natural hedges have historically steadied margins, but planning must stress-test exchange-rate shocks on flows and enforce tight hedge-accounting controls.
- FX impact on sourcing
- Multi-currency billing stabilizes margins
- Stress-test exchange shocks
- Tight hedge-accounting controls
Labor market dynamics
- Driver availability: constrained, raises logistics risk
- Wages: $17–20/hr impact margins
- Skill premium: ~15% raises staffing cost
- Turnover: 40–60% — training lowers cost
- Automation +15% installs — safety, capacity
Tariffs, digital customs and reshoring reshape supply chains as Red Sea risk +300%
Freight rate cyclicality (WCI -80% from 2021 peak to 2023 low; US DAT van -15% y/y 2023) and energy costs (VLSFO ~ $600/ton 2024; US electricity ~$0.17/kWh 2024) compress margins; index-linked contracts, hedging and mode-shift reduce volatility. Inflation (US CPI ~3.4% 2024) and policy rates ~5.25–5.50% raise labor ($17–20/hr) and financing costs; automation and inventory optimization cut operating expense and capex pressure.
| Metric | 2023–24 |
|---|---|
| WCI change | -80% vs 2021 |
| DAT spot van | -15% y/y 2023 |
| VLSFO | $600/ton (2024) |
| US electricity | $0.17/kWh (2024) |
| US CPI | 3.4% (2024) |
| Policy rate | 5.25–5.50% (2024) |
| Warehouse wage | $17–20/hr |
Same Document Delivered
Armada Sunset Holdings PESTLE Analysis
The preview shown here is the exact Armada Sunset Holdings PESTLE Analysis you’ll receive after purchase—fully formatted and ready to use. It presents the same structure, content, and professional layout as the downloadable file. No placeholders or teasers—this is the final, ready-to-use document.

Your Competitive Advantage Starts with This Report
Unlock competitive advantage with our PESTLE Analysis of Armada Sunset Holdings—three to five concise insights reveal how political shifts, economic trends, and technology adoption will reshape strategy. This ready-to-use briefing highlights regulatory risks and market opportunities to inform decisions. Purchase the full analysis for the complete, editable report and actionable recommendations.
Political factors
Trade policy volatility
Shifts in tariffs, quotas and sanctions—e.g., US Section 301 duties covering roughly $360 billion of Chinese imports—can reroute flows and spike landed costs overnight, so Armada Sunset Holdings must keep multi-route playbooks and dynamic sourcing to hedge policy risk. Close monitoring of USTR actions, WTO rulings and regional trade pacts is required, with scenario planning embedded in orchestration tools.
Customs and border modernization
Adoption of electronic customs, national single-window systems and advance data filings—implemented in over 100 economies by 2024—increases clearance speed, with World Bank studies showing up to 40% reductions in processing times. Compliance-ready data models and automation cut dwell times and penalties, lowering average port dwell by notable margins in pilot programs. Strategic partnerships with brokers and pre-clearance programs improve reliability and predictability of flows. Continuous HS code and origin-rule updates are required to avoid reclassification risks.
Infrastructure and public investment
Port dredging timelines and federal grants materially affect capacity and transit times: the 2021 Bipartisan Infrastructure Law committed about 110 billion dollars to roads/bridges and 66 billion dollars to rail, shifting modal economics and chokepoints. Policy-driven port or canal expansions can redraw optimal networks, so Armada must align capacity commitments with announced dredging and rail grant schedules. Active advocacy and public–private collaboration can secure priority access and timing.
Geopolitical disruptions
Geopolitical disruptions — conflicts, coups and maritime security incidents — have concentrated risk in key corridors like the Red Sea, where Lloyds List reported war-risk premiums rose up to 300% in 2023–24, sharply raising insurance costs and disrupting schedules. Rerouting around high-risk zones has lengthened voyages and eroded margins as carriers absorb or pass through higher bunker and time costs. Armada Sunset should integrate advisories and AIS feeds into risk dashboards for rapid response and keep contract flexibility with carriers to mitigate exposure.
- Impact: premiums +up to 300% (Red Sea, 2023–24)
- Operational: longer voyages, higher bunker/time costs
- Controls: AIS + advisory-fed risk dashboards
- Mitigation: flexible carrier contracts
Industrial policy and incentives
Reshoring and nearshoring incentives are shifting manufacturing footprints: the US CHIPS and Science Act directs roughly 52 billion USD to domestic semiconductor incentives and the Inflation Reduction Act allocates about 369 billion USD for clean energy, while USMCA auto rules mandate 75% regional content, driving new lane formation; Armada can design Mexico/LatAm and SE Asia alternatives and pursue government grants to co-fund tech and workforce upskilling.
- Reshoring: CHIPS 52B USD
- Clean energy: IRA 369B USD
- USMCA: 75% regional content
- Armada: Mexico/LatAm + SE Asia play; pursue grants for tech/upskilling
Tariffs, digital customs and reshoring reshape supply chains as Red Sea risk +300%
Tariff shifts such as US Section 301 on ~360 billion USD of Chinese goods can spike landed costs and force multi-route sourcing. Electronic customs in 100+ economies cut clearance up to 40%, reducing dwell and fines. Infrastructure funding (BIL: 110B roads, 66B rail) and reshoring incentives (CHIPS 52B, IRA 369B) reshape lanes. War-risk premiums rose ~300% in Red Sea 2023–24, raising insurance and rerouting costs.
| Metric | Value |
|---|---|
| Section 301 scope | ~360B USD |
| Customs speed gain | up to 40% |
| BIL (roads) | 110B USD |
| Rail | 66B USD |
| CHIPS | 52B USD |
| IRA | 369B USD |
| Red Sea premium | ~300% |
What is included in the product
Detailed Word Document
Explores how external macro-environmental factors uniquely affect Armada Sunset Holdings across Political, Economic, Social, Technological, Environmental, and Legal dimensions, with each section grounded in current data and trends. Designed for executives and investors, it highlights threats, opportunities and forward-looking insights ready for inclusion in business plans, pitch decks, or scenario planning.
Customizable Excel Spreadsheet
A concise, visually segmented PESTLE summary for Armada Sunset Holdings that can be dropped into presentations, shared across teams, and annotated for local context—enabling quick alignment on external risks and strategic positioning during planning sessions.
Economic factors
Freight rate cycles
Container and truckload rates remain highly cyclical—Drewry notes container WCI dropped roughly 80% from the 2021 peak to 2023 lows and US DAT spot van rates eased ~15% y/y in 2023—pressuring client budgets and margins. Index-linked contracts and mini-bids smooth volatility, Armada’s market intelligence should steer mode mix and tender timing, and dynamic pricing in the TMS can capture measurable savings.
Fuel and energy costs
Diesel, marine bunker (VLSFO ~ $600/ton average in 2024) and commercial electricity (~$0.17/kWh US average in 2024) cascade into customer surcharges, which accounted for roughly 10–15% of freight invoices in 2024. Energy hedging and efficiency programs—hedges often covering up to 70% of consumption for large operators—protect EBITDA against price swings. Mode shifting and load consolidation cut fuel exposure and emissions intensity. Transparent client fuel mechanisms strengthen trust and support renewals.
Inflation and interest rates
High inflation (US CPI ~3.4% in 2024) lifts labor, equipment and facility costs while policy rates near 5.25–5.5% raise borrowing and working capital costs, squeezing CapEx. Automated inventory optimization can cut carrying costs 20–30%, easing cash strain. Lease-versus-buy for fleets and warehouses must reflect higher financing and cap rates. S&OP should embed macro scenarios for inflation and rate paths.
Currency fluctuations
Currency fluctuations reshape comparative sourcing and transport costs across Armada’s network; USD strength linked to global rate differentials (US federal funds ~5.25–5.50% in 2024) increases import costs for non-dollar purchases. Multi-currency billing and natural hedges have historically steadied margins, but planning must stress-test exchange-rate shocks on flows and enforce tight hedge-accounting controls.
- FX impact on sourcing
- Multi-currency billing stabilizes margins
- Stress-test exchange shocks
- Tight hedge-accounting controls
Labor market dynamics
- Driver availability: constrained, raises logistics risk
- Wages: $17–20/hr impact margins
- Skill premium: ~15% raises staffing cost
- Turnover: 40–60% — training lowers cost
- Automation +15% installs — safety, capacity
Tariffs, digital customs and reshoring reshape supply chains as Red Sea risk +300%
Freight rate cyclicality (WCI -80% from 2021 peak to 2023 low; US DAT van -15% y/y 2023) and energy costs (VLSFO ~ $600/ton 2024; US electricity ~$0.17/kWh 2024) compress margins; index-linked contracts, hedging and mode-shift reduce volatility. Inflation (US CPI ~3.4% 2024) and policy rates ~5.25–5.50% raise labor ($17–20/hr) and financing costs; automation and inventory optimization cut operating expense and capex pressure.
| Metric | 2023–24 |
|---|---|
| WCI change | -80% vs 2021 |
| DAT spot van | -15% y/y 2023 |
| VLSFO | $600/ton (2024) |
| US electricity | $0.17/kWh (2024) |
| US CPI | 3.4% (2024) |
| Policy rate | 5.25–5.50% (2024) |
| Warehouse wage | $17–20/hr |
Same Document Delivered
Armada Sunset Holdings PESTLE Analysis
The preview shown here is the exact Armada Sunset Holdings PESTLE Analysis you’ll receive after purchase—fully formatted and ready to use. It presents the same structure, content, and professional layout as the downloadable file. No placeholders or teasers—this is the final, ready-to-use document.
Description
Your Competitive Advantage Starts with This Report
Unlock competitive advantage with our PESTLE Analysis of Armada Sunset Holdings—three to five concise insights reveal how political shifts, economic trends, and technology adoption will reshape strategy. This ready-to-use briefing highlights regulatory risks and market opportunities to inform decisions. Purchase the full analysis for the complete, editable report and actionable recommendations.
Political factors
Trade policy volatility
Shifts in tariffs, quotas and sanctions—e.g., US Section 301 duties covering roughly $360 billion of Chinese imports—can reroute flows and spike landed costs overnight, so Armada Sunset Holdings must keep multi-route playbooks and dynamic sourcing to hedge policy risk. Close monitoring of USTR actions, WTO rulings and regional trade pacts is required, with scenario planning embedded in orchestration tools.
Customs and border modernization
Adoption of electronic customs, national single-window systems and advance data filings—implemented in over 100 economies by 2024—increases clearance speed, with World Bank studies showing up to 40% reductions in processing times. Compliance-ready data models and automation cut dwell times and penalties, lowering average port dwell by notable margins in pilot programs. Strategic partnerships with brokers and pre-clearance programs improve reliability and predictability of flows. Continuous HS code and origin-rule updates are required to avoid reclassification risks.
Infrastructure and public investment
Port dredging timelines and federal grants materially affect capacity and transit times: the 2021 Bipartisan Infrastructure Law committed about 110 billion dollars to roads/bridges and 66 billion dollars to rail, shifting modal economics and chokepoints. Policy-driven port or canal expansions can redraw optimal networks, so Armada must align capacity commitments with announced dredging and rail grant schedules. Active advocacy and public–private collaboration can secure priority access and timing.
Geopolitical disruptions
Geopolitical disruptions — conflicts, coups and maritime security incidents — have concentrated risk in key corridors like the Red Sea, where Lloyds List reported war-risk premiums rose up to 300% in 2023–24, sharply raising insurance costs and disrupting schedules. Rerouting around high-risk zones has lengthened voyages and eroded margins as carriers absorb or pass through higher bunker and time costs. Armada Sunset should integrate advisories and AIS feeds into risk dashboards for rapid response and keep contract flexibility with carriers to mitigate exposure.
- Impact: premiums +up to 300% (Red Sea, 2023–24)
- Operational: longer voyages, higher bunker/time costs
- Controls: AIS + advisory-fed risk dashboards
- Mitigation: flexible carrier contracts
Industrial policy and incentives
Reshoring and nearshoring incentives are shifting manufacturing footprints: the US CHIPS and Science Act directs roughly 52 billion USD to domestic semiconductor incentives and the Inflation Reduction Act allocates about 369 billion USD for clean energy, while USMCA auto rules mandate 75% regional content, driving new lane formation; Armada can design Mexico/LatAm and SE Asia alternatives and pursue government grants to co-fund tech and workforce upskilling.
- Reshoring: CHIPS 52B USD
- Clean energy: IRA 369B USD
- USMCA: 75% regional content
- Armada: Mexico/LatAm + SE Asia play; pursue grants for tech/upskilling
Tariffs, digital customs and reshoring reshape supply chains as Red Sea risk +300%
Tariff shifts such as US Section 301 on ~360 billion USD of Chinese goods can spike landed costs and force multi-route sourcing. Electronic customs in 100+ economies cut clearance up to 40%, reducing dwell and fines. Infrastructure funding (BIL: 110B roads, 66B rail) and reshoring incentives (CHIPS 52B, IRA 369B) reshape lanes. War-risk premiums rose ~300% in Red Sea 2023–24, raising insurance and rerouting costs.
| Metric | Value |
|---|---|
| Section 301 scope | ~360B USD |
| Customs speed gain | up to 40% |
| BIL (roads) | 110B USD |
| Rail | 66B USD |
| CHIPS | 52B USD |
| IRA | 369B USD |
| Red Sea premium | ~300% |
What is included in the product
Detailed Word Document
Explores how external macro-environmental factors uniquely affect Armada Sunset Holdings across Political, Economic, Social, Technological, Environmental, and Legal dimensions, with each section grounded in current data and trends. Designed for executives and investors, it highlights threats, opportunities and forward-looking insights ready for inclusion in business plans, pitch decks, or scenario planning.
Customizable Excel Spreadsheet
A concise, visually segmented PESTLE summary for Armada Sunset Holdings that can be dropped into presentations, shared across teams, and annotated for local context—enabling quick alignment on external risks and strategic positioning during planning sessions.
Economic factors
Freight rate cycles
Container and truckload rates remain highly cyclical—Drewry notes container WCI dropped roughly 80% from the 2021 peak to 2023 lows and US DAT spot van rates eased ~15% y/y in 2023—pressuring client budgets and margins. Index-linked contracts and mini-bids smooth volatility, Armada’s market intelligence should steer mode mix and tender timing, and dynamic pricing in the TMS can capture measurable savings.
Fuel and energy costs
Diesel, marine bunker (VLSFO ~ $600/ton average in 2024) and commercial electricity (~$0.17/kWh US average in 2024) cascade into customer surcharges, which accounted for roughly 10–15% of freight invoices in 2024. Energy hedging and efficiency programs—hedges often covering up to 70% of consumption for large operators—protect EBITDA against price swings. Mode shifting and load consolidation cut fuel exposure and emissions intensity. Transparent client fuel mechanisms strengthen trust and support renewals.
Inflation and interest rates
High inflation (US CPI ~3.4% in 2024) lifts labor, equipment and facility costs while policy rates near 5.25–5.5% raise borrowing and working capital costs, squeezing CapEx. Automated inventory optimization can cut carrying costs 20–30%, easing cash strain. Lease-versus-buy for fleets and warehouses must reflect higher financing and cap rates. S&OP should embed macro scenarios for inflation and rate paths.
Currency fluctuations
Currency fluctuations reshape comparative sourcing and transport costs across Armada’s network; USD strength linked to global rate differentials (US federal funds ~5.25–5.50% in 2024) increases import costs for non-dollar purchases. Multi-currency billing and natural hedges have historically steadied margins, but planning must stress-test exchange-rate shocks on flows and enforce tight hedge-accounting controls.
- FX impact on sourcing
- Multi-currency billing stabilizes margins
- Stress-test exchange shocks
- Tight hedge-accounting controls
Labor market dynamics
- Driver availability: constrained, raises logistics risk
- Wages: $17–20/hr impact margins
- Skill premium: ~15% raises staffing cost
- Turnover: 40–60% — training lowers cost
- Automation +15% installs — safety, capacity
Tariffs, digital customs and reshoring reshape supply chains as Red Sea risk +300%
Freight rate cyclicality (WCI -80% from 2021 peak to 2023 low; US DAT van -15% y/y 2023) and energy costs (VLSFO ~ $600/ton 2024; US electricity ~$0.17/kWh 2024) compress margins; index-linked contracts, hedging and mode-shift reduce volatility. Inflation (US CPI ~3.4% 2024) and policy rates ~5.25–5.50% raise labor ($17–20/hr) and financing costs; automation and inventory optimization cut operating expense and capex pressure.
| Metric | 2023–24 |
|---|---|
| WCI change | -80% vs 2021 |
| DAT spot van | -15% y/y 2023 |
| VLSFO | $600/ton (2024) |
| US electricity | $0.17/kWh (2024) |
| US CPI | 3.4% (2024) |
| Policy rate | 5.25–5.50% (2024) |
| Warehouse wage | $17–20/hr |
Same Document Delivered
Armada Sunset Holdings PESTLE Analysis
The preview shown here is the exact Armada Sunset Holdings PESTLE Analysis you’ll receive after purchase—fully formatted and ready to use. It presents the same structure, content, and professional layout as the downloadable file. No placeholders or teasers—this is the final, ready-to-use document.











