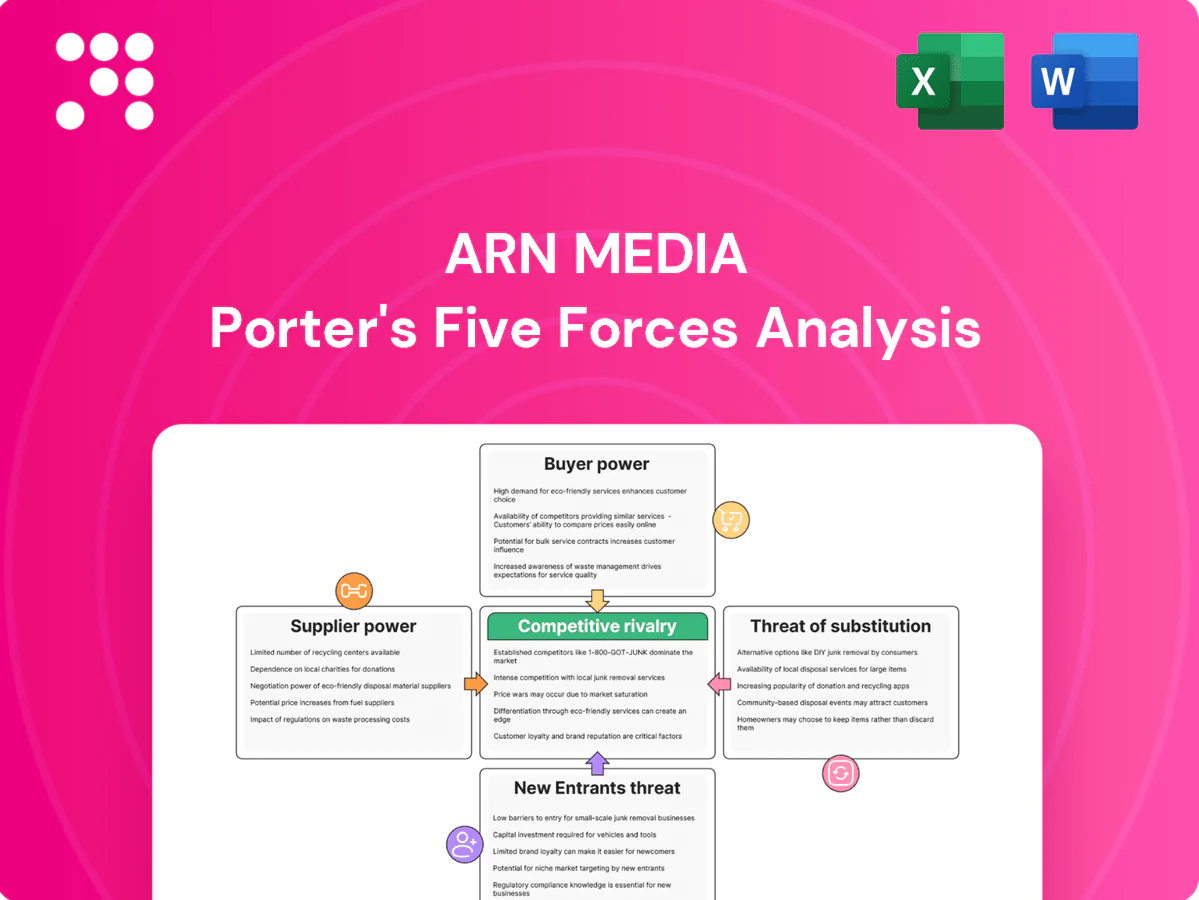
ARN Media Porter's Five Forces Analysis

A Must-Have Tool for Decision-Makers
ARN Media faces shifting competitive pressures from digital rivals, advertiser bargaining power, and evolving content substitutes — this snapshot highlights key tensions but leaves strategic detail unexplored. Unlock the full Porter's Five Forces Analysis to access force-by-force ratings, visuals, and actionable recommendations to guide investment or strategic moves.
Suppliers Bargaining Power

Star talent and creators hold leverage
High-profile radio hosts and podcast creators command premium fees and favorable terms as their followings are portable across networks and platforms, raising ARN’s switching costs. Talent scarcity in prime drive and breakfast slots heightens negotiating power, often resulting in multi-year contracts (commonly 2–4 years) that mitigate churn but lock in higher fixed costs. Long-term deals increase leverage for star talent when renewal time arrives.
Music licensing is concentrated
Rights in commercial music are concentrated: the Big Three labels (Universal, Sony, Warner) account for over 70% of the recorded-music market (IFPI 2023), and Australian broadcasters deal primarily with APRA AMCOS and PPCA, limiting ARN’s negotiating flexibility. Mandatory licenses and statutory rate structures under Australian copyright law create non-discretionary costs that must be paid regardless of performance. Changes in royalty rates therefore flow directly to operating margins, and while ARN’s scale and national reach provide some bargaining offset, scale does not fully neutralize concentrated supplier power.

Transmission and tech stack dependencies
Transmission and tech stack dependencies: Tower access, spectrum, and broadcast equipment suppliers are limited and regulated; the top three U.S. tower companies controlled roughly 70% of towers in 2024. Digital audio depends on hosting, CDN and ad-tech partners whose programmatic fees commonly consume 20–30% of ad spend and can restrict data access. Outages or policy shifts can halt monetization rapidly. Multi-vendor strategies cut reliance but add complexity.

Measurement and data providers influence pricing
Ratings and attribution vendors shape perceived inventory value, and in 2024 third-party metrics influenced over 50% of programmatic buy decisions, shifting CPMs and share of ad spend when methodologies change. ARN’s reliance on these vendors weakens control over proof-of-performance and pricing leverage. Building first-party data and direct measurement rebalances supplier power.
- 2024: >50% programmatic influence; first-party data reduces attribution risk
News and content syndication partners matter
External news services and syndicated shows plug key schedule gaps for ARN, with syndicated programming estimated to account for about 18% of commercial radio hours in 2024; unique providers can push tougher terms where alternatives are limited, and contract renewals have driven industry supplier cost increases of roughly 10–12% year-on-year. Growing in-house production has begun reducing exposure and content risk.
- Supplier dependency: high for niche/syndicated shows
- Negotiation leverage: unique providers exert pricing power
- Renewal risk: potential 10–12% cost spikes (2024 industry benchmark)
- Mitigation: in-house production rising, lowering dependence
High talent costs, >70% music share and 20–30% ad tech fees
High-profile talent and podcast hosts push fees and multi-year (2–4y) contracts, raising ARN’s switching costs. Music-rights concentrated: Big Three >70% (IFPI 2023); APRA AMCOS/PPCA licences create non-discretionary royalties that flow to margins. Tech and programmatic partners take 20–30% of ad spend; third-party metrics influenced >50% of programmatic buys in 2024.
| Metric | 2023–24 |
|---|---|
| Talent contract length | 2–4 years |
| Big Three market share | >70% (IFPI 2023) |
| Programmatic fees | 20–30% of ad spend |
| Programmatic buy influence | >50% (2024) |
| Syndicated hours | ~18% (2024) |
| Renewal cost spike | ~10–12% (2024) |
What is included in the product
 Detailed Word Document
Concise Porter’s Five Forces assessment tailored for ARN Media, uncovering competitive intensity, buyer/supplier leverage, threat of substitutes, and entry barriers with strategic implications; identifies emerging digital disruptors and monetization pressures on advertising revenues.

 Customizable Excel Spreadsheet
A concise, one-sheet Porter’s Five Forces for ARN Media that turns complex competitive dynamics into immediate insight—customizable pressure levels and an instant spider chart make it easy to adapt to market shifts and drop into decks or dashboards.
Customers Bargaining Power

Agency-dominated ad spend
Media agencies aggregate demand and negotiate aggressively on price and packages, leveraging scale as global ad spend approached roughly US$780bn in 2024 to secure volume discounts and bundled buys. They reallocate budgets rapidly across audio, digital and other channels, pressuring rate flexibility. Preferred supplier lists and trading deals limit direct access, while deep client relationships and demonstrable ROI (measured via attribution and lift studies) help ARN defend premium rates.
Many alternatives for advertisers
Buyers can easily substitute ARN with TV, BVOD, social, search and OOH, as digital ad spend now accounts for over 60% of global ad expenditure in 2024 and Google plus Meta capture roughly half of that market, enabling granular targeting and real-time optimization. This cross-channel optionality heightens price sensitivity and increases short-term budget churn. Bundled radio-plus-digital audio solutions can reduce churn by improving retention and upselling opportunities.

Programmatic buying pressures margins
Programmatic audio increases auction transparency and shifts pricing dynamics, with programmatic share of digital audio rising to roughly 50% in 2024; platform take rates of about 10–20% have compressed net yield for sellers. Buyers leverage frequency capping and precise audience targeting to drive down effective CPMs, while private marketplaces and guaranteed programmatic deals commonly stabilize or lift CPMs by ~20–40% versus open-auction rates.

Performance and brand safety demands
Advertisers in 2024 demanded measurable outcomes, viewability proxies and brand-safe placements, with underperformance prompting reallocation of budgets within weeks; first-party data and attribution partnerships became decisive in renewal decisions, while premium talent-led environments justified CPM premiums of 20%–40% versus standard inventory.
- Measurable outcomes
- Viewability & safety
- First-party data wins
- CPM premium 20%–40%
Cyclical and seasonal budget volatility
Macro conditions and retail calendars drive ARN Media client spend, with budgets swinging an estimated 15–25% between peak shopping periods and off-peak months in 2024; during downturns buyers pressed harder on CPMs and cancellation terms, often seeking discounts north of 10%. Flexible packaging and diversified verticals cushioned revenue, while long-term sponsorships (multi-quarter deals) smoothed cashflow variability.
- Budget swings: 15–25%
- Discount pressure in downturns: ~10%+
- Mitigants: packaging, vertical mix, multi-quarter sponsorships
Agencies' scale drives buyer leverage as global ad spend hits US$780bn
Media agencies' scale and trading deals give clients strong price negotiation as global ad spend ~US$780bn in 2024.
Digital substitution (60% of ad spend; Google+Meta ~50%) raises churn and price sensitivity, compressing CPMs.
Programmatic audio (~50% share) and demand for measurable ROI drive buyers' leverage; CPM premiums 20–40% for premium inventory.
| Metric | 2024 | Note |
|---|---|---|
| Global ad spend | US$780bn | Source: 2024 |
| Digital share | ~60% | Includes search/social |
| Programmatic audio | ~50% | Share of digital audio |
Same Document Delivered
ARN Media Porter's Five Forces Analysis
This preview shows the exact ARN Media Porter's Five Forces analysis you'll receive after purchase—no placeholders or mockups. The professionally formatted document is complete, ready for immediate download and use, and contains the full strategic assessment included in the final deliverable.

A Must-Have Tool for Decision-Makers
ARN Media faces shifting competitive pressures from digital rivals, advertiser bargaining power, and evolving content substitutes — this snapshot highlights key tensions but leaves strategic detail unexplored. Unlock the full Porter's Five Forces Analysis to access force-by-force ratings, visuals, and actionable recommendations to guide investment or strategic moves.
Suppliers Bargaining Power
Star talent and creators hold leverage
High-profile radio hosts and podcast creators command premium fees and favorable terms as their followings are portable across networks and platforms, raising ARN’s switching costs. Talent scarcity in prime drive and breakfast slots heightens negotiating power, often resulting in multi-year contracts (commonly 2–4 years) that mitigate churn but lock in higher fixed costs. Long-term deals increase leverage for star talent when renewal time arrives.
Music licensing is concentrated
Rights in commercial music are concentrated: the Big Three labels (Universal, Sony, Warner) account for over 70% of the recorded-music market (IFPI 2023), and Australian broadcasters deal primarily with APRA AMCOS and PPCA, limiting ARN’s negotiating flexibility. Mandatory licenses and statutory rate structures under Australian copyright law create non-discretionary costs that must be paid regardless of performance. Changes in royalty rates therefore flow directly to operating margins, and while ARN’s scale and national reach provide some bargaining offset, scale does not fully neutralize concentrated supplier power.
Transmission and tech stack dependencies
Transmission and tech stack dependencies: Tower access, spectrum, and broadcast equipment suppliers are limited and regulated; the top three U.S. tower companies controlled roughly 70% of towers in 2024. Digital audio depends on hosting, CDN and ad-tech partners whose programmatic fees commonly consume 20–30% of ad spend and can restrict data access. Outages or policy shifts can halt monetization rapidly. Multi-vendor strategies cut reliance but add complexity.
Measurement and data providers influence pricing
Ratings and attribution vendors shape perceived inventory value, and in 2024 third-party metrics influenced over 50% of programmatic buy decisions, shifting CPMs and share of ad spend when methodologies change. ARN’s reliance on these vendors weakens control over proof-of-performance and pricing leverage. Building first-party data and direct measurement rebalances supplier power.
- 2024: >50% programmatic influence; first-party data reduces attribution risk
News and content syndication partners matter
External news services and syndicated shows plug key schedule gaps for ARN, with syndicated programming estimated to account for about 18% of commercial radio hours in 2024; unique providers can push tougher terms where alternatives are limited, and contract renewals have driven industry supplier cost increases of roughly 10–12% year-on-year. Growing in-house production has begun reducing exposure and content risk.
- Supplier dependency: high for niche/syndicated shows
- Negotiation leverage: unique providers exert pricing power
- Renewal risk: potential 10–12% cost spikes (2024 industry benchmark)
- Mitigation: in-house production rising, lowering dependence
High talent costs, >70% music share and 20–30% ad tech fees
High-profile talent and podcast hosts push fees and multi-year (2–4y) contracts, raising ARN’s switching costs. Music-rights concentrated: Big Three >70% (IFPI 2023); APRA AMCOS/PPCA licences create non-discretionary royalties that flow to margins. Tech and programmatic partners take 20–30% of ad spend; third-party metrics influenced >50% of programmatic buys in 2024.
| Metric | 2023–24 |
|---|---|
| Talent contract length | 2–4 years |
| Big Three market share | >70% (IFPI 2023) |
| Programmatic fees | 20–30% of ad spend |
| Programmatic buy influence | >50% (2024) |
| Syndicated hours | ~18% (2024) |
| Renewal cost spike | ~10–12% (2024) |
What is included in the product
Detailed Word Document
Concise Porter’s Five Forces assessment tailored for ARN Media, uncovering competitive intensity, buyer/supplier leverage, threat of substitutes, and entry barriers with strategic implications; identifies emerging digital disruptors and monetization pressures on advertising revenues.
Customizable Excel Spreadsheet
A concise, one-sheet Porter’s Five Forces for ARN Media that turns complex competitive dynamics into immediate insight—customizable pressure levels and an instant spider chart make it easy to adapt to market shifts and drop into decks or dashboards.
Customers Bargaining Power
Agency-dominated ad spend
Media agencies aggregate demand and negotiate aggressively on price and packages, leveraging scale as global ad spend approached roughly US$780bn in 2024 to secure volume discounts and bundled buys. They reallocate budgets rapidly across audio, digital and other channels, pressuring rate flexibility. Preferred supplier lists and trading deals limit direct access, while deep client relationships and demonstrable ROI (measured via attribution and lift studies) help ARN defend premium rates.
Many alternatives for advertisers
Buyers can easily substitute ARN with TV, BVOD, social, search and OOH, as digital ad spend now accounts for over 60% of global ad expenditure in 2024 and Google plus Meta capture roughly half of that market, enabling granular targeting and real-time optimization. This cross-channel optionality heightens price sensitivity and increases short-term budget churn. Bundled radio-plus-digital audio solutions can reduce churn by improving retention and upselling opportunities.
Programmatic buying pressures margins
Programmatic audio increases auction transparency and shifts pricing dynamics, with programmatic share of digital audio rising to roughly 50% in 2024; platform take rates of about 10–20% have compressed net yield for sellers. Buyers leverage frequency capping and precise audience targeting to drive down effective CPMs, while private marketplaces and guaranteed programmatic deals commonly stabilize or lift CPMs by ~20–40% versus open-auction rates.
Performance and brand safety demands
Advertisers in 2024 demanded measurable outcomes, viewability proxies and brand-safe placements, with underperformance prompting reallocation of budgets within weeks; first-party data and attribution partnerships became decisive in renewal decisions, while premium talent-led environments justified CPM premiums of 20%–40% versus standard inventory.
- Measurable outcomes
- Viewability & safety
- First-party data wins
- CPM premium 20%–40%
Cyclical and seasonal budget volatility
Macro conditions and retail calendars drive ARN Media client spend, with budgets swinging an estimated 15–25% between peak shopping periods and off-peak months in 2024; during downturns buyers pressed harder on CPMs and cancellation terms, often seeking discounts north of 10%. Flexible packaging and diversified verticals cushioned revenue, while long-term sponsorships (multi-quarter deals) smoothed cashflow variability.
- Budget swings: 15–25%
- Discount pressure in downturns: ~10%+
- Mitigants: packaging, vertical mix, multi-quarter sponsorships
Agencies' scale drives buyer leverage as global ad spend hits US$780bn
Media agencies' scale and trading deals give clients strong price negotiation as global ad spend ~US$780bn in 2024.
Digital substitution (60% of ad spend; Google+Meta ~50%) raises churn and price sensitivity, compressing CPMs.
Programmatic audio (~50% share) and demand for measurable ROI drive buyers' leverage; CPM premiums 20–40% for premium inventory.
| Metric | 2024 | Note |
|---|---|---|
| Global ad spend | US$780bn | Source: 2024 |
| Digital share | ~60% | Includes search/social |
| Programmatic audio | ~50% | Share of digital audio |
Same Document Delivered
ARN Media Porter's Five Forces Analysis
This preview shows the exact ARN Media Porter's Five Forces analysis you'll receive after purchase—no placeholders or mockups. The professionally formatted document is complete, ready for immediate download and use, and contains the full strategic assessment included in the final deliverable.
Description
A Must-Have Tool for Decision-Makers
ARN Media faces shifting competitive pressures from digital rivals, advertiser bargaining power, and evolving content substitutes — this snapshot highlights key tensions but leaves strategic detail unexplored. Unlock the full Porter's Five Forces Analysis to access force-by-force ratings, visuals, and actionable recommendations to guide investment or strategic moves.
Suppliers Bargaining Power
Star talent and creators hold leverage
High-profile radio hosts and podcast creators command premium fees and favorable terms as their followings are portable across networks and platforms, raising ARN’s switching costs. Talent scarcity in prime drive and breakfast slots heightens negotiating power, often resulting in multi-year contracts (commonly 2–4 years) that mitigate churn but lock in higher fixed costs. Long-term deals increase leverage for star talent when renewal time arrives.
Music licensing is concentrated
Rights in commercial music are concentrated: the Big Three labels (Universal, Sony, Warner) account for over 70% of the recorded-music market (IFPI 2023), and Australian broadcasters deal primarily with APRA AMCOS and PPCA, limiting ARN’s negotiating flexibility. Mandatory licenses and statutory rate structures under Australian copyright law create non-discretionary costs that must be paid regardless of performance. Changes in royalty rates therefore flow directly to operating margins, and while ARN’s scale and national reach provide some bargaining offset, scale does not fully neutralize concentrated supplier power.
Transmission and tech stack dependencies
Transmission and tech stack dependencies: Tower access, spectrum, and broadcast equipment suppliers are limited and regulated; the top three U.S. tower companies controlled roughly 70% of towers in 2024. Digital audio depends on hosting, CDN and ad-tech partners whose programmatic fees commonly consume 20–30% of ad spend and can restrict data access. Outages or policy shifts can halt monetization rapidly. Multi-vendor strategies cut reliance but add complexity.
Measurement and data providers influence pricing
Ratings and attribution vendors shape perceived inventory value, and in 2024 third-party metrics influenced over 50% of programmatic buy decisions, shifting CPMs and share of ad spend when methodologies change. ARN’s reliance on these vendors weakens control over proof-of-performance and pricing leverage. Building first-party data and direct measurement rebalances supplier power.
- 2024: >50% programmatic influence; first-party data reduces attribution risk
News and content syndication partners matter
External news services and syndicated shows plug key schedule gaps for ARN, with syndicated programming estimated to account for about 18% of commercial radio hours in 2024; unique providers can push tougher terms where alternatives are limited, and contract renewals have driven industry supplier cost increases of roughly 10–12% year-on-year. Growing in-house production has begun reducing exposure and content risk.
- Supplier dependency: high for niche/syndicated shows
- Negotiation leverage: unique providers exert pricing power
- Renewal risk: potential 10–12% cost spikes (2024 industry benchmark)
- Mitigation: in-house production rising, lowering dependence
High talent costs, >70% music share and 20–30% ad tech fees
High-profile talent and podcast hosts push fees and multi-year (2–4y) contracts, raising ARN’s switching costs. Music-rights concentrated: Big Three >70% (IFPI 2023); APRA AMCOS/PPCA licences create non-discretionary royalties that flow to margins. Tech and programmatic partners take 20–30% of ad spend; third-party metrics influenced >50% of programmatic buys in 2024.
| Metric | 2023–24 |
|---|---|
| Talent contract length | 2–4 years |
| Big Three market share | >70% (IFPI 2023) |
| Programmatic fees | 20–30% of ad spend |
| Programmatic buy influence | >50% (2024) |
| Syndicated hours | ~18% (2024) |
| Renewal cost spike | ~10–12% (2024) |
What is included in the product
Detailed Word Document
Concise Porter’s Five Forces assessment tailored for ARN Media, uncovering competitive intensity, buyer/supplier leverage, threat of substitutes, and entry barriers with strategic implications; identifies emerging digital disruptors and monetization pressures on advertising revenues.
Customizable Excel Spreadsheet
A concise, one-sheet Porter’s Five Forces for ARN Media that turns complex competitive dynamics into immediate insight—customizable pressure levels and an instant spider chart make it easy to adapt to market shifts and drop into decks or dashboards.
Customers Bargaining Power
Agency-dominated ad spend
Media agencies aggregate demand and negotiate aggressively on price and packages, leveraging scale as global ad spend approached roughly US$780bn in 2024 to secure volume discounts and bundled buys. They reallocate budgets rapidly across audio, digital and other channels, pressuring rate flexibility. Preferred supplier lists and trading deals limit direct access, while deep client relationships and demonstrable ROI (measured via attribution and lift studies) help ARN defend premium rates.
Many alternatives for advertisers
Buyers can easily substitute ARN with TV, BVOD, social, search and OOH, as digital ad spend now accounts for over 60% of global ad expenditure in 2024 and Google plus Meta capture roughly half of that market, enabling granular targeting and real-time optimization. This cross-channel optionality heightens price sensitivity and increases short-term budget churn. Bundled radio-plus-digital audio solutions can reduce churn by improving retention and upselling opportunities.
Programmatic buying pressures margins
Programmatic audio increases auction transparency and shifts pricing dynamics, with programmatic share of digital audio rising to roughly 50% in 2024; platform take rates of about 10–20% have compressed net yield for sellers. Buyers leverage frequency capping and precise audience targeting to drive down effective CPMs, while private marketplaces and guaranteed programmatic deals commonly stabilize or lift CPMs by ~20–40% versus open-auction rates.
Performance and brand safety demands
Advertisers in 2024 demanded measurable outcomes, viewability proxies and brand-safe placements, with underperformance prompting reallocation of budgets within weeks; first-party data and attribution partnerships became decisive in renewal decisions, while premium talent-led environments justified CPM premiums of 20%–40% versus standard inventory.
- Measurable outcomes
- Viewability & safety
- First-party data wins
- CPM premium 20%–40%
Cyclical and seasonal budget volatility
Macro conditions and retail calendars drive ARN Media client spend, with budgets swinging an estimated 15–25% between peak shopping periods and off-peak months in 2024; during downturns buyers pressed harder on CPMs and cancellation terms, often seeking discounts north of 10%. Flexible packaging and diversified verticals cushioned revenue, while long-term sponsorships (multi-quarter deals) smoothed cashflow variability.
- Budget swings: 15–25%
- Discount pressure in downturns: ~10%+
- Mitigants: packaging, vertical mix, multi-quarter sponsorships
Agencies' scale drives buyer leverage as global ad spend hits US$780bn
Media agencies' scale and trading deals give clients strong price negotiation as global ad spend ~US$780bn in 2024.
Digital substitution (60% of ad spend; Google+Meta ~50%) raises churn and price sensitivity, compressing CPMs.
Programmatic audio (~50% share) and demand for measurable ROI drive buyers' leverage; CPM premiums 20–40% for premium inventory.
| Metric | 2024 | Note |
|---|---|---|
| Global ad spend | US$780bn | Source: 2024 |
| Digital share | ~60% | Includes search/social |
| Programmatic audio | ~50% | Share of digital audio |
Same Document Delivered
ARN Media Porter's Five Forces Analysis
This preview shows the exact ARN Media Porter's Five Forces analysis you'll receive after purchase—no placeholders or mockups. The professionally formatted document is complete, ready for immediate download and use, and contains the full strategic assessment included in the final deliverable.











