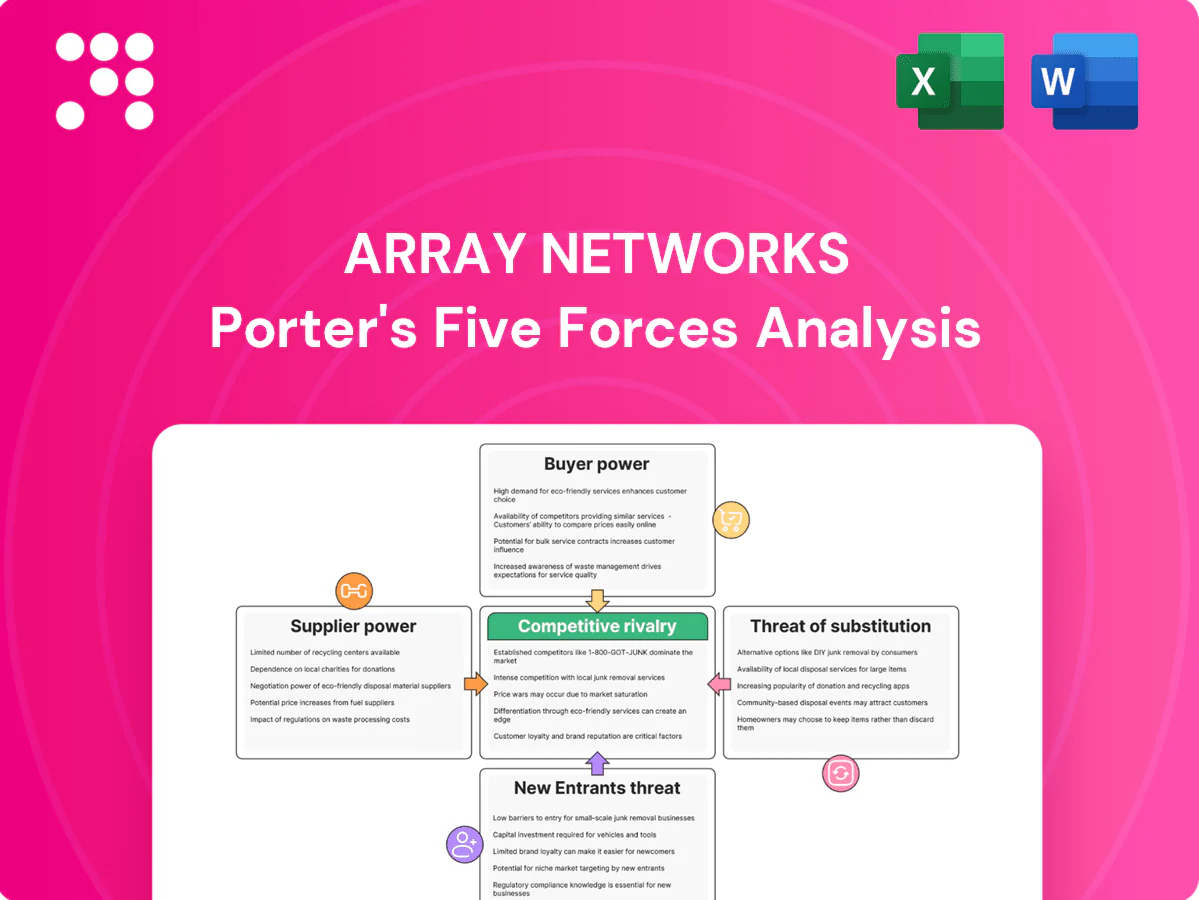
Array Networks Porter's Five Forces Analysis

Don't Miss the Bigger Picture
Array Networks faces moderate rivalry, rising substitution risk from cloud-native networking, and concentrated supplier dynamics that shape margins and growth prospects. This brief snapshot only scratches the surface. Unlock the full Porter's Five Forces Analysis to explore Array Networks’s competitive dynamics, market pressures, and strategic advantages in detail.
Suppliers Bargaining Power

Chipset and NIC concentration
Array depends on a narrow set of high-performance CPU, ASIC and NIC suppliers—notably Intel, Broadcom and NVIDIA—for SSL/TLS offload and L4–L7 throughput; supply shocks in 2020–22 drove NIC/ASIC lead times up to 26 weeks. Vendors with proprietary acceleration IP exert clear pricing leverage, and while multisourcing and shifting workloads to software reduce exposure, they do not eliminate procurement or performance constraints.
Contract manufacturing dependence
Hardware appliances rely on EMS partners for PCB assembly, testing and logistics; the global EMS market exceeded $600B in 2024, concentrating supplier leverage. Volume swings and lead-time volatility (commonly 8–12 weeks in 2024) boost manufacturers' bargaining power on MOQs and pricing. Quality and yield problems can delay deliveries and increase unit costs, while a diversified EMS footprint lowers supplier concentration risk but raises coordination and oversight complexity.

Cloud marketplace and IaaS platforms
Virtual ADCs and gateways rely on AWS, Azure and GCP marketplaces for distribution and billing, with 2024 public cloud IaaS/PaaS share roughly AWS ~33%, Azure ~22% and GCP ~11%, concentrating seller dependence. Platform fees, shifting policies and technical integrations compress margins and obscure visibility, while preferential placement can materially boost demand capture. Offering direct licensing reduces platform leverage but narrows marketplace reach.

Software stack and security certs
Reliance on third‑party libraries, crypto modules and FIPS/Common Criteria labs creates specialized supplier power; FIPS 140‑3 took effect in 2023 and NIST’s PQC selections were finalized in 2022, making certification timelines and test cycles (often months long) key scheduling levers that can force unplanned engineering for TLS/PQC updates.
- specialized_suppliers
- cert_timeline_leverage
- standards_update_risk
- partnerships_reduce_exposure
Support tools and silicon roadmaps
Support toolchains, FPGA/SmartNIC SDKs and vendor microcode materially affect Array Networks’ time-to-market; the global FPGA/SmartNIC ecosystem (~$7.5B in 2024) is concentrated with vendors (Intel, AMD/Xilinx) controlling >60% supply, so roadmap slips can cause missed performance claims and lost competitiveness. Access to early-silicon programs is a bargaining chip; co-development deals often trade margin for priority access.
- Toolchain stability: affects TTM
- Roadmap slips: harms performance claims
- Early-silicon: bargaining leverage
High supplier concentration, 8-26w lead times; cloud 33/22/11
High supplier concentration (Intel/Broadcom/NVIDIA dominant) gives strong pricing/leverage; 2020–22 shocks showed lead times up to 26 weeks. EMS market >$600B (2024) and 8–12 week lead times raise MOQ/pricing risk. Cloud distribution concentrated (AWS 33%/Azure 22%/GCP 11% in 2024), compressing margins. FPGA/SmartNIC >60% supply concentration and certification timelines (FIPS/PQC) add schedule risk.
| Category | 2024 stat | Impact |
|---|---|---|
| CPUs/ASICs | Concentrated: Intel/Broadcom/NVIDIA | Pricing power, lead-time risk |
| EMS | >$600B market; 8–12wk LT | MOQ/pricing pressure |
| Cloud | AWS33%/Azure22%/GCP11% | Fee/platform leverage |
| FPGA/SmartNIC | ~$7.5B; >60% supply | TTM, co-dev bargaining |
| Certs | FIPS140-3 (2023), PQC (2022) | Scheduling/engineering risk |
What is included in the product
 Detailed Word Document
Concise Porter's Five Forces assessment of Array Networks that uncovers competitive drivers, buyer and supplier power, substitute threats, and entry barriers specific to its networking and security appliance market; includes strategic insights on disruptive technologies and implications for pricing, margins, and market positioning.

 Customizable Excel Spreadsheet
A clear one-sheet Porter's Five Forces for Array Networks that visualizes strategic pressure with a spider chart, lets you customize force levels with current data, and exports cleanly into decks—no macros or finance expertise required.
Customers Bargaining Power

Enterprise RFP leverage
Large enterprises and service providers run competitive RFPs that typically shortlist 3–5 ADC vendors, increasing Array Networks pricing pressure; standardized feature checklists in 2024 drove greater price transparency and average discounts in the ADC sector of roughly 10–20%. Multi-year agreements increasingly hinge on POCs and validated reference architectures, with buyers extracting bundling and extended-support concessions in a majority of large deals.
Multi-vendor strategies
Customers frequently dual-source ADCs and remote access solutions to avoid vendor lock-in, which reduces switching costs and strengthens their negotiation leverage. Interoperability expectations force vendors to support common APIs and configurations to remain competitive. To capture wallet share vendors must demonstrate clearly differentiated ROI and lower TCO through measurable performance, manageability, and lifecycle savings.

Price sensitivity vs performance
Mid-market buyers prioritize performance per dollar and license simplicity, often choosing solutions that maximize throughput for budgeted spend. Per-core and throughput-based pricing frequently prompt downsizing or shifts to virtual editions to avoid hardware premiums. Transparent capacity planning tools strengthen pricing defensibility while flexible subscriptions mitigate budget constraints. Global cybersecurity market reached $188.1B in 2024 (Statista).

Demand for integrated security
Buyers increasingly demand ADCs with integrated WAF, DDoS, bot defense and ZTNA; a 2024 Forrester survey reported about 64% of enterprises favor convergence over best-of-breed, and when Array lags leaders customers split spend or negotiate steep discounts. Security validation, pen-test results and certifications heavily sway procurement, while tight integrations raise switching costs and lock renewals.
- Integrated demand: 64% (Forrester 2024)
- Best-of-breed split spend risk
- Certs/pen-tests drive selection
- Integration increases switching costs
Lifecycle and support expectations
Enterprises require 24/7 SLAs, rapid TAC response (often under 1 hour), and hardware lifecycles of 5–7 years; renewal and uplift negotiations hinge on perceived support quality. Poor incident handling accelerates churn, linked in industry reports to several percentage points higher attrition. Proactive health telemetry and SLO reporting can justify premiums and have been shown in vendor case studies to increase renewal rates by 10–20%.
- 24/7 SLAs + TAC <1h
- Hardware lifecycles 5–7 years
- Telemetry/SLOs → +10–20% renewals
Buyers force 10–20% ADC discounts; 64% prefer integrated security
Buyers wield strong bargaining power: enterprise RFPs shortlist 3–5 vendors, driving 10–20% average ADC discounts in 2024 and frequent dual-sourcing to avoid lock-in. 64% of enterprises favor integrated ADC/security, increasing split-spend risk when Array lags. Support SLAs <1h and 5–7 year hardware lifecycles; telemetry/SLOs lift renewals 10–20%.
| Metric | 2024 Value |
|---|---|
| Avg ADC discount | 10–20% |
| Integrated demand | 64% (Forrester) |
| Cybersecurity market | $188.1B (Statista) |
Preview the Actual Deliverable
Array Networks Porter's Five Forces Analysis
This preview shows the exact Array Networks Porter's Five Forces analysis you'll receive immediately after purchase—no surprises, no placeholders. The document displayed here is the professionally formatted, final version ready for download and use the moment you buy. You're getting the complete, ready-to-use deliverable with full findings and actionable insights.

Don't Miss the Bigger Picture
Array Networks faces moderate rivalry, rising substitution risk from cloud-native networking, and concentrated supplier dynamics that shape margins and growth prospects. This brief snapshot only scratches the surface. Unlock the full Porter's Five Forces Analysis to explore Array Networks’s competitive dynamics, market pressures, and strategic advantages in detail.
Suppliers Bargaining Power
Chipset and NIC concentration
Array depends on a narrow set of high-performance CPU, ASIC and NIC suppliers—notably Intel, Broadcom and NVIDIA—for SSL/TLS offload and L4–L7 throughput; supply shocks in 2020–22 drove NIC/ASIC lead times up to 26 weeks. Vendors with proprietary acceleration IP exert clear pricing leverage, and while multisourcing and shifting workloads to software reduce exposure, they do not eliminate procurement or performance constraints.
Contract manufacturing dependence
Hardware appliances rely on EMS partners for PCB assembly, testing and logistics; the global EMS market exceeded $600B in 2024, concentrating supplier leverage. Volume swings and lead-time volatility (commonly 8–12 weeks in 2024) boost manufacturers' bargaining power on MOQs and pricing. Quality and yield problems can delay deliveries and increase unit costs, while a diversified EMS footprint lowers supplier concentration risk but raises coordination and oversight complexity.
Cloud marketplace and IaaS platforms
Virtual ADCs and gateways rely on AWS, Azure and GCP marketplaces for distribution and billing, with 2024 public cloud IaaS/PaaS share roughly AWS ~33%, Azure ~22% and GCP ~11%, concentrating seller dependence. Platform fees, shifting policies and technical integrations compress margins and obscure visibility, while preferential placement can materially boost demand capture. Offering direct licensing reduces platform leverage but narrows marketplace reach.
Software stack and security certs
Reliance on third‑party libraries, crypto modules and FIPS/Common Criteria labs creates specialized supplier power; FIPS 140‑3 took effect in 2023 and NIST’s PQC selections were finalized in 2022, making certification timelines and test cycles (often months long) key scheduling levers that can force unplanned engineering for TLS/PQC updates.
- specialized_suppliers
- cert_timeline_leverage
- standards_update_risk
- partnerships_reduce_exposure
Support tools and silicon roadmaps
Support toolchains, FPGA/SmartNIC SDKs and vendor microcode materially affect Array Networks’ time-to-market; the global FPGA/SmartNIC ecosystem (~$7.5B in 2024) is concentrated with vendors (Intel, AMD/Xilinx) controlling >60% supply, so roadmap slips can cause missed performance claims and lost competitiveness. Access to early-silicon programs is a bargaining chip; co-development deals often trade margin for priority access.
- Toolchain stability: affects TTM
- Roadmap slips: harms performance claims
- Early-silicon: bargaining leverage
High supplier concentration, 8-26w lead times; cloud 33/22/11
High supplier concentration (Intel/Broadcom/NVIDIA dominant) gives strong pricing/leverage; 2020–22 shocks showed lead times up to 26 weeks. EMS market >$600B (2024) and 8–12 week lead times raise MOQ/pricing risk. Cloud distribution concentrated (AWS 33%/Azure 22%/GCP 11% in 2024), compressing margins. FPGA/SmartNIC >60% supply concentration and certification timelines (FIPS/PQC) add schedule risk.
| Category | 2024 stat | Impact |
|---|---|---|
| CPUs/ASICs | Concentrated: Intel/Broadcom/NVIDIA | Pricing power, lead-time risk |
| EMS | >$600B market; 8–12wk LT | MOQ/pricing pressure |
| Cloud | AWS33%/Azure22%/GCP11% | Fee/platform leverage |
| FPGA/SmartNIC | ~$7.5B; >60% supply | TTM, co-dev bargaining |
| Certs | FIPS140-3 (2023), PQC (2022) | Scheduling/engineering risk |
What is included in the product
Detailed Word Document
Concise Porter's Five Forces assessment of Array Networks that uncovers competitive drivers, buyer and supplier power, substitute threats, and entry barriers specific to its networking and security appliance market; includes strategic insights on disruptive technologies and implications for pricing, margins, and market positioning.
Customizable Excel Spreadsheet
A clear one-sheet Porter's Five Forces for Array Networks that visualizes strategic pressure with a spider chart, lets you customize force levels with current data, and exports cleanly into decks—no macros or finance expertise required.
Customers Bargaining Power
Enterprise RFP leverage
Large enterprises and service providers run competitive RFPs that typically shortlist 3–5 ADC vendors, increasing Array Networks pricing pressure; standardized feature checklists in 2024 drove greater price transparency and average discounts in the ADC sector of roughly 10–20%. Multi-year agreements increasingly hinge on POCs and validated reference architectures, with buyers extracting bundling and extended-support concessions in a majority of large deals.
Multi-vendor strategies
Customers frequently dual-source ADCs and remote access solutions to avoid vendor lock-in, which reduces switching costs and strengthens their negotiation leverage. Interoperability expectations force vendors to support common APIs and configurations to remain competitive. To capture wallet share vendors must demonstrate clearly differentiated ROI and lower TCO through measurable performance, manageability, and lifecycle savings.
Price sensitivity vs performance
Mid-market buyers prioritize performance per dollar and license simplicity, often choosing solutions that maximize throughput for budgeted spend. Per-core and throughput-based pricing frequently prompt downsizing or shifts to virtual editions to avoid hardware premiums. Transparent capacity planning tools strengthen pricing defensibility while flexible subscriptions mitigate budget constraints. Global cybersecurity market reached $188.1B in 2024 (Statista).
Demand for integrated security
Buyers increasingly demand ADCs with integrated WAF, DDoS, bot defense and ZTNA; a 2024 Forrester survey reported about 64% of enterprises favor convergence over best-of-breed, and when Array lags leaders customers split spend or negotiate steep discounts. Security validation, pen-test results and certifications heavily sway procurement, while tight integrations raise switching costs and lock renewals.
- Integrated demand: 64% (Forrester 2024)
- Best-of-breed split spend risk
- Certs/pen-tests drive selection
- Integration increases switching costs
Lifecycle and support expectations
Enterprises require 24/7 SLAs, rapid TAC response (often under 1 hour), and hardware lifecycles of 5–7 years; renewal and uplift negotiations hinge on perceived support quality. Poor incident handling accelerates churn, linked in industry reports to several percentage points higher attrition. Proactive health telemetry and SLO reporting can justify premiums and have been shown in vendor case studies to increase renewal rates by 10–20%.
- 24/7 SLAs + TAC <1h
- Hardware lifecycles 5–7 years
- Telemetry/SLOs → +10–20% renewals
Buyers force 10–20% ADC discounts; 64% prefer integrated security
Buyers wield strong bargaining power: enterprise RFPs shortlist 3–5 vendors, driving 10–20% average ADC discounts in 2024 and frequent dual-sourcing to avoid lock-in. 64% of enterprises favor integrated ADC/security, increasing split-spend risk when Array lags. Support SLAs <1h and 5–7 year hardware lifecycles; telemetry/SLOs lift renewals 10–20%.
| Metric | 2024 Value |
|---|---|
| Avg ADC discount | 10–20% |
| Integrated demand | 64% (Forrester) |
| Cybersecurity market | $188.1B (Statista) |
Preview the Actual Deliverable
Array Networks Porter's Five Forces Analysis
This preview shows the exact Array Networks Porter's Five Forces analysis you'll receive immediately after purchase—no surprises, no placeholders. The document displayed here is the professionally formatted, final version ready for download and use the moment you buy. You're getting the complete, ready-to-use deliverable with full findings and actionable insights.
Original: $10.00
-65%$10.00
$3.50Description
Don't Miss the Bigger Picture
Array Networks faces moderate rivalry, rising substitution risk from cloud-native networking, and concentrated supplier dynamics that shape margins and growth prospects. This brief snapshot only scratches the surface. Unlock the full Porter's Five Forces Analysis to explore Array Networks’s competitive dynamics, market pressures, and strategic advantages in detail.
Suppliers Bargaining Power
Chipset and NIC concentration
Array depends on a narrow set of high-performance CPU, ASIC and NIC suppliers—notably Intel, Broadcom and NVIDIA—for SSL/TLS offload and L4–L7 throughput; supply shocks in 2020–22 drove NIC/ASIC lead times up to 26 weeks. Vendors with proprietary acceleration IP exert clear pricing leverage, and while multisourcing and shifting workloads to software reduce exposure, they do not eliminate procurement or performance constraints.
Contract manufacturing dependence
Hardware appliances rely on EMS partners for PCB assembly, testing and logistics; the global EMS market exceeded $600B in 2024, concentrating supplier leverage. Volume swings and lead-time volatility (commonly 8–12 weeks in 2024) boost manufacturers' bargaining power on MOQs and pricing. Quality and yield problems can delay deliveries and increase unit costs, while a diversified EMS footprint lowers supplier concentration risk but raises coordination and oversight complexity.
Cloud marketplace and IaaS platforms
Virtual ADCs and gateways rely on AWS, Azure and GCP marketplaces for distribution and billing, with 2024 public cloud IaaS/PaaS share roughly AWS ~33%, Azure ~22% and GCP ~11%, concentrating seller dependence. Platform fees, shifting policies and technical integrations compress margins and obscure visibility, while preferential placement can materially boost demand capture. Offering direct licensing reduces platform leverage but narrows marketplace reach.
Software stack and security certs
Reliance on third‑party libraries, crypto modules and FIPS/Common Criteria labs creates specialized supplier power; FIPS 140‑3 took effect in 2023 and NIST’s PQC selections were finalized in 2022, making certification timelines and test cycles (often months long) key scheduling levers that can force unplanned engineering for TLS/PQC updates.
- specialized_suppliers
- cert_timeline_leverage
- standards_update_risk
- partnerships_reduce_exposure
Support tools and silicon roadmaps
Support toolchains, FPGA/SmartNIC SDKs and vendor microcode materially affect Array Networks’ time-to-market; the global FPGA/SmartNIC ecosystem (~$7.5B in 2024) is concentrated with vendors (Intel, AMD/Xilinx) controlling >60% supply, so roadmap slips can cause missed performance claims and lost competitiveness. Access to early-silicon programs is a bargaining chip; co-development deals often trade margin for priority access.
- Toolchain stability: affects TTM
- Roadmap slips: harms performance claims
- Early-silicon: bargaining leverage
High supplier concentration, 8-26w lead times; cloud 33/22/11
High supplier concentration (Intel/Broadcom/NVIDIA dominant) gives strong pricing/leverage; 2020–22 shocks showed lead times up to 26 weeks. EMS market >$600B (2024) and 8–12 week lead times raise MOQ/pricing risk. Cloud distribution concentrated (AWS 33%/Azure 22%/GCP 11% in 2024), compressing margins. FPGA/SmartNIC >60% supply concentration and certification timelines (FIPS/PQC) add schedule risk.
| Category | 2024 stat | Impact |
|---|---|---|
| CPUs/ASICs | Concentrated: Intel/Broadcom/NVIDIA | Pricing power, lead-time risk |
| EMS | >$600B market; 8–12wk LT | MOQ/pricing pressure |
| Cloud | AWS33%/Azure22%/GCP11% | Fee/platform leverage |
| FPGA/SmartNIC | ~$7.5B; >60% supply | TTM, co-dev bargaining |
| Certs | FIPS140-3 (2023), PQC (2022) | Scheduling/engineering risk |
What is included in the product
Detailed Word Document
Concise Porter's Five Forces assessment of Array Networks that uncovers competitive drivers, buyer and supplier power, substitute threats, and entry barriers specific to its networking and security appliance market; includes strategic insights on disruptive technologies and implications for pricing, margins, and market positioning.
Customizable Excel Spreadsheet
A clear one-sheet Porter's Five Forces for Array Networks that visualizes strategic pressure with a spider chart, lets you customize force levels with current data, and exports cleanly into decks—no macros or finance expertise required.
Customers Bargaining Power
Enterprise RFP leverage
Large enterprises and service providers run competitive RFPs that typically shortlist 3–5 ADC vendors, increasing Array Networks pricing pressure; standardized feature checklists in 2024 drove greater price transparency and average discounts in the ADC sector of roughly 10–20%. Multi-year agreements increasingly hinge on POCs and validated reference architectures, with buyers extracting bundling and extended-support concessions in a majority of large deals.
Multi-vendor strategies
Customers frequently dual-source ADCs and remote access solutions to avoid vendor lock-in, which reduces switching costs and strengthens their negotiation leverage. Interoperability expectations force vendors to support common APIs and configurations to remain competitive. To capture wallet share vendors must demonstrate clearly differentiated ROI and lower TCO through measurable performance, manageability, and lifecycle savings.
Price sensitivity vs performance
Mid-market buyers prioritize performance per dollar and license simplicity, often choosing solutions that maximize throughput for budgeted spend. Per-core and throughput-based pricing frequently prompt downsizing or shifts to virtual editions to avoid hardware premiums. Transparent capacity planning tools strengthen pricing defensibility while flexible subscriptions mitigate budget constraints. Global cybersecurity market reached $188.1B in 2024 (Statista).
Demand for integrated security
Buyers increasingly demand ADCs with integrated WAF, DDoS, bot defense and ZTNA; a 2024 Forrester survey reported about 64% of enterprises favor convergence over best-of-breed, and when Array lags leaders customers split spend or negotiate steep discounts. Security validation, pen-test results and certifications heavily sway procurement, while tight integrations raise switching costs and lock renewals.
- Integrated demand: 64% (Forrester 2024)
- Best-of-breed split spend risk
- Certs/pen-tests drive selection
- Integration increases switching costs
Lifecycle and support expectations
Enterprises require 24/7 SLAs, rapid TAC response (often under 1 hour), and hardware lifecycles of 5–7 years; renewal and uplift negotiations hinge on perceived support quality. Poor incident handling accelerates churn, linked in industry reports to several percentage points higher attrition. Proactive health telemetry and SLO reporting can justify premiums and have been shown in vendor case studies to increase renewal rates by 10–20%.
- 24/7 SLAs + TAC <1h
- Hardware lifecycles 5–7 years
- Telemetry/SLOs → +10–20% renewals
Buyers force 10–20% ADC discounts; 64% prefer integrated security
Buyers wield strong bargaining power: enterprise RFPs shortlist 3–5 vendors, driving 10–20% average ADC discounts in 2024 and frequent dual-sourcing to avoid lock-in. 64% of enterprises favor integrated ADC/security, increasing split-spend risk when Array lags. Support SLAs <1h and 5–7 year hardware lifecycles; telemetry/SLOs lift renewals 10–20%.
| Metric | 2024 Value |
|---|---|
| Avg ADC discount | 10–20% |
| Integrated demand | 64% (Forrester) |
| Cybersecurity market | $188.1B (Statista) |
Preview the Actual Deliverable
Array Networks Porter's Five Forces Analysis
This preview shows the exact Array Networks Porter's Five Forces analysis you'll receive immediately after purchase—no surprises, no placeholders. The document displayed here is the professionally formatted, final version ready for download and use the moment you buy. You're getting the complete, ready-to-use deliverable with full findings and actionable insights.











