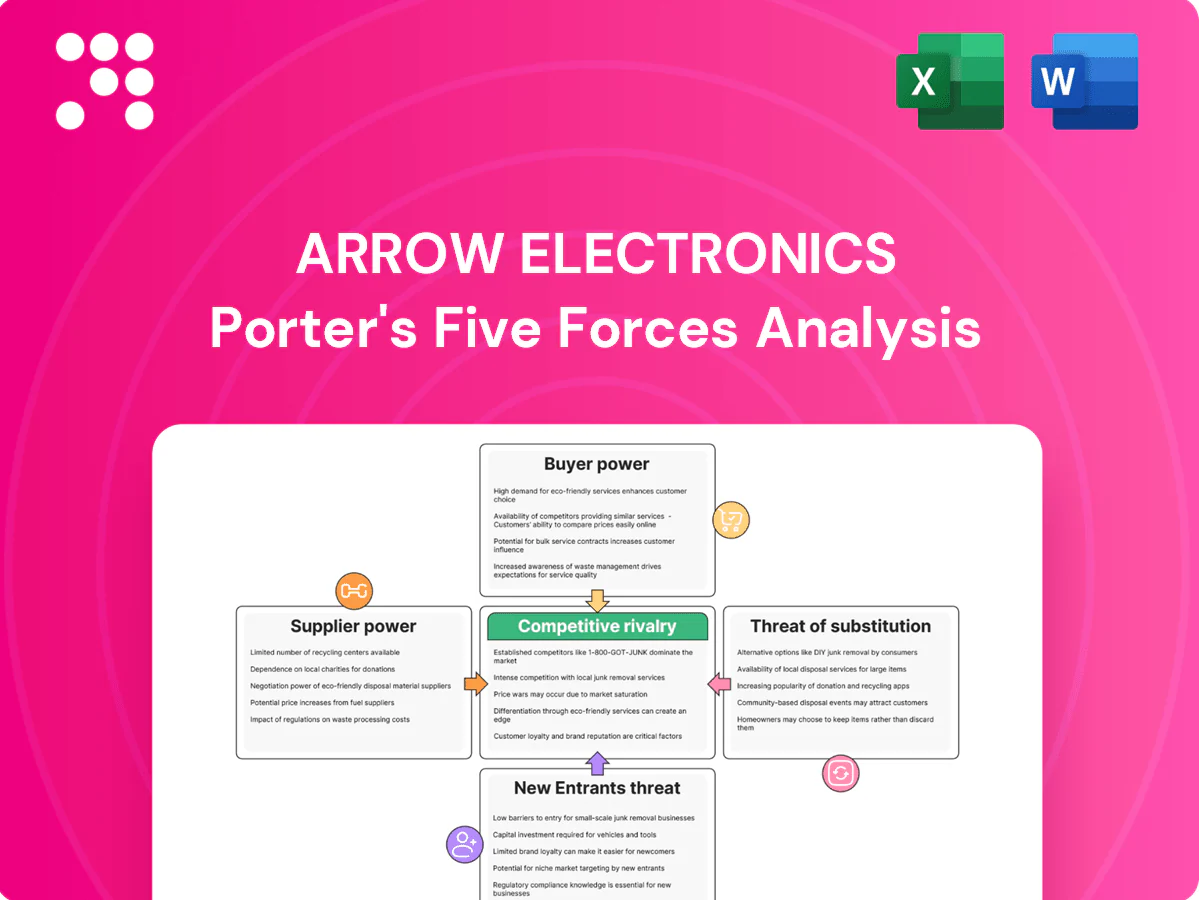
Arrow Electronics Porter's Five Forces Analysis

Don't Miss the Bigger Picture
Arrow Electronics faces intense buyer bargaining and supplier consolidation, while scale advantages and distribution breadth temper new-entrant threats; substitutes and technological shifts add strategic pressure. This snapshot highlights the key competitive levers but only scratches the surface. Unlock the full Porter's Five Forces Analysis to explore Arrow’s competitive dynamics, force-by-force ratings, and actionable insights for investment or strategy decisions.
Suppliers Bargaining Power

Concentrated chip OEMs
Leading semiconductor manufacturers are few and large: in 2024 the top 5 chipmakers captured roughly 50% of global semiconductor revenue and TSMC held about 55% of pure‑play foundry capacity, concentrating supply power. Their product roadmaps and allocation decisions materially affect Arrow Electronics’ availability and pricing. Exclusive or limited franchise agreements further strengthen supplier leverage. Arrow mitigates via multi‑line portfolios and demand forecasting.
Allocation cycles & shortages
Silicon cycles and 2024 capacity constraints — with global semiconductor sales ~615 billion USD (WSTS estimate) and fab utilization north of 90% — shift bargaining power to suppliers during shortages. Suppliers prioritize strategic customers and higher-margin channels, leaving distributors like Arrow to balance contractual commitments, expedite airfreight and pay premiums to secure buffer inventory. These actions squeeze gross margins and can degrade service levels when allocation tightens.

Design-in influence
Suppliers shape demand via reference designs and preferred components, and once a part is designed-in switching costs and time-to-certify give suppliers leverage on key SKUs. This design-in influence drives price and availability pressure across supply chains; Arrow, a Fortune 200 company in 2024, mitigates that by using engineering support to co-steer designs toward multi-sourceable parts. That materially reduces single-supplier dependence for many customers.

Direct channels by suppliers
- OEM direct e-commerce growth 2024: increases supplier leverage
- Arrow countermeasures: services, financing, global logistics
- Service bundling: retention and higher gross margins
Compliance and quality control
High stakes in traceability, IP protection, and counterfeit avoidance tighten supplier gatekeeping, raising barriers to open-market sourcing. Certified, franchised lines command premium terms versus gray channels, and Arrow’s 2024 focus on enhanced quality systems and supplier audits is critical to retain franchises. That reliance increases supplier influence over pricing, lead-times, and access.
- Franchised lines: premium terms
- Traceability/IP: heightened controls
- 2024: increased audit emphasis
- Supplier leverage: pricing & access
Top supply concentrated: Top 5 ~50%, TSMC foundry ~55%
Top suppliers concentrated: top 5 chipmakers ~50% of 2024 semiconductor revenue and TSMC ~55% of pure‑play foundry capacity, concentrating supply leverage over Arrow.
2024 sales ~$615B and fab utilization >90% heighten shortages; OEM direct e-commerce further shifts power to suppliers and pressures distributor margins.
Arrow counters with engineering support, multi‑sourcing, franchised lines and services, but certified supply dependence keeps supplier influence high.
| Metric | 2024 | Implication |
|---|---|---|
| Top‑5 chipmakers | ~50% | High supplier leverage |
| TSMC foundry | ~55% | Capacity concentration |
| Global sales | $615B | Demand pressure |
| Fab utilization | >90% | Shortage risk |
What is included in the product
 Detailed Word Document
Tailored Porter’s Five Forces analysis for Arrow Electronics that uncovers key drivers of competition, buyer and supplier power, threat of substitutes, and barriers to entry, highlighting disruptive forces and strategic vulnerabilities that influence pricing and profitability.

 Customizable Excel Spreadsheet
Clear one-sheet summary of Arrow Electronics’ Five Forces—instantly spot supplier/customer leverage, competitive intensity, substitution risk and entry threats to guide rapid strategic decisions.
Customers Bargaining Power

Large OEM/EMS consolidation
Major OEMs and EMS (top 5: Foxconn, Jabil, Flex, Wistron, Pegatron) account for roughly half of outsourced electronics volume, buying at scale and pushing multi-year frameworks, bids and reverse auctions that can shave 5–15% off prices. Arrow (FY2024 revenue ~$38.7B) must compete on cost-to-serve, credit terms and supply assurance. Volume commitments compress margins but provide demand stability.
Price transparency
Commodity components have widely visible pricing across distributors, enabling buyers to benchmark swiftly across geographies and platforms; Arrow operates in over 85 countries and employed roughly 20,000 people in 2024 to support that reach. Arrow differentiates via total landed cost analytics, superior availability and lifecycle services, including repair and obsolescence management. Nevertheless, this transparency increases buyer leverage in price negotiations and contract terms.

Switching costs via services
As of 2024 Arrow uses engineering design support, AVL management and VMI to increase customer stickiness, letting buyers trade lower prices for higher service value. Integrated planning and IT integrations such as ERP/API links raise effective switching costs by embedding Arrow into buyers operations. Arrow leverages depth of integration to gradually moderate buyer power over time, shifting negotiation toward service-based value rather than pure price.

Demand cyclicality
Customers cut or surge orders with market cycles, shifting Arrow’s product mix and raising inventory risk as buyers demand flexibility, consignment programs, and generous returns; this increases working capital pressure and margin variability. Arrow responds with improved forecasting, inventory buffers, dynamic pricing and contractual incentives, while rebates and volume discounts align customer behavior but add operational complexity and accounting volatility.
- Order volatility: drives mix & inventory risk
- Buyer demands: consignment, returns, flexibility
- Controls: forecasting, buffers, dynamic pricing
- Incentives: rebates align demand but increase complexity
SMB long tail
- Lower individual price leverage
- Digital channels boost margin efficiency
- Standardized offerings enable profitable scale
- Aggregation diversifies revenue
OEM reverse auctions cut 5–15% prices; distributors lock customers with design, VMI and ERP
Major OEMs/EMS (top 5 ~50% of outsourced volume) force multi-year bids/reverse auctions trimming 5–15% pricing; Arrow (FY2024 revenue ~38.7B, ~20,000 employees) competes on cost-to-serve, credit and supply assurance. Component price transparency raises buyer leverage, but Arrow offsets via design support, VMI and ERP/API integrations that raise switching costs and stabilize demand. SMBs (~90% of firms, World Bank 2024) have low individual leverage; e-commerce and standardized services protect margins.
| Metric | 2024 Value |
|---|---|
| Arrow revenue | ~38.7B |
| Employees | ~20,000 |
| OEM/EMS share | ~50% |
| Price pressure from auctions | 5–15% |
Full Version Awaits
Arrow Electronics Porter's Five Forces Analysis
This preview shows the exact Arrow Electronics Porter’s Five Forces analysis you'll receive—no surprises, no placeholders. The file is the full, professionally formatted assessment covering supplier power, buyer power, competitive rivalry, and threats of new entrants and substitutes. Purchase grants immediate access to this same document, ready to download and use.

Don't Miss the Bigger Picture
Arrow Electronics faces intense buyer bargaining and supplier consolidation, while scale advantages and distribution breadth temper new-entrant threats; substitutes and technological shifts add strategic pressure. This snapshot highlights the key competitive levers but only scratches the surface. Unlock the full Porter's Five Forces Analysis to explore Arrow’s competitive dynamics, force-by-force ratings, and actionable insights for investment or strategy decisions.
Suppliers Bargaining Power
Concentrated chip OEMs
Leading semiconductor manufacturers are few and large: in 2024 the top 5 chipmakers captured roughly 50% of global semiconductor revenue and TSMC held about 55% of pure‑play foundry capacity, concentrating supply power. Their product roadmaps and allocation decisions materially affect Arrow Electronics’ availability and pricing. Exclusive or limited franchise agreements further strengthen supplier leverage. Arrow mitigates via multi‑line portfolios and demand forecasting.
Allocation cycles & shortages
Silicon cycles and 2024 capacity constraints — with global semiconductor sales ~615 billion USD (WSTS estimate) and fab utilization north of 90% — shift bargaining power to suppliers during shortages. Suppliers prioritize strategic customers and higher-margin channels, leaving distributors like Arrow to balance contractual commitments, expedite airfreight and pay premiums to secure buffer inventory. These actions squeeze gross margins and can degrade service levels when allocation tightens.
Design-in influence
Suppliers shape demand via reference designs and preferred components, and once a part is designed-in switching costs and time-to-certify give suppliers leverage on key SKUs. This design-in influence drives price and availability pressure across supply chains; Arrow, a Fortune 200 company in 2024, mitigates that by using engineering support to co-steer designs toward multi-sourceable parts. That materially reduces single-supplier dependence for many customers.
Direct channels by suppliers
- OEM direct e-commerce growth 2024: increases supplier leverage
- Arrow countermeasures: services, financing, global logistics
- Service bundling: retention and higher gross margins
Compliance and quality control
High stakes in traceability, IP protection, and counterfeit avoidance tighten supplier gatekeeping, raising barriers to open-market sourcing. Certified, franchised lines command premium terms versus gray channels, and Arrow’s 2024 focus on enhanced quality systems and supplier audits is critical to retain franchises. That reliance increases supplier influence over pricing, lead-times, and access.
- Franchised lines: premium terms
- Traceability/IP: heightened controls
- 2024: increased audit emphasis
- Supplier leverage: pricing & access
Top supply concentrated: Top 5 ~50%, TSMC foundry ~55%
Top suppliers concentrated: top 5 chipmakers ~50% of 2024 semiconductor revenue and TSMC ~55% of pure‑play foundry capacity, concentrating supply leverage over Arrow.
2024 sales ~$615B and fab utilization >90% heighten shortages; OEM direct e-commerce further shifts power to suppliers and pressures distributor margins.
Arrow counters with engineering support, multi‑sourcing, franchised lines and services, but certified supply dependence keeps supplier influence high.
| Metric | 2024 | Implication |
|---|---|---|
| Top‑5 chipmakers | ~50% | High supplier leverage |
| TSMC foundry | ~55% | Capacity concentration |
| Global sales | $615B | Demand pressure |
| Fab utilization | >90% | Shortage risk |
What is included in the product
Detailed Word Document
Tailored Porter’s Five Forces analysis for Arrow Electronics that uncovers key drivers of competition, buyer and supplier power, threat of substitutes, and barriers to entry, highlighting disruptive forces and strategic vulnerabilities that influence pricing and profitability.
Customizable Excel Spreadsheet
Clear one-sheet summary of Arrow Electronics’ Five Forces—instantly spot supplier/customer leverage, competitive intensity, substitution risk and entry threats to guide rapid strategic decisions.
Customers Bargaining Power
Large OEM/EMS consolidation
Major OEMs and EMS (top 5: Foxconn, Jabil, Flex, Wistron, Pegatron) account for roughly half of outsourced electronics volume, buying at scale and pushing multi-year frameworks, bids and reverse auctions that can shave 5–15% off prices. Arrow (FY2024 revenue ~$38.7B) must compete on cost-to-serve, credit terms and supply assurance. Volume commitments compress margins but provide demand stability.
Price transparency
Commodity components have widely visible pricing across distributors, enabling buyers to benchmark swiftly across geographies and platforms; Arrow operates in over 85 countries and employed roughly 20,000 people in 2024 to support that reach. Arrow differentiates via total landed cost analytics, superior availability and lifecycle services, including repair and obsolescence management. Nevertheless, this transparency increases buyer leverage in price negotiations and contract terms.
Switching costs via services
As of 2024 Arrow uses engineering design support, AVL management and VMI to increase customer stickiness, letting buyers trade lower prices for higher service value. Integrated planning and IT integrations such as ERP/API links raise effective switching costs by embedding Arrow into buyers operations. Arrow leverages depth of integration to gradually moderate buyer power over time, shifting negotiation toward service-based value rather than pure price.
Demand cyclicality
Customers cut or surge orders with market cycles, shifting Arrow’s product mix and raising inventory risk as buyers demand flexibility, consignment programs, and generous returns; this increases working capital pressure and margin variability. Arrow responds with improved forecasting, inventory buffers, dynamic pricing and contractual incentives, while rebates and volume discounts align customer behavior but add operational complexity and accounting volatility.
- Order volatility: drives mix & inventory risk
- Buyer demands: consignment, returns, flexibility
- Controls: forecasting, buffers, dynamic pricing
- Incentives: rebates align demand but increase complexity
SMB long tail
- Lower individual price leverage
- Digital channels boost margin efficiency
- Standardized offerings enable profitable scale
- Aggregation diversifies revenue
OEM reverse auctions cut 5–15% prices; distributors lock customers with design, VMI and ERP
Major OEMs/EMS (top 5 ~50% of outsourced volume) force multi-year bids/reverse auctions trimming 5–15% pricing; Arrow (FY2024 revenue ~38.7B, ~20,000 employees) competes on cost-to-serve, credit and supply assurance. Component price transparency raises buyer leverage, but Arrow offsets via design support, VMI and ERP/API integrations that raise switching costs and stabilize demand. SMBs (~90% of firms, World Bank 2024) have low individual leverage; e-commerce and standardized services protect margins.
| Metric | 2024 Value |
|---|---|
| Arrow revenue | ~38.7B |
| Employees | ~20,000 |
| OEM/EMS share | ~50% |
| Price pressure from auctions | 5–15% |
Full Version Awaits
Arrow Electronics Porter's Five Forces Analysis
This preview shows the exact Arrow Electronics Porter’s Five Forces analysis you'll receive—no surprises, no placeholders. The file is the full, professionally formatted assessment covering supplier power, buyer power, competitive rivalry, and threats of new entrants and substitutes. Purchase grants immediate access to this same document, ready to download and use.
Original: $10.00
-65%$10.00
$3.50Description
Don't Miss the Bigger Picture
Arrow Electronics faces intense buyer bargaining and supplier consolidation, while scale advantages and distribution breadth temper new-entrant threats; substitutes and technological shifts add strategic pressure. This snapshot highlights the key competitive levers but only scratches the surface. Unlock the full Porter's Five Forces Analysis to explore Arrow’s competitive dynamics, force-by-force ratings, and actionable insights for investment or strategy decisions.
Suppliers Bargaining Power
Concentrated chip OEMs
Leading semiconductor manufacturers are few and large: in 2024 the top 5 chipmakers captured roughly 50% of global semiconductor revenue and TSMC held about 55% of pure‑play foundry capacity, concentrating supply power. Their product roadmaps and allocation decisions materially affect Arrow Electronics’ availability and pricing. Exclusive or limited franchise agreements further strengthen supplier leverage. Arrow mitigates via multi‑line portfolios and demand forecasting.
Allocation cycles & shortages
Silicon cycles and 2024 capacity constraints — with global semiconductor sales ~615 billion USD (WSTS estimate) and fab utilization north of 90% — shift bargaining power to suppliers during shortages. Suppliers prioritize strategic customers and higher-margin channels, leaving distributors like Arrow to balance contractual commitments, expedite airfreight and pay premiums to secure buffer inventory. These actions squeeze gross margins and can degrade service levels when allocation tightens.
Design-in influence
Suppliers shape demand via reference designs and preferred components, and once a part is designed-in switching costs and time-to-certify give suppliers leverage on key SKUs. This design-in influence drives price and availability pressure across supply chains; Arrow, a Fortune 200 company in 2024, mitigates that by using engineering support to co-steer designs toward multi-sourceable parts. That materially reduces single-supplier dependence for many customers.
Direct channels by suppliers
- OEM direct e-commerce growth 2024: increases supplier leverage
- Arrow countermeasures: services, financing, global logistics
- Service bundling: retention and higher gross margins
Compliance and quality control
High stakes in traceability, IP protection, and counterfeit avoidance tighten supplier gatekeeping, raising barriers to open-market sourcing. Certified, franchised lines command premium terms versus gray channels, and Arrow’s 2024 focus on enhanced quality systems and supplier audits is critical to retain franchises. That reliance increases supplier influence over pricing, lead-times, and access.
- Franchised lines: premium terms
- Traceability/IP: heightened controls
- 2024: increased audit emphasis
- Supplier leverage: pricing & access
Top supply concentrated: Top 5 ~50%, TSMC foundry ~55%
Top suppliers concentrated: top 5 chipmakers ~50% of 2024 semiconductor revenue and TSMC ~55% of pure‑play foundry capacity, concentrating supply leverage over Arrow.
2024 sales ~$615B and fab utilization >90% heighten shortages; OEM direct e-commerce further shifts power to suppliers and pressures distributor margins.
Arrow counters with engineering support, multi‑sourcing, franchised lines and services, but certified supply dependence keeps supplier influence high.
| Metric | 2024 | Implication |
|---|---|---|
| Top‑5 chipmakers | ~50% | High supplier leverage |
| TSMC foundry | ~55% | Capacity concentration |
| Global sales | $615B | Demand pressure |
| Fab utilization | >90% | Shortage risk |
What is included in the product
Detailed Word Document
Tailored Porter’s Five Forces analysis for Arrow Electronics that uncovers key drivers of competition, buyer and supplier power, threat of substitutes, and barriers to entry, highlighting disruptive forces and strategic vulnerabilities that influence pricing and profitability.
Customizable Excel Spreadsheet
Clear one-sheet summary of Arrow Electronics’ Five Forces—instantly spot supplier/customer leverage, competitive intensity, substitution risk and entry threats to guide rapid strategic decisions.
Customers Bargaining Power
Large OEM/EMS consolidation
Major OEMs and EMS (top 5: Foxconn, Jabil, Flex, Wistron, Pegatron) account for roughly half of outsourced electronics volume, buying at scale and pushing multi-year frameworks, bids and reverse auctions that can shave 5–15% off prices. Arrow (FY2024 revenue ~$38.7B) must compete on cost-to-serve, credit terms and supply assurance. Volume commitments compress margins but provide demand stability.
Price transparency
Commodity components have widely visible pricing across distributors, enabling buyers to benchmark swiftly across geographies and platforms; Arrow operates in over 85 countries and employed roughly 20,000 people in 2024 to support that reach. Arrow differentiates via total landed cost analytics, superior availability and lifecycle services, including repair and obsolescence management. Nevertheless, this transparency increases buyer leverage in price negotiations and contract terms.
Switching costs via services
As of 2024 Arrow uses engineering design support, AVL management and VMI to increase customer stickiness, letting buyers trade lower prices for higher service value. Integrated planning and IT integrations such as ERP/API links raise effective switching costs by embedding Arrow into buyers operations. Arrow leverages depth of integration to gradually moderate buyer power over time, shifting negotiation toward service-based value rather than pure price.
Demand cyclicality
Customers cut or surge orders with market cycles, shifting Arrow’s product mix and raising inventory risk as buyers demand flexibility, consignment programs, and generous returns; this increases working capital pressure and margin variability. Arrow responds with improved forecasting, inventory buffers, dynamic pricing and contractual incentives, while rebates and volume discounts align customer behavior but add operational complexity and accounting volatility.
- Order volatility: drives mix & inventory risk
- Buyer demands: consignment, returns, flexibility
- Controls: forecasting, buffers, dynamic pricing
- Incentives: rebates align demand but increase complexity
SMB long tail
- Lower individual price leverage
- Digital channels boost margin efficiency
- Standardized offerings enable profitable scale
- Aggregation diversifies revenue
OEM reverse auctions cut 5–15% prices; distributors lock customers with design, VMI and ERP
Major OEMs/EMS (top 5 ~50% of outsourced volume) force multi-year bids/reverse auctions trimming 5–15% pricing; Arrow (FY2024 revenue ~38.7B, ~20,000 employees) competes on cost-to-serve, credit and supply assurance. Component price transparency raises buyer leverage, but Arrow offsets via design support, VMI and ERP/API integrations that raise switching costs and stabilize demand. SMBs (~90% of firms, World Bank 2024) have low individual leverage; e-commerce and standardized services protect margins.
| Metric | 2024 Value |
|---|---|
| Arrow revenue | ~38.7B |
| Employees | ~20,000 |
| OEM/EMS share | ~50% |
| Price pressure from auctions | 5–15% |
Full Version Awaits
Arrow Electronics Porter's Five Forces Analysis
This preview shows the exact Arrow Electronics Porter’s Five Forces analysis you'll receive—no surprises, no placeholders. The file is the full, professionally formatted assessment covering supplier power, buyer power, competitive rivalry, and threats of new entrants and substitutes. Purchase grants immediate access to this same document, ready to download and use.











