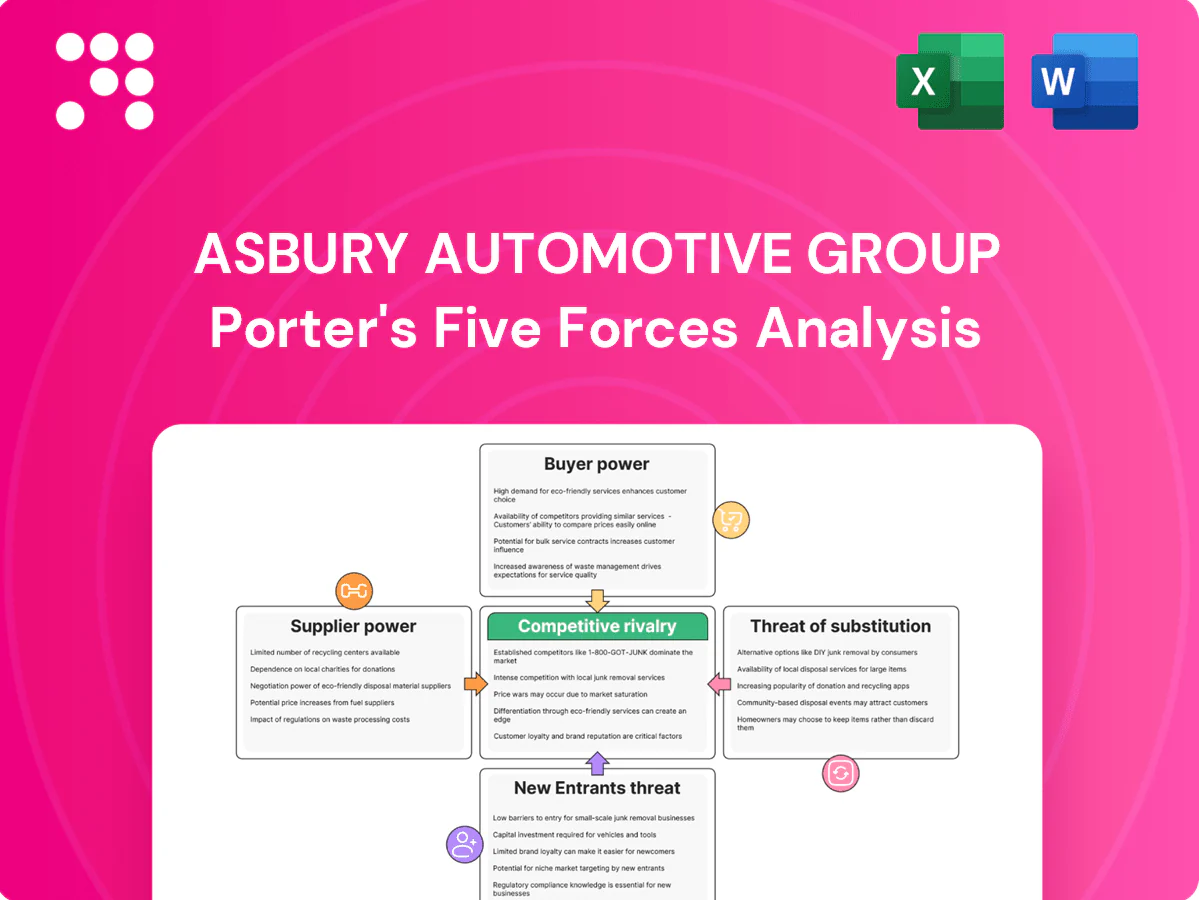
Asbury Automotive Group Porter's Five Forces Analysis

Go Beyond the Preview—Access the Full Strategic Report
Asbury Automotive Group faces moderate buyer power, concentrated supplier dynamics, intense dealer rivalry, manageable threat of new entrants, and rising substitute risks from mobility shifts. This snapshot highlights the competitive pressures that influence margins and growth. This brief preview only scratches the surface—unlock the full Porter's Five Forces Analysis for detailed ratings, visuals, and strategic implications.
Suppliers Bargaining Power

OEM concentration
Asbury relies on a limited set of major automakers for new-vehicle supply, branding support and incentive programs, while U.S. light-vehicle market concentration remained high in 2024 with the top three OEMs holding roughly 40% market share, giving OEMs leverage over allocations, model mix and floorplan terms. Warranty reimbursement rates and facility image programs further compress dealer margins; multi-brand diversification reduces but does not remove this dependence.
Allocation and inventory
Production cycles, EV ramp-ups and semiconductor constraints in 2024 left OEMs able to allocate scarce inventory, boosting dealer margins as Cox Automotive reported industry days' supply near 60 days mid-2024; preferred dealers like Asbury often receive allocations tied to compliance and sales performance metrics. Tight supply raised vehicle gross profits but strengthened supplier bargaining power, while normalizing inventories reduce OEM leverage though OEMs retain structural allocation control.

Parts and service inputs
Proprietary OEM and tier-1 parts constrain substitution in warranty work, preserving supplier leverage over Asbury's fixed-ops. Aftermarket parts reduce supplier power on customer-pay jobs, accounting for a modest share of parts revenue. Parts and labor inflation in 2024 tightened fixed-ops margins, with industry parts costs rising mid-single digits. Multi-sourcing and improved inventory management helped contain cost pressure.

F&I and lender networks
Banks, captives, and product administrators materially shape Asbury’s F&I program economics and approvals, with captive lenders retaining leverage when tied to OEM incentives even as lender competition limits absolute power. Rate moves and underwriting shifts—against a 2024 federal funds range near 5.25–5.50%—can quickly reprice F&I penetration and back-end gross. Growing digital e-contracting standards increase switching frictions for dealer-lender relationships.
- Captives retain OEM-linked leverage
- Rate moves (2024 fed funds ~5.25–5.50%) reprice F&I
- Competition tempers supplier power
- e-contracting creates switching frictions
Collision and technology
Collision and technology suppliers exert rising leverage over Asbury as ADAS calibrations and OEM repair protocols force reliance on certified tools, OEM data access, and paid telematics—binding dealers to prescribed inputs; Asbury’s reported 2024 revenue near 12 billion supports scale but not supplier independence.
- Certified tools raise repair costs and margins pressure
- Paint/glass/equipment suppliers occupy niche pricing power
- OEM-gated telematics limits software/update access
Multi-brand dealer faces OEM-driven supplier leverage; top-3 ~40% share
Asbury’s supplier power is elevated by reliance on a handful of OEMs (top 3 ~40% share) and OEM-controlled allocation/brand programs, even as multi-brand scale and $≈12B 2024 revenue provide negotiating leverage. Tight 2024 supply (≈60 days' supply) and certified-tool/telematics mandates increase OEM and collision-supplier leverage; parts inflation (~+4% 2024) and 2024 fed funds near 5.25–5.50% pressure F&I and fixed-ops margins.
| Metric | 2024 value |
|---|---|
| Asbury revenue | $≈12B |
| Top-3 OEM market share | ~40% |
| Industry days' supply (mid-2024) | ≈60 days |
| Parts cost change | ~+4% |
| Federal funds rate (2024) | 5.25–5.50% |
What is included in the product
 Detailed Word Document
Provides a tailored Porter's Five Forces analysis for Asbury Automotive Group, uncovering competitive rivalry, buyer and supplier power, threat of new entrants and substitutes, and regulatory/technology disruptions; highlights strategic vulnerabilities and defensive advantages to guide investor and management decisions.

 Customizable Excel Spreadsheet
A concise, one-sheet Porter’s Five Forces for Asbury Automotive Group—clearly scores competitive pressures and pinpoints pain points for quick strategic action; editable inputs let you model scenarios (regulation, new entrants) and export clean charts for decks.
Customers Bargaining Power

Price transparency
Online listings and comparison tools give buyers near-real-time pricing — over 70% of vehicle shoppers use online listings (Cox Automotive, 2024) — compressing front-end gross and heightening discount pressure on Asbury. Asbury’s digital platform and pricing tools help manage expectations but cannot fully blunt transparency-driven margin erosion. Emphasizing value-added services and extended warranties creates differentiation beyond price and supports higher F&I yields.
Low switching costs
Low switching costs let customers visit multiple local dealers for the same make, with Cox Automotive 2024 reporting roughly 66% of buyers cross-shop dealers; commoditized trims amplify this behavior. Asbury defends via convenience, deeper inventory and faster delivery, while service retention and loyalty programs gradually cut churn by improving repeat service capture.

Used vehicle optionality
Shoppers can pivot between new and used, CPO, or alternative brands, giving buyers leverage when new-car pricing is high. This elasticity increases price sensitivity and negotiation power against dealers. Asbury’s broad used inventory across its network mitigates this by offering choice and quicker availability. High reconditioning standards and warranties help Asbury justify price premiums on certified and inspected used vehicles.

Financing leverage
Buyers increasingly obtain external financing, reducing Asbury’s F&I capture as rate-shopping compresses reserve and product margins; streamlined dealer approvals and bundled value propositions sustain penetration. Macroeconomic shifts amplified bargaining power in 2024 with the Federal Funds rate at 5.25–5.50%, tightening consumer financing costs and negotiation leverage.
- External financing reduces F&I take rates
- Rate-shopping hits reserve/product margins
- Streamlined approvals bolster penetration
- Fed funds 5.25–5.50% in 2024 amplifies buyer leverage
Service and collision choices
Owners can choose independents, national chains, or mobile services, giving customers strong leverage on price and convenience for out-of-warranty work; cost sensitivity rises sharply when dealers are not required. Warranty obligations and manufacturer-certified, complex repairs pull customers back to dealers, moderating that power. Same-day service, mobile pickup/dropoff, and service guarantees often tip decisions toward dealers despite higher prices.
Digital pricing, warranties blunt margin squeeze as 70% shop online
Online pricing transparency (70% of shoppers use listings, Cox Automotive 2024) compresses front-end gross while Asbury’s digital pricing and value-added services (warranties, F&I) mitigate some margin erosion. Low switching costs (66% cross-shop dealers, Cox Automotive 2024) boost buyer leverage; Asbury counters with inventory depth, convenience and service retention. Tight 2024 financing (Fed funds 5.25–5.50%) raises rate-shopping and reduces F&I captures.
| Metric | 2024 value |
|---|---|
| Online shoppers | 70% (Cox Automotive) |
| Cross-shop dealers | 66% (Cox Automotive) |
| Fed funds rate | 5.25–5.50% |
Full Version Awaits
Asbury Automotive Group Porter's Five Forces Analysis
This preview shows the exact Asbury Automotive Group Porter’s Five Forces analysis you'll receive—no placeholders or mockups. The document displayed is the full, professionally formatted file and is ready for immediate download and use upon purchase. You’re viewing the final deliverable; once you buy, you get instant access to this same document. It’s complete, accurate, and ready for your analysis.

Go Beyond the Preview—Access the Full Strategic Report
Asbury Automotive Group faces moderate buyer power, concentrated supplier dynamics, intense dealer rivalry, manageable threat of new entrants, and rising substitute risks from mobility shifts. This snapshot highlights the competitive pressures that influence margins and growth. This brief preview only scratches the surface—unlock the full Porter's Five Forces Analysis for detailed ratings, visuals, and strategic implications.
Suppliers Bargaining Power
OEM concentration
Asbury relies on a limited set of major automakers for new-vehicle supply, branding support and incentive programs, while U.S. light-vehicle market concentration remained high in 2024 with the top three OEMs holding roughly 40% market share, giving OEMs leverage over allocations, model mix and floorplan terms. Warranty reimbursement rates and facility image programs further compress dealer margins; multi-brand diversification reduces but does not remove this dependence.
Allocation and inventory
Production cycles, EV ramp-ups and semiconductor constraints in 2024 left OEMs able to allocate scarce inventory, boosting dealer margins as Cox Automotive reported industry days' supply near 60 days mid-2024; preferred dealers like Asbury often receive allocations tied to compliance and sales performance metrics. Tight supply raised vehicle gross profits but strengthened supplier bargaining power, while normalizing inventories reduce OEM leverage though OEMs retain structural allocation control.
Parts and service inputs
Proprietary OEM and tier-1 parts constrain substitution in warranty work, preserving supplier leverage over Asbury's fixed-ops. Aftermarket parts reduce supplier power on customer-pay jobs, accounting for a modest share of parts revenue. Parts and labor inflation in 2024 tightened fixed-ops margins, with industry parts costs rising mid-single digits. Multi-sourcing and improved inventory management helped contain cost pressure.
F&I and lender networks
Banks, captives, and product administrators materially shape Asbury’s F&I program economics and approvals, with captive lenders retaining leverage when tied to OEM incentives even as lender competition limits absolute power. Rate moves and underwriting shifts—against a 2024 federal funds range near 5.25–5.50%—can quickly reprice F&I penetration and back-end gross. Growing digital e-contracting standards increase switching frictions for dealer-lender relationships.
- Captives retain OEM-linked leverage
- Rate moves (2024 fed funds ~5.25–5.50%) reprice F&I
- Competition tempers supplier power
- e-contracting creates switching frictions
Collision and technology
Collision and technology suppliers exert rising leverage over Asbury as ADAS calibrations and OEM repair protocols force reliance on certified tools, OEM data access, and paid telematics—binding dealers to prescribed inputs; Asbury’s reported 2024 revenue near 12 billion supports scale but not supplier independence.
- Certified tools raise repair costs and margins pressure
- Paint/glass/equipment suppliers occupy niche pricing power
- OEM-gated telematics limits software/update access
Multi-brand dealer faces OEM-driven supplier leverage; top-3 ~40% share
Asbury’s supplier power is elevated by reliance on a handful of OEMs (top 3 ~40% share) and OEM-controlled allocation/brand programs, even as multi-brand scale and $≈12B 2024 revenue provide negotiating leverage. Tight 2024 supply (≈60 days' supply) and certified-tool/telematics mandates increase OEM and collision-supplier leverage; parts inflation (~+4% 2024) and 2024 fed funds near 5.25–5.50% pressure F&I and fixed-ops margins.
| Metric | 2024 value |
|---|---|
| Asbury revenue | $≈12B |
| Top-3 OEM market share | ~40% |
| Industry days' supply (mid-2024) | ≈60 days |
| Parts cost change | ~+4% |
| Federal funds rate (2024) | 5.25–5.50% |
What is included in the product
Detailed Word Document
Provides a tailored Porter's Five Forces analysis for Asbury Automotive Group, uncovering competitive rivalry, buyer and supplier power, threat of new entrants and substitutes, and regulatory/technology disruptions; highlights strategic vulnerabilities and defensive advantages to guide investor and management decisions.
Customizable Excel Spreadsheet
A concise, one-sheet Porter’s Five Forces for Asbury Automotive Group—clearly scores competitive pressures and pinpoints pain points for quick strategic action; editable inputs let you model scenarios (regulation, new entrants) and export clean charts for decks.
Customers Bargaining Power
Price transparency
Online listings and comparison tools give buyers near-real-time pricing — over 70% of vehicle shoppers use online listings (Cox Automotive, 2024) — compressing front-end gross and heightening discount pressure on Asbury. Asbury’s digital platform and pricing tools help manage expectations but cannot fully blunt transparency-driven margin erosion. Emphasizing value-added services and extended warranties creates differentiation beyond price and supports higher F&I yields.
Low switching costs
Low switching costs let customers visit multiple local dealers for the same make, with Cox Automotive 2024 reporting roughly 66% of buyers cross-shop dealers; commoditized trims amplify this behavior. Asbury defends via convenience, deeper inventory and faster delivery, while service retention and loyalty programs gradually cut churn by improving repeat service capture.
Used vehicle optionality
Shoppers can pivot between new and used, CPO, or alternative brands, giving buyers leverage when new-car pricing is high. This elasticity increases price sensitivity and negotiation power against dealers. Asbury’s broad used inventory across its network mitigates this by offering choice and quicker availability. High reconditioning standards and warranties help Asbury justify price premiums on certified and inspected used vehicles.
Financing leverage
Buyers increasingly obtain external financing, reducing Asbury’s F&I capture as rate-shopping compresses reserve and product margins; streamlined dealer approvals and bundled value propositions sustain penetration. Macroeconomic shifts amplified bargaining power in 2024 with the Federal Funds rate at 5.25–5.50%, tightening consumer financing costs and negotiation leverage.
- External financing reduces F&I take rates
- Rate-shopping hits reserve/product margins
- Streamlined approvals bolster penetration
- Fed funds 5.25–5.50% in 2024 amplifies buyer leverage
Service and collision choices
Owners can choose independents, national chains, or mobile services, giving customers strong leverage on price and convenience for out-of-warranty work; cost sensitivity rises sharply when dealers are not required. Warranty obligations and manufacturer-certified, complex repairs pull customers back to dealers, moderating that power. Same-day service, mobile pickup/dropoff, and service guarantees often tip decisions toward dealers despite higher prices.
Digital pricing, warranties blunt margin squeeze as 70% shop online
Online pricing transparency (70% of shoppers use listings, Cox Automotive 2024) compresses front-end gross while Asbury’s digital pricing and value-added services (warranties, F&I) mitigate some margin erosion. Low switching costs (66% cross-shop dealers, Cox Automotive 2024) boost buyer leverage; Asbury counters with inventory depth, convenience and service retention. Tight 2024 financing (Fed funds 5.25–5.50%) raises rate-shopping and reduces F&I captures.
| Metric | 2024 value |
|---|---|
| Online shoppers | 70% (Cox Automotive) |
| Cross-shop dealers | 66% (Cox Automotive) |
| Fed funds rate | 5.25–5.50% |
Full Version Awaits
Asbury Automotive Group Porter's Five Forces Analysis
This preview shows the exact Asbury Automotive Group Porter’s Five Forces analysis you'll receive—no placeholders or mockups. The document displayed is the full, professionally formatted file and is ready for immediate download and use upon purchase. You’re viewing the final deliverable; once you buy, you get instant access to this same document. It’s complete, accurate, and ready for your analysis.
Original: $10.00
-65%$10.00
$3.50Description
Go Beyond the Preview—Access the Full Strategic Report
Asbury Automotive Group faces moderate buyer power, concentrated supplier dynamics, intense dealer rivalry, manageable threat of new entrants, and rising substitute risks from mobility shifts. This snapshot highlights the competitive pressures that influence margins and growth. This brief preview only scratches the surface—unlock the full Porter's Five Forces Analysis for detailed ratings, visuals, and strategic implications.
Suppliers Bargaining Power
OEM concentration
Asbury relies on a limited set of major automakers for new-vehicle supply, branding support and incentive programs, while U.S. light-vehicle market concentration remained high in 2024 with the top three OEMs holding roughly 40% market share, giving OEMs leverage over allocations, model mix and floorplan terms. Warranty reimbursement rates and facility image programs further compress dealer margins; multi-brand diversification reduces but does not remove this dependence.
Allocation and inventory
Production cycles, EV ramp-ups and semiconductor constraints in 2024 left OEMs able to allocate scarce inventory, boosting dealer margins as Cox Automotive reported industry days' supply near 60 days mid-2024; preferred dealers like Asbury often receive allocations tied to compliance and sales performance metrics. Tight supply raised vehicle gross profits but strengthened supplier bargaining power, while normalizing inventories reduce OEM leverage though OEMs retain structural allocation control.
Parts and service inputs
Proprietary OEM and tier-1 parts constrain substitution in warranty work, preserving supplier leverage over Asbury's fixed-ops. Aftermarket parts reduce supplier power on customer-pay jobs, accounting for a modest share of parts revenue. Parts and labor inflation in 2024 tightened fixed-ops margins, with industry parts costs rising mid-single digits. Multi-sourcing and improved inventory management helped contain cost pressure.
F&I and lender networks
Banks, captives, and product administrators materially shape Asbury’s F&I program economics and approvals, with captive lenders retaining leverage when tied to OEM incentives even as lender competition limits absolute power. Rate moves and underwriting shifts—against a 2024 federal funds range near 5.25–5.50%—can quickly reprice F&I penetration and back-end gross. Growing digital e-contracting standards increase switching frictions for dealer-lender relationships.
- Captives retain OEM-linked leverage
- Rate moves (2024 fed funds ~5.25–5.50%) reprice F&I
- Competition tempers supplier power
- e-contracting creates switching frictions
Collision and technology
Collision and technology suppliers exert rising leverage over Asbury as ADAS calibrations and OEM repair protocols force reliance on certified tools, OEM data access, and paid telematics—binding dealers to prescribed inputs; Asbury’s reported 2024 revenue near 12 billion supports scale but not supplier independence.
- Certified tools raise repair costs and margins pressure
- Paint/glass/equipment suppliers occupy niche pricing power
- OEM-gated telematics limits software/update access
Multi-brand dealer faces OEM-driven supplier leverage; top-3 ~40% share
Asbury’s supplier power is elevated by reliance on a handful of OEMs (top 3 ~40% share) and OEM-controlled allocation/brand programs, even as multi-brand scale and $≈12B 2024 revenue provide negotiating leverage. Tight 2024 supply (≈60 days' supply) and certified-tool/telematics mandates increase OEM and collision-supplier leverage; parts inflation (~+4% 2024) and 2024 fed funds near 5.25–5.50% pressure F&I and fixed-ops margins.
| Metric | 2024 value |
|---|---|
| Asbury revenue | $≈12B |
| Top-3 OEM market share | ~40% |
| Industry days' supply (mid-2024) | ≈60 days |
| Parts cost change | ~+4% |
| Federal funds rate (2024) | 5.25–5.50% |
What is included in the product
Detailed Word Document
Provides a tailored Porter's Five Forces analysis for Asbury Automotive Group, uncovering competitive rivalry, buyer and supplier power, threat of new entrants and substitutes, and regulatory/technology disruptions; highlights strategic vulnerabilities and defensive advantages to guide investor and management decisions.
Customizable Excel Spreadsheet
A concise, one-sheet Porter’s Five Forces for Asbury Automotive Group—clearly scores competitive pressures and pinpoints pain points for quick strategic action; editable inputs let you model scenarios (regulation, new entrants) and export clean charts for decks.
Customers Bargaining Power
Price transparency
Online listings and comparison tools give buyers near-real-time pricing — over 70% of vehicle shoppers use online listings (Cox Automotive, 2024) — compressing front-end gross and heightening discount pressure on Asbury. Asbury’s digital platform and pricing tools help manage expectations but cannot fully blunt transparency-driven margin erosion. Emphasizing value-added services and extended warranties creates differentiation beyond price and supports higher F&I yields.
Low switching costs
Low switching costs let customers visit multiple local dealers for the same make, with Cox Automotive 2024 reporting roughly 66% of buyers cross-shop dealers; commoditized trims amplify this behavior. Asbury defends via convenience, deeper inventory and faster delivery, while service retention and loyalty programs gradually cut churn by improving repeat service capture.
Used vehicle optionality
Shoppers can pivot between new and used, CPO, or alternative brands, giving buyers leverage when new-car pricing is high. This elasticity increases price sensitivity and negotiation power against dealers. Asbury’s broad used inventory across its network mitigates this by offering choice and quicker availability. High reconditioning standards and warranties help Asbury justify price premiums on certified and inspected used vehicles.
Financing leverage
Buyers increasingly obtain external financing, reducing Asbury’s F&I capture as rate-shopping compresses reserve and product margins; streamlined dealer approvals and bundled value propositions sustain penetration. Macroeconomic shifts amplified bargaining power in 2024 with the Federal Funds rate at 5.25–5.50%, tightening consumer financing costs and negotiation leverage.
- External financing reduces F&I take rates
- Rate-shopping hits reserve/product margins
- Streamlined approvals bolster penetration
- Fed funds 5.25–5.50% in 2024 amplifies buyer leverage
Service and collision choices
Owners can choose independents, national chains, or mobile services, giving customers strong leverage on price and convenience for out-of-warranty work; cost sensitivity rises sharply when dealers are not required. Warranty obligations and manufacturer-certified, complex repairs pull customers back to dealers, moderating that power. Same-day service, mobile pickup/dropoff, and service guarantees often tip decisions toward dealers despite higher prices.
Digital pricing, warranties blunt margin squeeze as 70% shop online
Online pricing transparency (70% of shoppers use listings, Cox Automotive 2024) compresses front-end gross while Asbury’s digital pricing and value-added services (warranties, F&I) mitigate some margin erosion. Low switching costs (66% cross-shop dealers, Cox Automotive 2024) boost buyer leverage; Asbury counters with inventory depth, convenience and service retention. Tight 2024 financing (Fed funds 5.25–5.50%) raises rate-shopping and reduces F&I captures.
| Metric | 2024 value |
|---|---|
| Online shoppers | 70% (Cox Automotive) |
| Cross-shop dealers | 66% (Cox Automotive) |
| Fed funds rate | 5.25–5.50% |
Full Version Awaits
Asbury Automotive Group Porter's Five Forces Analysis
This preview shows the exact Asbury Automotive Group Porter’s Five Forces analysis you'll receive—no placeholders or mockups. The document displayed is the full, professionally formatted file and is ready for immediate download and use upon purchase. You’re viewing the final deliverable; once you buy, you get instant access to this same document. It’s complete, accurate, and ready for your analysis.











