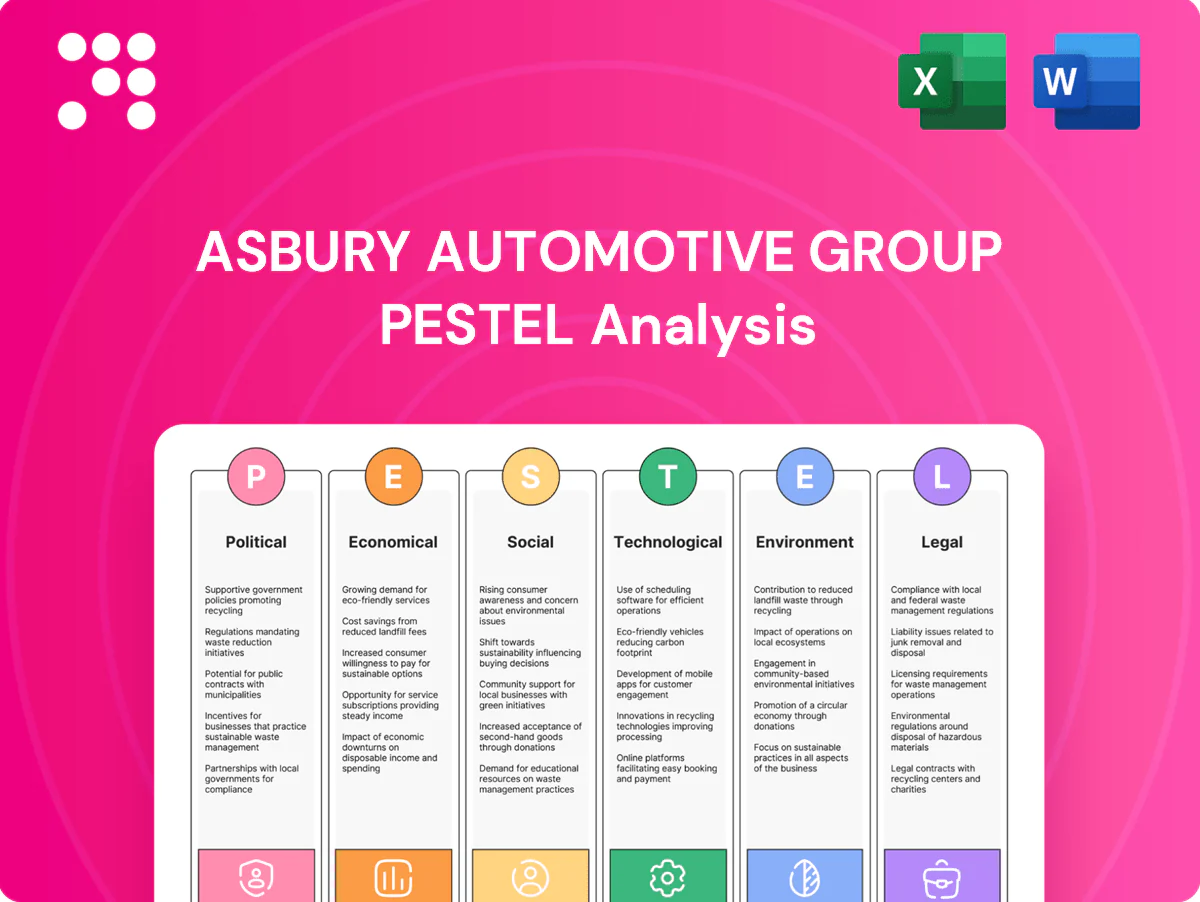
Asbury Automotive Group PESTLE Analysis

Skip the Research. Get the Strategy.
Discover how political, economic, social, technological, legal and environmental forces shape Asbury Automotive Group’s growth and risks. Our concise PESTLE highlights regulatory pressures, market demand shifts, EV and digital disruption, and sustainability risks that matter to investors and executives. Purchase the full report to access detailed scenarios, data-driven insights, and ready-to-use slides for strategy or investment decisions.
Political factors

Franchise dealership policy shifts
State and federal stances on franchise protection—present in roughly 48 states—strongly shape OEM–dealer power dynamics, and any federal push toward agency or direct-to-consumer models could compress dealer margins and inventory control. Moves by manufacturers to test agency models in pilot markets have shrunk dealer gross profit per vehicle in trials by measurable percentage points. Asbury must closely monitor lobbying outcomes, align OEM relationships, and lean on geographic diversification to mitigate adverse policy swings in specific states.
EV incentives and industrial policy
Federal and state EV incentives, including the Inflation Reduction Act credit of up to $7,500, materially shift dealership mix, pricing and turnover by increasing demand for eligible models. IRA domestic-content rules tied to critical minerals and final assembly have reshaped model eligibility and consumer patterns since 2023. Asbury must align inventory, OEM relationships and technician training to incentive-eligible EVs to capture share. Policy volatility can abruptly alter quarter-to-quarter sales composition.

Trade tariffs and import exposure
Tariffs such as Section 301 on Chinese goods (up to 25%) and potential auto duties raise acquisition costs for vehicles, parts and electronics, squeezing parts margins and service profitability. Shifts in US–China tensions or USMCA trade rules (in force since 2020) can alter OEM allocation and model availability, so Asbury’s sourcing and pricing strategies should hedge tariff risk to protect margins and service-cost structures.

Infrastructure and transportation funding
Public investment—including the $7.5 billion EV charging program under the Bipartisan Infrastructure Law and the $5 billion NEVI program—shapes vehicle usage and EV adoption; DOE data show over 150,000 public chargers in the US (mid-2024). Greater charging coverage accelerates EV turnover and service-mix shifts, and Asbury can prioritize sites near growth corridors and charging hubs while aligning capital plans to policy timing.
- Charging funding: $7.5B program
- NEVI: $5B to states
- Public chargers: >150,000 (mid-2024)
- Strategic focus: locations near corridors/charging hubs
- Risk: policy timing affects capex
Healthcare and workforce policy
Rules affecting employer healthcare costs and apprenticeship funding directly influence Asbury Automotive Group labor expenses; employer-sponsored family premiums averaged 23,106 USD and single premiums 7,911 USD in 2024 (Kaiser Family Foundation). Technician and body-shop labor availability is sensitive to immigration policy and vocational support, and wage mandates can compress margins if not offset by productivity gains. Asbury stands to gain from policies strengthening skilled-trades pipelines.
- Healthcare: 2024 family premium 23,106 USD; single 7,911 USD
- Labor supply: dependent on immigration and vocational programs
- Apprenticeships: funding alters short-term labor costs
- Wage mandates: margin pressure without productivity offsets
Franchise laws, OEM pilots and EV policy reshape dealer margins, inventory and service
Franchise laws in ~48 states and OEM pilots of agency/direct models can compress dealer margins and inventory control. EV policy shifts (IRA credit up to 7,500 USD; domestic-content rules since 2023) and public charging funding (7.5B USD; NEVI 5B USD; >150,000 chargers mid-2024) materially change sales mix and service needs. Tariffs (Section 301 up to 25%) and rising healthcare premiums (2024 family 23,106 USD) pressure costs.
| Factor | Key metric |
|---|---|
| Franchise law | ~48 states |
| EV incentives | IRA credit 7,500 USD |
| Charging funding | 7.5B USD; NEVI 5B; >150,000 chargers |
| Tariffs | Up to 25% |
| Healthcare | Family 23,106 USD (2024) |
What is included in the product
 Detailed Word Document
Explores how Political, Economic, Social, Technological, Environmental and Legal forces uniquely affect Asbury Automotive Group, with data-backed trends and region-specific regulatory context to identify threats and opportunities; designed for executives, investors and consultants and delivered in clean, insert-ready format with forward-looking insights for scenario planning.

 Customizable Excel Spreadsheet
A concise, visually segmented PESTLE summary of Asbury Automotive Group that highlights key external risks and opportunities for quick alignment in meetings, editable for local context, easily dropped into presentations, and shareable across teams to streamline strategic planning.
Economic factors

Interest rates and credit availability
Auto demand is highly rate-sensitive across new, used and F&I products; with the federal funds rate near 5.25–5.50% in 2024–25, tighter credit curbed approvals and F&I penetration while easing supports volume and per-vehicle gross. Asbury must adjust finance menus and lender panels through rate cycles to protect sales and margins. Active rate hedging and mix management help stabilize earnings and gross per unit.
Used vehicle supply and residual values
Lease maturities from the large 2019–2022 lease cohorts and consequent auction flows remain primary drivers of used inventory availability and pricing, shaping Asbury’s sourcing cadence in 2024–25.
Volatility in residual values continues to swing trade-in equity and reconditioning economics, compressing gross margins when residuals decline and lifting margins when supply tightens.
Asbury’s omnichannel sourcing and pricing analytics are critical to convert auction, inbound trade and retail opportunities into margin, and tight wholesale supply can boost per-unit margins while constraining volume and F&I penetration.

Labor costs and technician scarcity
Wage inflation and a scarcity of master technicians lift service cost structures for Asbury; Bureau of Labor Statistics reports a median annual wage of $47,070 for automotive service technicians and mechanics (May 2023), underscoring rising labor expenses. Collision centers face parallel pressure from paint, materials, and skilled-labor cost increases. Asbury offsets via higher throughput, flat-rate optimization, training pipelines, and competitive benefits to retain staff in high-demand markets.

Consumer confidence and disposable income
Macro health shapes willingness to buy big-ticket vehicles and accept monthly payments; U.S. unemployment averaged about 3.7% in 2024 and average new-vehicle payments ran near $754/month (Experian 2024), while higher fuel costs (≈$3.50/gal 2024 average, EIA) and timing of tax refunds shift demand and model mix. Asbury should flex promotions and inventory toward value or premium as cycles turn, while service bays provide countercyclical stability and recurring margin.
- Consumer confidence ↔ purchase willingness
- Unemployment 2024 ≈ 3.7%
- Avg new-vehicle payment ≈ $754/mo (2024)
- Avg fuel ≈ $3.50/gal (2024)
- Service revenue = countercyclical cushion
OEM production and supply normalization
OEM production and supply normalization has driven an inventory rebuild, with new-vehicle days' supply rising to about 60 days in 2024 (Cox Automotive), shifting pricing power back to manufacturers and prompting higher incentives that boost volume but compress per-unit gross. Asbury’s turn-rate discipline and allocation negotiations preserve margin capture, while a balanced new/used mix smooths cycle-driven volatility.
- Inventory rebuild: ~60 days supply (2024)
- Higher incentives: lift volume, compress per-unit gross
- Asbury focus: turn-rate discipline, allocation negotiations
- Balanced new/used mix: smooths cycles
Franchise laws, OEM pilots and EV policy reshape dealer margins, inventory and service
Higher rates (fed funds ≈5.25–5.50% 2024–25) and tighter credit suppress approvals and F&I penetration while lifting per-vehicle gross; lease maturities and auction flows drive used supply and pricing. Residual volatility and OEM inventory rebuild (~60 days supply, 2024) swing margins; service revenue and pricing/mix management stabilize earnings. Wage pressure (median tech wage $47,070, May 2023) raises service costs.
| Metric | Value |
|---|---|
| Fed funds | 5.25–5.50% (2024–25) |
| Unemployment | ≈3.7% (2024) |
| Avg new payment | $754/mo (2024) |
| Days' supply | ~60 (2024) |
| Tech wage | $47,070 (May 2023) |
Same Document Delivered
Asbury Automotive Group PESTLE Analysis
The Asbury Automotive Group PESTLE Analysis preview shown here is the exact document you’ll receive after purchase—fully formatted and ready to use. It covers political, economic, social, technological, legal, and environmental factors with data-driven insights and strategic implications. No placeholders or teasers—this is the final, ready-to-download file.

Skip the Research. Get the Strategy.
Discover how political, economic, social, technological, legal and environmental forces shape Asbury Automotive Group’s growth and risks. Our concise PESTLE highlights regulatory pressures, market demand shifts, EV and digital disruption, and sustainability risks that matter to investors and executives. Purchase the full report to access detailed scenarios, data-driven insights, and ready-to-use slides for strategy or investment decisions.
Political factors
Franchise dealership policy shifts
State and federal stances on franchise protection—present in roughly 48 states—strongly shape OEM–dealer power dynamics, and any federal push toward agency or direct-to-consumer models could compress dealer margins and inventory control. Moves by manufacturers to test agency models in pilot markets have shrunk dealer gross profit per vehicle in trials by measurable percentage points. Asbury must closely monitor lobbying outcomes, align OEM relationships, and lean on geographic diversification to mitigate adverse policy swings in specific states.
EV incentives and industrial policy
Federal and state EV incentives, including the Inflation Reduction Act credit of up to $7,500, materially shift dealership mix, pricing and turnover by increasing demand for eligible models. IRA domestic-content rules tied to critical minerals and final assembly have reshaped model eligibility and consumer patterns since 2023. Asbury must align inventory, OEM relationships and technician training to incentive-eligible EVs to capture share. Policy volatility can abruptly alter quarter-to-quarter sales composition.
Trade tariffs and import exposure
Tariffs such as Section 301 on Chinese goods (up to 25%) and potential auto duties raise acquisition costs for vehicles, parts and electronics, squeezing parts margins and service profitability. Shifts in US–China tensions or USMCA trade rules (in force since 2020) can alter OEM allocation and model availability, so Asbury’s sourcing and pricing strategies should hedge tariff risk to protect margins and service-cost structures.
Infrastructure and transportation funding
Public investment—including the $7.5 billion EV charging program under the Bipartisan Infrastructure Law and the $5 billion NEVI program—shapes vehicle usage and EV adoption; DOE data show over 150,000 public chargers in the US (mid-2024). Greater charging coverage accelerates EV turnover and service-mix shifts, and Asbury can prioritize sites near growth corridors and charging hubs while aligning capital plans to policy timing.
- Charging funding: $7.5B program
- NEVI: $5B to states
- Public chargers: >150,000 (mid-2024)
- Strategic focus: locations near corridors/charging hubs
- Risk: policy timing affects capex
Healthcare and workforce policy
Rules affecting employer healthcare costs and apprenticeship funding directly influence Asbury Automotive Group labor expenses; employer-sponsored family premiums averaged 23,106 USD and single premiums 7,911 USD in 2024 (Kaiser Family Foundation). Technician and body-shop labor availability is sensitive to immigration policy and vocational support, and wage mandates can compress margins if not offset by productivity gains. Asbury stands to gain from policies strengthening skilled-trades pipelines.
- Healthcare: 2024 family premium 23,106 USD; single 7,911 USD
- Labor supply: dependent on immigration and vocational programs
- Apprenticeships: funding alters short-term labor costs
- Wage mandates: margin pressure without productivity offsets
Franchise laws, OEM pilots and EV policy reshape dealer margins, inventory and service
Franchise laws in ~48 states and OEM pilots of agency/direct models can compress dealer margins and inventory control. EV policy shifts (IRA credit up to 7,500 USD; domestic-content rules since 2023) and public charging funding (7.5B USD; NEVI 5B USD; >150,000 chargers mid-2024) materially change sales mix and service needs. Tariffs (Section 301 up to 25%) and rising healthcare premiums (2024 family 23,106 USD) pressure costs.
| Factor | Key metric |
|---|---|
| Franchise law | ~48 states |
| EV incentives | IRA credit 7,500 USD |
| Charging funding | 7.5B USD; NEVI 5B; >150,000 chargers |
| Tariffs | Up to 25% |
| Healthcare | Family 23,106 USD (2024) |
What is included in the product
Detailed Word Document
Explores how Political, Economic, Social, Technological, Environmental and Legal forces uniquely affect Asbury Automotive Group, with data-backed trends and region-specific regulatory context to identify threats and opportunities; designed for executives, investors and consultants and delivered in clean, insert-ready format with forward-looking insights for scenario planning.
Customizable Excel Spreadsheet
A concise, visually segmented PESTLE summary of Asbury Automotive Group that highlights key external risks and opportunities for quick alignment in meetings, editable for local context, easily dropped into presentations, and shareable across teams to streamline strategic planning.
Economic factors
Interest rates and credit availability
Auto demand is highly rate-sensitive across new, used and F&I products; with the federal funds rate near 5.25–5.50% in 2024–25, tighter credit curbed approvals and F&I penetration while easing supports volume and per-vehicle gross. Asbury must adjust finance menus and lender panels through rate cycles to protect sales and margins. Active rate hedging and mix management help stabilize earnings and gross per unit.
Used vehicle supply and residual values
Lease maturities from the large 2019–2022 lease cohorts and consequent auction flows remain primary drivers of used inventory availability and pricing, shaping Asbury’s sourcing cadence in 2024–25.
Volatility in residual values continues to swing trade-in equity and reconditioning economics, compressing gross margins when residuals decline and lifting margins when supply tightens.
Asbury’s omnichannel sourcing and pricing analytics are critical to convert auction, inbound trade and retail opportunities into margin, and tight wholesale supply can boost per-unit margins while constraining volume and F&I penetration.
Labor costs and technician scarcity
Wage inflation and a scarcity of master technicians lift service cost structures for Asbury; Bureau of Labor Statistics reports a median annual wage of $47,070 for automotive service technicians and mechanics (May 2023), underscoring rising labor expenses. Collision centers face parallel pressure from paint, materials, and skilled-labor cost increases. Asbury offsets via higher throughput, flat-rate optimization, training pipelines, and competitive benefits to retain staff in high-demand markets.
Consumer confidence and disposable income
Macro health shapes willingness to buy big-ticket vehicles and accept monthly payments; U.S. unemployment averaged about 3.7% in 2024 and average new-vehicle payments ran near $754/month (Experian 2024), while higher fuel costs (≈$3.50/gal 2024 average, EIA) and timing of tax refunds shift demand and model mix. Asbury should flex promotions and inventory toward value or premium as cycles turn, while service bays provide countercyclical stability and recurring margin.
- Consumer confidence ↔ purchase willingness
- Unemployment 2024 ≈ 3.7%
- Avg new-vehicle payment ≈ $754/mo (2024)
- Avg fuel ≈ $3.50/gal (2024)
- Service revenue = countercyclical cushion
OEM production and supply normalization
OEM production and supply normalization has driven an inventory rebuild, with new-vehicle days' supply rising to about 60 days in 2024 (Cox Automotive), shifting pricing power back to manufacturers and prompting higher incentives that boost volume but compress per-unit gross. Asbury’s turn-rate discipline and allocation negotiations preserve margin capture, while a balanced new/used mix smooths cycle-driven volatility.
- Inventory rebuild: ~60 days supply (2024)
- Higher incentives: lift volume, compress per-unit gross
- Asbury focus: turn-rate discipline, allocation negotiations
- Balanced new/used mix: smooths cycles
Franchise laws, OEM pilots and EV policy reshape dealer margins, inventory and service
Higher rates (fed funds ≈5.25–5.50% 2024–25) and tighter credit suppress approvals and F&I penetration while lifting per-vehicle gross; lease maturities and auction flows drive used supply and pricing. Residual volatility and OEM inventory rebuild (~60 days supply, 2024) swing margins; service revenue and pricing/mix management stabilize earnings. Wage pressure (median tech wage $47,070, May 2023) raises service costs.
| Metric | Value |
|---|---|
| Fed funds | 5.25–5.50% (2024–25) |
| Unemployment | ≈3.7% (2024) |
| Avg new payment | $754/mo (2024) |
| Days' supply | ~60 (2024) |
| Tech wage | $47,070 (May 2023) |
Same Document Delivered
Asbury Automotive Group PESTLE Analysis
The Asbury Automotive Group PESTLE Analysis preview shown here is the exact document you’ll receive after purchase—fully formatted and ready to use. It covers political, economic, social, technological, legal, and environmental factors with data-driven insights and strategic implications. No placeholders or teasers—this is the final, ready-to-download file.
Original: $10.00
-65%$10.00
$3.50Description
Skip the Research. Get the Strategy.
Discover how political, economic, social, technological, legal and environmental forces shape Asbury Automotive Group’s growth and risks. Our concise PESTLE highlights regulatory pressures, market demand shifts, EV and digital disruption, and sustainability risks that matter to investors and executives. Purchase the full report to access detailed scenarios, data-driven insights, and ready-to-use slides for strategy or investment decisions.
Political factors
Franchise dealership policy shifts
State and federal stances on franchise protection—present in roughly 48 states—strongly shape OEM–dealer power dynamics, and any federal push toward agency or direct-to-consumer models could compress dealer margins and inventory control. Moves by manufacturers to test agency models in pilot markets have shrunk dealer gross profit per vehicle in trials by measurable percentage points. Asbury must closely monitor lobbying outcomes, align OEM relationships, and lean on geographic diversification to mitigate adverse policy swings in specific states.
EV incentives and industrial policy
Federal and state EV incentives, including the Inflation Reduction Act credit of up to $7,500, materially shift dealership mix, pricing and turnover by increasing demand for eligible models. IRA domestic-content rules tied to critical minerals and final assembly have reshaped model eligibility and consumer patterns since 2023. Asbury must align inventory, OEM relationships and technician training to incentive-eligible EVs to capture share. Policy volatility can abruptly alter quarter-to-quarter sales composition.
Trade tariffs and import exposure
Tariffs such as Section 301 on Chinese goods (up to 25%) and potential auto duties raise acquisition costs for vehicles, parts and electronics, squeezing parts margins and service profitability. Shifts in US–China tensions or USMCA trade rules (in force since 2020) can alter OEM allocation and model availability, so Asbury’s sourcing and pricing strategies should hedge tariff risk to protect margins and service-cost structures.
Infrastructure and transportation funding
Public investment—including the $7.5 billion EV charging program under the Bipartisan Infrastructure Law and the $5 billion NEVI program—shapes vehicle usage and EV adoption; DOE data show over 150,000 public chargers in the US (mid-2024). Greater charging coverage accelerates EV turnover and service-mix shifts, and Asbury can prioritize sites near growth corridors and charging hubs while aligning capital plans to policy timing.
- Charging funding: $7.5B program
- NEVI: $5B to states
- Public chargers: >150,000 (mid-2024)
- Strategic focus: locations near corridors/charging hubs
- Risk: policy timing affects capex
Healthcare and workforce policy
Rules affecting employer healthcare costs and apprenticeship funding directly influence Asbury Automotive Group labor expenses; employer-sponsored family premiums averaged 23,106 USD and single premiums 7,911 USD in 2024 (Kaiser Family Foundation). Technician and body-shop labor availability is sensitive to immigration policy and vocational support, and wage mandates can compress margins if not offset by productivity gains. Asbury stands to gain from policies strengthening skilled-trades pipelines.
- Healthcare: 2024 family premium 23,106 USD; single 7,911 USD
- Labor supply: dependent on immigration and vocational programs
- Apprenticeships: funding alters short-term labor costs
- Wage mandates: margin pressure without productivity offsets
Franchise laws, OEM pilots and EV policy reshape dealer margins, inventory and service
Franchise laws in ~48 states and OEM pilots of agency/direct models can compress dealer margins and inventory control. EV policy shifts (IRA credit up to 7,500 USD; domestic-content rules since 2023) and public charging funding (7.5B USD; NEVI 5B USD; >150,000 chargers mid-2024) materially change sales mix and service needs. Tariffs (Section 301 up to 25%) and rising healthcare premiums (2024 family 23,106 USD) pressure costs.
| Factor | Key metric |
|---|---|
| Franchise law | ~48 states |
| EV incentives | IRA credit 7,500 USD |
| Charging funding | 7.5B USD; NEVI 5B; >150,000 chargers |
| Tariffs | Up to 25% |
| Healthcare | Family 23,106 USD (2024) |
What is included in the product
Detailed Word Document
Explores how Political, Economic, Social, Technological, Environmental and Legal forces uniquely affect Asbury Automotive Group, with data-backed trends and region-specific regulatory context to identify threats and opportunities; designed for executives, investors and consultants and delivered in clean, insert-ready format with forward-looking insights for scenario planning.
Customizable Excel Spreadsheet
A concise, visually segmented PESTLE summary of Asbury Automotive Group that highlights key external risks and opportunities for quick alignment in meetings, editable for local context, easily dropped into presentations, and shareable across teams to streamline strategic planning.
Economic factors
Interest rates and credit availability
Auto demand is highly rate-sensitive across new, used and F&I products; with the federal funds rate near 5.25–5.50% in 2024–25, tighter credit curbed approvals and F&I penetration while easing supports volume and per-vehicle gross. Asbury must adjust finance menus and lender panels through rate cycles to protect sales and margins. Active rate hedging and mix management help stabilize earnings and gross per unit.
Used vehicle supply and residual values
Lease maturities from the large 2019–2022 lease cohorts and consequent auction flows remain primary drivers of used inventory availability and pricing, shaping Asbury’s sourcing cadence in 2024–25.
Volatility in residual values continues to swing trade-in equity and reconditioning economics, compressing gross margins when residuals decline and lifting margins when supply tightens.
Asbury’s omnichannel sourcing and pricing analytics are critical to convert auction, inbound trade and retail opportunities into margin, and tight wholesale supply can boost per-unit margins while constraining volume and F&I penetration.
Labor costs and technician scarcity
Wage inflation and a scarcity of master technicians lift service cost structures for Asbury; Bureau of Labor Statistics reports a median annual wage of $47,070 for automotive service technicians and mechanics (May 2023), underscoring rising labor expenses. Collision centers face parallel pressure from paint, materials, and skilled-labor cost increases. Asbury offsets via higher throughput, flat-rate optimization, training pipelines, and competitive benefits to retain staff in high-demand markets.
Consumer confidence and disposable income
Macro health shapes willingness to buy big-ticket vehicles and accept monthly payments; U.S. unemployment averaged about 3.7% in 2024 and average new-vehicle payments ran near $754/month (Experian 2024), while higher fuel costs (≈$3.50/gal 2024 average, EIA) and timing of tax refunds shift demand and model mix. Asbury should flex promotions and inventory toward value or premium as cycles turn, while service bays provide countercyclical stability and recurring margin.
- Consumer confidence ↔ purchase willingness
- Unemployment 2024 ≈ 3.7%
- Avg new-vehicle payment ≈ $754/mo (2024)
- Avg fuel ≈ $3.50/gal (2024)
- Service revenue = countercyclical cushion
OEM production and supply normalization
OEM production and supply normalization has driven an inventory rebuild, with new-vehicle days' supply rising to about 60 days in 2024 (Cox Automotive), shifting pricing power back to manufacturers and prompting higher incentives that boost volume but compress per-unit gross. Asbury’s turn-rate discipline and allocation negotiations preserve margin capture, while a balanced new/used mix smooths cycle-driven volatility.
- Inventory rebuild: ~60 days supply (2024)
- Higher incentives: lift volume, compress per-unit gross
- Asbury focus: turn-rate discipline, allocation negotiations
- Balanced new/used mix: smooths cycles
Franchise laws, OEM pilots and EV policy reshape dealer margins, inventory and service
Higher rates (fed funds ≈5.25–5.50% 2024–25) and tighter credit suppress approvals and F&I penetration while lifting per-vehicle gross; lease maturities and auction flows drive used supply and pricing. Residual volatility and OEM inventory rebuild (~60 days supply, 2024) swing margins; service revenue and pricing/mix management stabilize earnings. Wage pressure (median tech wage $47,070, May 2023) raises service costs.
| Metric | Value |
|---|---|
| Fed funds | 5.25–5.50% (2024–25) |
| Unemployment | ≈3.7% (2024) |
| Avg new payment | $754/mo (2024) |
| Days' supply | ~60 (2024) |
| Tech wage | $47,070 (May 2023) |
Same Document Delivered
Asbury Automotive Group PESTLE Analysis
The Asbury Automotive Group PESTLE Analysis preview shown here is the exact document you’ll receive after purchase—fully formatted and ready to use. It covers political, economic, social, technological, legal, and environmental factors with data-driven insights and strategic implications. No placeholders or teasers—this is the final, ready-to-download file.











