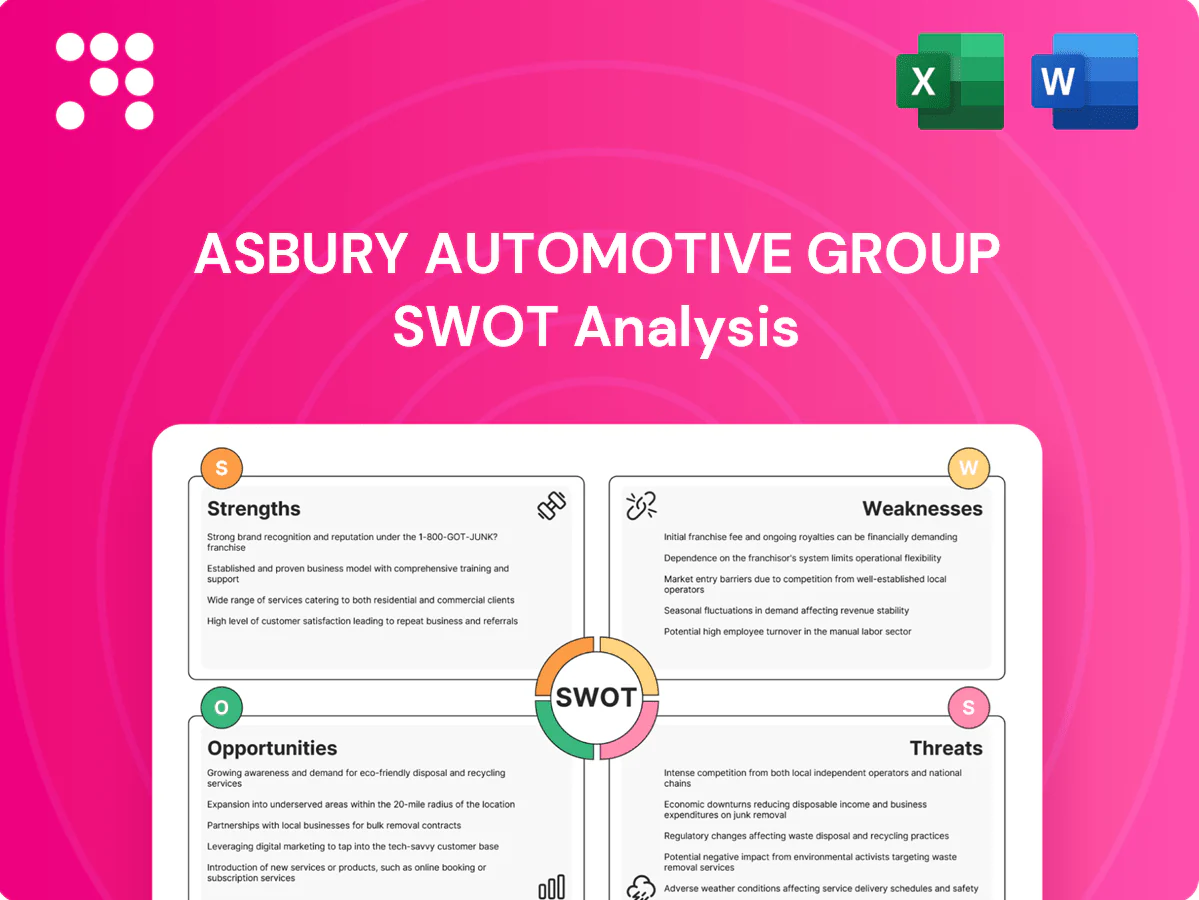
Asbury Automotive Group SWOT Analysis

Your Strategic Toolkit Starts Here
Asbury Automotive Group’s SWOT analysis highlights its scale and digital initiatives, competitive risks, and market opportunities in EV and aftersales services. Discover strategic implications and quantified risks in the full report. Purchase the complete SWOT for an editable, investor-ready Word and Excel package to plan with confidence.
Strengths

Nationwide scale and diversified dealership portfolio
Asbury’s nationwide footprint across multiple states and brands spreads revenue risk across cycles and segments, while scale drives stronger OEM allocations, centralized shared services, and purchasing leverage. Its mix of luxury, mass-market and import/domestic lines mitigates single-brand shocks and boosts customer capture across price points, improving resilience and same-store opportunity.
High-margin parts, service, and collision mix
Service, parts and standalone collision centers provide recurring, higher-margin revenue beyond vehicle sales, a strategic focus Asbury emphasized in its 2024 annual report. These fixed operations stabilize cash flows when new-vehicle volumes soften and reduce revenue cyclicality. Robust service and parts capabilities lift lifetime customer value and retention. They also create direct cross-sell pathways into vehicle sales and F&I products.

Robust F&I capabilities and attachment rates
Asbury’s robust F&I platform provides counter-cyclical, per-unit profit—F&I and other aftersales historically comprise about 35% of retail gross, supporting margins through 2024. Deep lender networks and tight process discipline sustained F&I penetration despite softer retail volumes. Digital menuing and compliance tooling raised consistency and yields, boosting total gross per retail unit and overall resilience.

Omnichannel retail with online platform
Asbury’s omnichannel platform extends reach and reduces buying friction, improving lead conversion and accelerating sales; digital retail represented about 12% of retail transactions in 2024 and raised gross per unit. Integrated pricing, appraisal, financing and delivery meet evolving consumer preferences and shorten sales cycles. Omnichannel data boosts personalization and inventory turn while lowering customer acquisition costs.
- Reach: expands market beyond physical footprints
- Conversion: higher lead-to-sale rates via digital tools
- Efficiency: faster inventory turns, lower CAC
- Customer: integrated end-to-end buying experience
M&A execution and integration track record
Asbury’s disciplined acquisition strategy and proven integration playbooks for systems, talent, and brand transitions consistently shorten payback timelines and improve synergy capture, driving recurring procurement and marketing efficiencies that scale with each deal.
- Integration playbooks: repeatable processes
- Procurement leverage: lower unit costs
- Marketing scale: improved ROAS
- Compounding scale: long-term share gains
Multi-brand footprint, centralized services and omnichannel retail boost resilient margins
Asbury’s nationwide multi-brand footprint spreads revenue risk and drives OEM allocations, centralized services, and purchasing leverage.
Robust service, parts and collision ops plus F&I (about 35% of retail gross) provide recurring, higher-margin cash flow and cushion sales cyclicality.
Omnichannel reach (digital retail ~12% of retail in 2024) improves conversion, inventory turn and lowers CAC, amplified by repeatable acquisition integration playbooks.
| Metric | Value (2024) |
|---|---|
| F&I & aftersales % of retail gross | ~35% |
| Digital retail share | ~12% |
What is included in the product
 Detailed Word Document
Delivers a strategic overview of Asbury Automotive Group’s internal and external business factors, outlining strengths, weaknesses, opportunities and threats to assess competitive position, growth drivers, operational gaps and market risks.

 Customizable Excel Spreadsheet
Provides a concise, visual SWOT of Asbury Automotive Group to speed strategic alignment and stakeholder updates; editable format enables quick updates to reflect market shifts and dealer network priorities.
Weaknesses

Exposure to cyclical auto demand
Asbury earnings are exposed to cyclical auto demand: US light‑vehicle SAAR fell from about 17.0M in 2021 to ~15.0M in 2023 and averaged ~14.8M in 2024, while average new auto loan rates rose above 7%–8% in 2024; downturns compress volumes and gross per unit, and despite fixed‑ops revenue, earnings and cash flow remain tied to SAAR swings, reducing predictability.
Dependence on OEM relationships and allocations
Dependence on OEM relationships and allocations leaves Asbury (NYSE: ABG) exposed: inventory mix, incentives and throughput hinge on manufacturer policies and supply, with FY2024 revenue of $16.6B amplifying the impact. Shifts in OEM strategies or facility requirements can raise costs and capital needs. Limited control over allocations can cap growth in tight supply markets, and complex OEM incentives add execution risk.

Margin pressure in competitive marketplaces
Pricing transparency and aggressive peers compress front-end gross, while competing with national consolidators and digital natives raises acquisition and marketing costs, pressuring margins. Used-vehicle volatility — Manheim’s index fell roughly 30% from the 2021 peak through 2023 — increases reconditioning and appraisal risk. Sustaining per-unit economics requires continual process excellence and tighter cost controls.

Talent intensity and technician shortages
Service capacity at Asbury depends heavily on skilled technicians, an industry-wide shortage that constrains throughput and service bay utilization. Wage inflation and rising training/certification costs compress fixed-ops margins and require higher per-unit service pricing or lower profitability. High turnover further disrupts customer experience and operational consistency, forcing continuous investment in recruiting and upskilling.
- Dependence on scarce skilled techs
- Wage and training cost pressure on margins
- Turnover reduces throughput and CX
- Continuous investment needed for pipelines/certifications
Integration complexity from acquisitions
Frequent M&A adds systems, cultural and compliance complexity for Asbury, and integration missteps can dilute expected synergies while distracting senior management. Legacy IT stacks and data harmonization often lengthen timelines and raise costs, and wide variability across acquired stores challenges operational standardization and customer experience consistency.
- Integration complexity
- Synergy dilution risk
- IT/data harmonization delays
- Store variability hinders standardization
Auto retail cyclical: SAAR ~14.8M, loan rates > 7-8% squeeze margins
Asbury earnings remain cyclical, tied to SAAR swings (avg ~14.8M in 2024) and higher finance costs (avg new loan rates >7–8% in 2024), reducing predictability. Heavy OEM dependence and FY2024 revenue of $16.6B amplify allocation and incentive risk. Competitive pricing and a ~30% drop in Manheim values (2021–23) squeeze front‑end gross. Technician shortages, wage inflation and frequent M&A raise integration and fixed‑ops cost pressure.
| Metric | Value |
|---|---|
| FY2024 revenue | $16.6B |
| 2024 SAAR | ~14.8M |
| Avg new loan rate 2024 | >7–8% |
| Manheim index change | ~-30% (2021–23) |
| Operational risks | Tech shortage, M&A integration |
Full Version Awaits
Asbury Automotive Group SWOT Analysis
This is the actual Asbury Automotive Group SWOT analysis document you’ll receive upon purchase—no surprises, just professional quality. The preview below is taken directly from the full report you'll get, and the complete, editable version is unlocked after payment. Buy now to download the entire detailed file immediately.

Your Strategic Toolkit Starts Here
Asbury Automotive Group’s SWOT analysis highlights its scale and digital initiatives, competitive risks, and market opportunities in EV and aftersales services. Discover strategic implications and quantified risks in the full report. Purchase the complete SWOT for an editable, investor-ready Word and Excel package to plan with confidence.
Strengths
Nationwide scale and diversified dealership portfolio
Asbury’s nationwide footprint across multiple states and brands spreads revenue risk across cycles and segments, while scale drives stronger OEM allocations, centralized shared services, and purchasing leverage. Its mix of luxury, mass-market and import/domestic lines mitigates single-brand shocks and boosts customer capture across price points, improving resilience and same-store opportunity.
High-margin parts, service, and collision mix
Service, parts and standalone collision centers provide recurring, higher-margin revenue beyond vehicle sales, a strategic focus Asbury emphasized in its 2024 annual report. These fixed operations stabilize cash flows when new-vehicle volumes soften and reduce revenue cyclicality. Robust service and parts capabilities lift lifetime customer value and retention. They also create direct cross-sell pathways into vehicle sales and F&I products.
Robust F&I capabilities and attachment rates
Asbury’s robust F&I platform provides counter-cyclical, per-unit profit—F&I and other aftersales historically comprise about 35% of retail gross, supporting margins through 2024. Deep lender networks and tight process discipline sustained F&I penetration despite softer retail volumes. Digital menuing and compliance tooling raised consistency and yields, boosting total gross per retail unit and overall resilience.
Omnichannel retail with online platform
Asbury’s omnichannel platform extends reach and reduces buying friction, improving lead conversion and accelerating sales; digital retail represented about 12% of retail transactions in 2024 and raised gross per unit. Integrated pricing, appraisal, financing and delivery meet evolving consumer preferences and shorten sales cycles. Omnichannel data boosts personalization and inventory turn while lowering customer acquisition costs.
- Reach: expands market beyond physical footprints
- Conversion: higher lead-to-sale rates via digital tools
- Efficiency: faster inventory turns, lower CAC
- Customer: integrated end-to-end buying experience
M&A execution and integration track record
Asbury’s disciplined acquisition strategy and proven integration playbooks for systems, talent, and brand transitions consistently shorten payback timelines and improve synergy capture, driving recurring procurement and marketing efficiencies that scale with each deal.
- Integration playbooks: repeatable processes
- Procurement leverage: lower unit costs
- Marketing scale: improved ROAS
- Compounding scale: long-term share gains
Multi-brand footprint, centralized services and omnichannel retail boost resilient margins
Asbury’s nationwide multi-brand footprint spreads revenue risk and drives OEM allocations, centralized services, and purchasing leverage.
Robust service, parts and collision ops plus F&I (about 35% of retail gross) provide recurring, higher-margin cash flow and cushion sales cyclicality.
Omnichannel reach (digital retail ~12% of retail in 2024) improves conversion, inventory turn and lowers CAC, amplified by repeatable acquisition integration playbooks.
| Metric | Value (2024) |
|---|---|
| F&I & aftersales % of retail gross | ~35% |
| Digital retail share | ~12% |
What is included in the product
Detailed Word Document
Delivers a strategic overview of Asbury Automotive Group’s internal and external business factors, outlining strengths, weaknesses, opportunities and threats to assess competitive position, growth drivers, operational gaps and market risks.
Customizable Excel Spreadsheet
Provides a concise, visual SWOT of Asbury Automotive Group to speed strategic alignment and stakeholder updates; editable format enables quick updates to reflect market shifts and dealer network priorities.
Weaknesses
Exposure to cyclical auto demand
Asbury earnings are exposed to cyclical auto demand: US light‑vehicle SAAR fell from about 17.0M in 2021 to ~15.0M in 2023 and averaged ~14.8M in 2024, while average new auto loan rates rose above 7%–8% in 2024; downturns compress volumes and gross per unit, and despite fixed‑ops revenue, earnings and cash flow remain tied to SAAR swings, reducing predictability.
Dependence on OEM relationships and allocations
Dependence on OEM relationships and allocations leaves Asbury (NYSE: ABG) exposed: inventory mix, incentives and throughput hinge on manufacturer policies and supply, with FY2024 revenue of $16.6B amplifying the impact. Shifts in OEM strategies or facility requirements can raise costs and capital needs. Limited control over allocations can cap growth in tight supply markets, and complex OEM incentives add execution risk.
Margin pressure in competitive marketplaces
Pricing transparency and aggressive peers compress front-end gross, while competing with national consolidators and digital natives raises acquisition and marketing costs, pressuring margins. Used-vehicle volatility — Manheim’s index fell roughly 30% from the 2021 peak through 2023 — increases reconditioning and appraisal risk. Sustaining per-unit economics requires continual process excellence and tighter cost controls.
Talent intensity and technician shortages
Service capacity at Asbury depends heavily on skilled technicians, an industry-wide shortage that constrains throughput and service bay utilization. Wage inflation and rising training/certification costs compress fixed-ops margins and require higher per-unit service pricing or lower profitability. High turnover further disrupts customer experience and operational consistency, forcing continuous investment in recruiting and upskilling.
- Dependence on scarce skilled techs
- Wage and training cost pressure on margins
- Turnover reduces throughput and CX
- Continuous investment needed for pipelines/certifications
Integration complexity from acquisitions
Frequent M&A adds systems, cultural and compliance complexity for Asbury, and integration missteps can dilute expected synergies while distracting senior management. Legacy IT stacks and data harmonization often lengthen timelines and raise costs, and wide variability across acquired stores challenges operational standardization and customer experience consistency.
- Integration complexity
- Synergy dilution risk
- IT/data harmonization delays
- Store variability hinders standardization
Auto retail cyclical: SAAR ~14.8M, loan rates > 7-8% squeeze margins
Asbury earnings remain cyclical, tied to SAAR swings (avg ~14.8M in 2024) and higher finance costs (avg new loan rates >7–8% in 2024), reducing predictability. Heavy OEM dependence and FY2024 revenue of $16.6B amplify allocation and incentive risk. Competitive pricing and a ~30% drop in Manheim values (2021–23) squeeze front‑end gross. Technician shortages, wage inflation and frequent M&A raise integration and fixed‑ops cost pressure.
| Metric | Value |
|---|---|
| FY2024 revenue | $16.6B |
| 2024 SAAR | ~14.8M |
| Avg new loan rate 2024 | >7–8% |
| Manheim index change | ~-30% (2021–23) |
| Operational risks | Tech shortage, M&A integration |
Full Version Awaits
Asbury Automotive Group SWOT Analysis
This is the actual Asbury Automotive Group SWOT analysis document you’ll receive upon purchase—no surprises, just professional quality. The preview below is taken directly from the full report you'll get, and the complete, editable version is unlocked after payment. Buy now to download the entire detailed file immediately.
Original: $10.00
-65%$10.00
$3.50Description
Your Strategic Toolkit Starts Here
Asbury Automotive Group’s SWOT analysis highlights its scale and digital initiatives, competitive risks, and market opportunities in EV and aftersales services. Discover strategic implications and quantified risks in the full report. Purchase the complete SWOT for an editable, investor-ready Word and Excel package to plan with confidence.
Strengths
Nationwide scale and diversified dealership portfolio
Asbury’s nationwide footprint across multiple states and brands spreads revenue risk across cycles and segments, while scale drives stronger OEM allocations, centralized shared services, and purchasing leverage. Its mix of luxury, mass-market and import/domestic lines mitigates single-brand shocks and boosts customer capture across price points, improving resilience and same-store opportunity.
High-margin parts, service, and collision mix
Service, parts and standalone collision centers provide recurring, higher-margin revenue beyond vehicle sales, a strategic focus Asbury emphasized in its 2024 annual report. These fixed operations stabilize cash flows when new-vehicle volumes soften and reduce revenue cyclicality. Robust service and parts capabilities lift lifetime customer value and retention. They also create direct cross-sell pathways into vehicle sales and F&I products.
Robust F&I capabilities and attachment rates
Asbury’s robust F&I platform provides counter-cyclical, per-unit profit—F&I and other aftersales historically comprise about 35% of retail gross, supporting margins through 2024. Deep lender networks and tight process discipline sustained F&I penetration despite softer retail volumes. Digital menuing and compliance tooling raised consistency and yields, boosting total gross per retail unit and overall resilience.
Omnichannel retail with online platform
Asbury’s omnichannel platform extends reach and reduces buying friction, improving lead conversion and accelerating sales; digital retail represented about 12% of retail transactions in 2024 and raised gross per unit. Integrated pricing, appraisal, financing and delivery meet evolving consumer preferences and shorten sales cycles. Omnichannel data boosts personalization and inventory turn while lowering customer acquisition costs.
- Reach: expands market beyond physical footprints
- Conversion: higher lead-to-sale rates via digital tools
- Efficiency: faster inventory turns, lower CAC
- Customer: integrated end-to-end buying experience
M&A execution and integration track record
Asbury’s disciplined acquisition strategy and proven integration playbooks for systems, talent, and brand transitions consistently shorten payback timelines and improve synergy capture, driving recurring procurement and marketing efficiencies that scale with each deal.
- Integration playbooks: repeatable processes
- Procurement leverage: lower unit costs
- Marketing scale: improved ROAS
- Compounding scale: long-term share gains
Multi-brand footprint, centralized services and omnichannel retail boost resilient margins
Asbury’s nationwide multi-brand footprint spreads revenue risk and drives OEM allocations, centralized services, and purchasing leverage.
Robust service, parts and collision ops plus F&I (about 35% of retail gross) provide recurring, higher-margin cash flow and cushion sales cyclicality.
Omnichannel reach (digital retail ~12% of retail in 2024) improves conversion, inventory turn and lowers CAC, amplified by repeatable acquisition integration playbooks.
| Metric | Value (2024) |
|---|---|
| F&I & aftersales % of retail gross | ~35% |
| Digital retail share | ~12% |
What is included in the product
Detailed Word Document
Delivers a strategic overview of Asbury Automotive Group’s internal and external business factors, outlining strengths, weaknesses, opportunities and threats to assess competitive position, growth drivers, operational gaps and market risks.
Customizable Excel Spreadsheet
Provides a concise, visual SWOT of Asbury Automotive Group to speed strategic alignment and stakeholder updates; editable format enables quick updates to reflect market shifts and dealer network priorities.
Weaknesses
Exposure to cyclical auto demand
Asbury earnings are exposed to cyclical auto demand: US light‑vehicle SAAR fell from about 17.0M in 2021 to ~15.0M in 2023 and averaged ~14.8M in 2024, while average new auto loan rates rose above 7%–8% in 2024; downturns compress volumes and gross per unit, and despite fixed‑ops revenue, earnings and cash flow remain tied to SAAR swings, reducing predictability.
Dependence on OEM relationships and allocations
Dependence on OEM relationships and allocations leaves Asbury (NYSE: ABG) exposed: inventory mix, incentives and throughput hinge on manufacturer policies and supply, with FY2024 revenue of $16.6B amplifying the impact. Shifts in OEM strategies or facility requirements can raise costs and capital needs. Limited control over allocations can cap growth in tight supply markets, and complex OEM incentives add execution risk.
Margin pressure in competitive marketplaces
Pricing transparency and aggressive peers compress front-end gross, while competing with national consolidators and digital natives raises acquisition and marketing costs, pressuring margins. Used-vehicle volatility — Manheim’s index fell roughly 30% from the 2021 peak through 2023 — increases reconditioning and appraisal risk. Sustaining per-unit economics requires continual process excellence and tighter cost controls.
Talent intensity and technician shortages
Service capacity at Asbury depends heavily on skilled technicians, an industry-wide shortage that constrains throughput and service bay utilization. Wage inflation and rising training/certification costs compress fixed-ops margins and require higher per-unit service pricing or lower profitability. High turnover further disrupts customer experience and operational consistency, forcing continuous investment in recruiting and upskilling.
- Dependence on scarce skilled techs
- Wage and training cost pressure on margins
- Turnover reduces throughput and CX
- Continuous investment needed for pipelines/certifications
Integration complexity from acquisitions
Frequent M&A adds systems, cultural and compliance complexity for Asbury, and integration missteps can dilute expected synergies while distracting senior management. Legacy IT stacks and data harmonization often lengthen timelines and raise costs, and wide variability across acquired stores challenges operational standardization and customer experience consistency.
- Integration complexity
- Synergy dilution risk
- IT/data harmonization delays
- Store variability hinders standardization
Auto retail cyclical: SAAR ~14.8M, loan rates > 7-8% squeeze margins
Asbury earnings remain cyclical, tied to SAAR swings (avg ~14.8M in 2024) and higher finance costs (avg new loan rates >7–8% in 2024), reducing predictability. Heavy OEM dependence and FY2024 revenue of $16.6B amplify allocation and incentive risk. Competitive pricing and a ~30% drop in Manheim values (2021–23) squeeze front‑end gross. Technician shortages, wage inflation and frequent M&A raise integration and fixed‑ops cost pressure.
| Metric | Value |
|---|---|
| FY2024 revenue | $16.6B |
| 2024 SAAR | ~14.8M |
| Avg new loan rate 2024 | >7–8% |
| Manheim index change | ~-30% (2021–23) |
| Operational risks | Tech shortage, M&A integration |
Full Version Awaits
Asbury Automotive Group SWOT Analysis
This is the actual Asbury Automotive Group SWOT analysis document you’ll receive upon purchase—no surprises, just professional quality. The preview below is taken directly from the full report you'll get, and the complete, editable version is unlocked after payment. Buy now to download the entire detailed file immediately.











