Ashford Boston Consulting Group Matrix

Visual. Strategic. Downloadable.
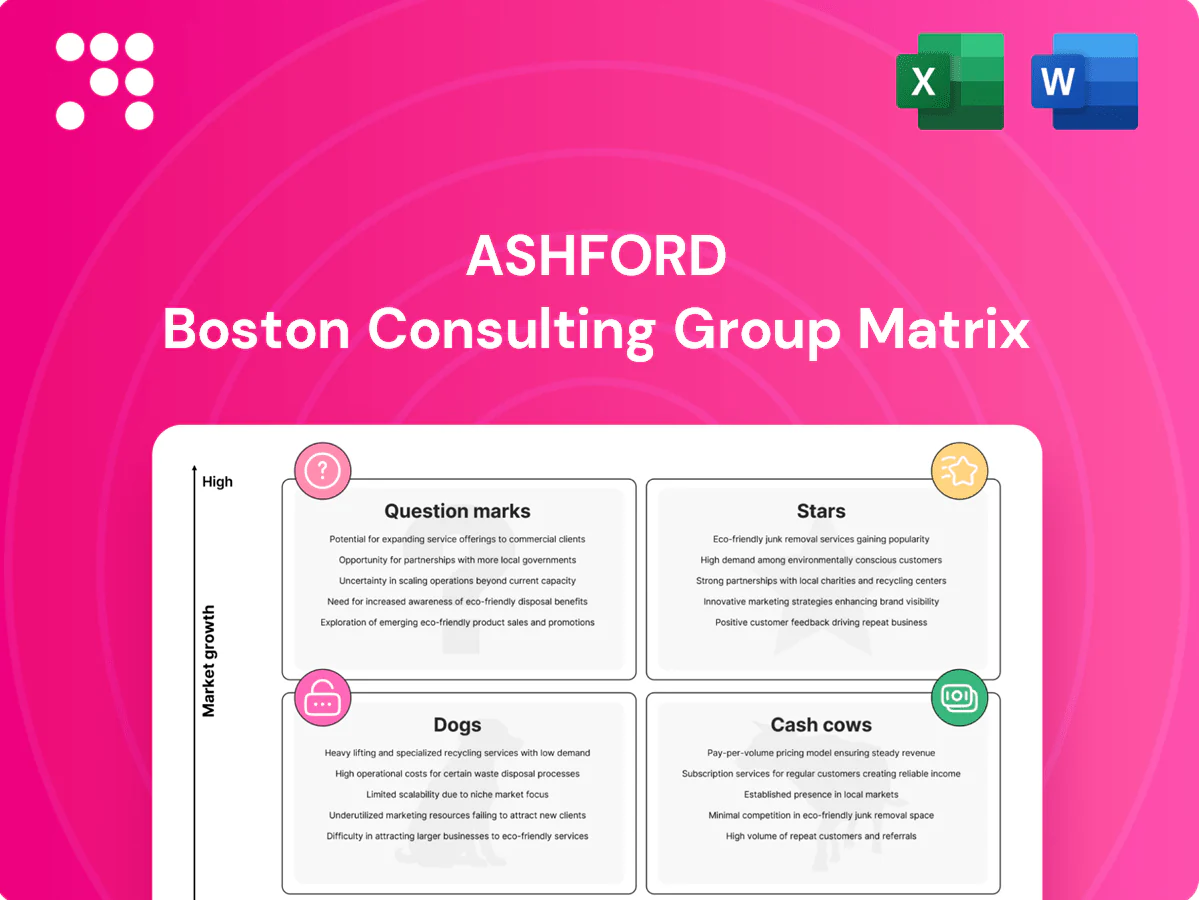
Curious where Ashford’s products sit—Stars, Cash Cows, Dogs, or Question Marks? This snapshot hints at opportunity and risk, but the full Ashford BCG Matrix lays out precise quadrant placements, revenue context, and clear, actionable moves. Buy the complete report for a ready-to-use Word summary and an Excel dashboard that lets you reassign capital and prioritize growth with confidence. Skip the guesswork—get the full analysis and start steering strategy today.
Stars

Flagship REIT advisory mandates
Flagship REIT advisory mandates are crown jewels: large, highly visible engagements in expanding luxury and resort niches, driving strong market share through sticky, performance-based relationships. Recovery in luxury hospitality since 2022 has increased fee pools, making these mandates high-growth Stars. Continued investment in senior talent and advanced analytics will scale them into even larger fee engines.
Hotel asset optimization platform
Hotel asset optimization platform lifts RevPAR 3–7% via dynamic revenue management, trims labor costs 2–5% through productivity tools, and drives capex ROI with typical paybacks of 12–24 months that directly raise NOI. Portfolio-wide adoption creates scale and a leadership edge, while results largely self-fund ongoing rollout. Incremental investment remains necessary to sustain rollout and support.

Performance fee structures tied to NOI/RevPAR
Performance fee structures tied to NOI/RevPAR create snowballing aligned incentives: when hotels outperform, incentive fees stack on top of base fees, often increasing total fee take by roughly 20–30% in outperformance years. STR reported mid-single-digit RevPAR growth in 2024, supporting outsized incentive pay as markets recover. This drives high growth and is competitively defensible if contracts remain clean and transparent to sustain market share.

Resort and lifestyle segment focus
Leisure-led resort and lifestyle assets continue to outpace broader lodging, delivering higher pricing power and ancillary spend; STR reported resort RevPAR exceeded total U.S. lodging by about 12% in 2024, supporting stronger EBITDA margins. Ashford’s operational know-how and portfolio management give it a leadership perch, with growth running above industry averages and attracting new mandates. The firm should double down while the cycle still has room.
- Tag: RevPAR +12% vs total U.S. lodging (2024, STR)
- Tag: Higher ancillary spend and pricing power
- Tag: Ashford leadership in resort/lifestyle operations
- Tag: Growth above industry averages; new mandates accelerating
Capital allocation and transaction advisory
In 2024 repositionings, brand conversions and selective dispositions are creating visible value; Ashford’s transaction pipeline remains active and the firm consistently sits at the table. High growth, high influence and high share with existing clients demand maintained speed and diligence to stay first call.
- Repositionings drive NOI uplift
- Brand conversions enhance RevPAR
- Selective dispositions free capital
- Speed + diligence = top-of-mind advisor
Flagship REITs: RevPAR +12% fuels fees; ops lift 3-7%, payback 12-24 mo
Flagship REIT mandates and resort advisory are Stars: RevPAR +12% vs total U.S. lodging (2024, STR), driving fee pools and market share. Asset optimization lifts RevPAR 3–7% and trims labor 2–5%, with capex paybacks 12–24 months. Performance fees add ~20–30% in outperformance years, creating scalable, high-growth, self-funding engines.
| Metric | 2024 | Impact |
|---|---|---|
| RevPAR vs US | +12% (STR) | Higher fees |
| Platform RevPAR lift | 3–7% | NOI uplift |
| Incentive uplift | 20–30% | Fee growth |
| Payback | 12–24 mo | Capex ROI |
What is included in the product
 Detailed Word Document
Comprehensive BCG Matrix review of Ashford’s units, identifying Stars, Cash Cows, Question Marks, Dogs with investment and divestment guidance.

 Customizable Excel Spreadsheet
One-page Ashford BCG Matrix that spots portfolio gaps and clarifies resource shifts for faster, C-level decisions.
Cash Cows

Long-term base advisory fees
Long-term base advisory fees deliver recurring, contract-based revenue with low churn, forming Ashford’s cash-cow core and enabling predictable cash flow. Mature services are efficient to service, and margins rise with scale and shared services as fixed costs are spread. Maintaining service quality allows management to consistently milk this stream while funding growth elsewhere.
Property-level asset management retainers
Property-level asset management retainers deliver standardized oversight and reporting across stabilized hotels, driving predictable revenue; in 2024 similar management services showed industry EBITDA margins around 30% and steadier cash flow. Low incremental cost per asset once the playbook is set (often under $10k incremental annual cost) supports modest growth of roughly 3–5% CAGR. Invest just enough—about 1% of asset revenue—to keep retention high and protect margins.

Centralized procurement and vendor programs
Centralized procurement and vendor programs drive volume buying that lowers unit hotel costs and generates steady low-single-digit rebates and fee income; Ashford’s scale in 2024 helps protect market share in this mature procurement market. Cash conversion remains strong, with procurement-led working capital improvements shortening payment cycles. Focus on tightening compliance and renegotiating payment terms to widen the spread and boost free cash flow.

Corporate services platform fees
Corporate services platform fees
Shared accounting, treasury and tax functions are billed as platform fees, driving predictable cash flows and low churn; usage remained stable in 2024 as clients favored bundled back-office support. Deloitte 2024 benchmarks show shared‑services efficiency gains of 20–30%, which flow largely to EBITDA when processes are tight; strict scope control prevents margin dilution.- Stable recurring fees
- Low marketing spend, high ROI
- 20–30% efficiency uplift (Deloitte 2024)
- Enforce scope discipline
Benchmarking and reporting suites
Benchmarking and reporting suites deliver monthly portfolio dashboards and KPI packs relied on by clients; as a mature Ashford cash cow they show low growth but churn below the 2024 SaaS median (≈5%), driving predictable recurring revenue. High perceived value versus delivery cost keeps margins healthy, and continuous minor upgrades sustain stickiness and upsell pathways.
- Monthly delivery: core product
- Churn: below 2024 SaaS median ≈5%
- Margin: high due to low delivery cost
- Retention: sticky via continuous minor upgrades
Retainer model: 25–35% EBITDA, <5% churn, 3–5% CAGR
Long-term advisory fees and platform retainer services form Ashford’s cash cows, yielding recurring EBITDA margins ~25–35% in 2024, low churn (<5%) and 3–5% organic CAGR. Centralized procurement and shared services add low-single-digit rebate income and 20–30% efficiency gains (Deloitte 2024), improving FCF conversion.
| Metric | 2024 |
|---|---|
| EBITDA margin | 25–35% |
| Churn | <5% |
| CAGR | 3–5% |
| Efficiency uplift | 20–30% |
What You See Is What You Get
Ashford BCG Matrix
The Ashford BCG Matrix you're previewing is the exact file you'll receive after purchase. No watermarks, no placeholders—just the fully formatted, analysis-ready report built for clarity. Delivered immediately to your inbox, it's editable, printable, and presentation-ready. Crafted by strategy pros, it slots straight into your planning, pitch decks, or client work with zero fuss.

Visual. Strategic. Downloadable.
Curious where Ashford’s products sit—Stars, Cash Cows, Dogs, or Question Marks? This snapshot hints at opportunity and risk, but the full Ashford BCG Matrix lays out precise quadrant placements, revenue context, and clear, actionable moves. Buy the complete report for a ready-to-use Word summary and an Excel dashboard that lets you reassign capital and prioritize growth with confidence. Skip the guesswork—get the full analysis and start steering strategy today.
Stars
Flagship REIT advisory mandates
Flagship REIT advisory mandates are crown jewels: large, highly visible engagements in expanding luxury and resort niches, driving strong market share through sticky, performance-based relationships. Recovery in luxury hospitality since 2022 has increased fee pools, making these mandates high-growth Stars. Continued investment in senior talent and advanced analytics will scale them into even larger fee engines.
Hotel asset optimization platform
Hotel asset optimization platform lifts RevPAR 3–7% via dynamic revenue management, trims labor costs 2–5% through productivity tools, and drives capex ROI with typical paybacks of 12–24 months that directly raise NOI. Portfolio-wide adoption creates scale and a leadership edge, while results largely self-fund ongoing rollout. Incremental investment remains necessary to sustain rollout and support.
Performance fee structures tied to NOI/RevPAR
Performance fee structures tied to NOI/RevPAR create snowballing aligned incentives: when hotels outperform, incentive fees stack on top of base fees, often increasing total fee take by roughly 20–30% in outperformance years. STR reported mid-single-digit RevPAR growth in 2024, supporting outsized incentive pay as markets recover. This drives high growth and is competitively defensible if contracts remain clean and transparent to sustain market share.
Resort and lifestyle segment focus
Leisure-led resort and lifestyle assets continue to outpace broader lodging, delivering higher pricing power and ancillary spend; STR reported resort RevPAR exceeded total U.S. lodging by about 12% in 2024, supporting stronger EBITDA margins. Ashford’s operational know-how and portfolio management give it a leadership perch, with growth running above industry averages and attracting new mandates. The firm should double down while the cycle still has room.
- Tag: RevPAR +12% vs total U.S. lodging (2024, STR)
- Tag: Higher ancillary spend and pricing power
- Tag: Ashford leadership in resort/lifestyle operations
- Tag: Growth above industry averages; new mandates accelerating
Capital allocation and transaction advisory
In 2024 repositionings, brand conversions and selective dispositions are creating visible value; Ashford’s transaction pipeline remains active and the firm consistently sits at the table. High growth, high influence and high share with existing clients demand maintained speed and diligence to stay first call.
- Repositionings drive NOI uplift
- Brand conversions enhance RevPAR
- Selective dispositions free capital
- Speed + diligence = top-of-mind advisor
Flagship REITs: RevPAR +12% fuels fees; ops lift 3-7%, payback 12-24 mo
Flagship REIT mandates and resort advisory are Stars: RevPAR +12% vs total U.S. lodging (2024, STR), driving fee pools and market share. Asset optimization lifts RevPAR 3–7% and trims labor 2–5%, with capex paybacks 12–24 months. Performance fees add ~20–30% in outperformance years, creating scalable, high-growth, self-funding engines.
| Metric | 2024 | Impact |
|---|---|---|
| RevPAR vs US | +12% (STR) | Higher fees |
| Platform RevPAR lift | 3–7% | NOI uplift |
| Incentive uplift | 20–30% | Fee growth |
| Payback | 12–24 mo | Capex ROI |
What is included in the product
Detailed Word Document
Comprehensive BCG Matrix review of Ashford’s units, identifying Stars, Cash Cows, Question Marks, Dogs with investment and divestment guidance.
Customizable Excel Spreadsheet
One-page Ashford BCG Matrix that spots portfolio gaps and clarifies resource shifts for faster, C-level decisions.
Cash Cows
Long-term base advisory fees
Long-term base advisory fees deliver recurring, contract-based revenue with low churn, forming Ashford’s cash-cow core and enabling predictable cash flow. Mature services are efficient to service, and margins rise with scale and shared services as fixed costs are spread. Maintaining service quality allows management to consistently milk this stream while funding growth elsewhere.
Property-level asset management retainers
Property-level asset management retainers deliver standardized oversight and reporting across stabilized hotels, driving predictable revenue; in 2024 similar management services showed industry EBITDA margins around 30% and steadier cash flow. Low incremental cost per asset once the playbook is set (often under $10k incremental annual cost) supports modest growth of roughly 3–5% CAGR. Invest just enough—about 1% of asset revenue—to keep retention high and protect margins.
Centralized procurement and vendor programs
Centralized procurement and vendor programs drive volume buying that lowers unit hotel costs and generates steady low-single-digit rebates and fee income; Ashford’s scale in 2024 helps protect market share in this mature procurement market. Cash conversion remains strong, with procurement-led working capital improvements shortening payment cycles. Focus on tightening compliance and renegotiating payment terms to widen the spread and boost free cash flow.
Corporate services platform fees
Corporate services platform fees
Shared accounting, treasury and tax functions are billed as platform fees, driving predictable cash flows and low churn; usage remained stable in 2024 as clients favored bundled back-office support. Deloitte 2024 benchmarks show shared‑services efficiency gains of 20–30%, which flow largely to EBITDA when processes are tight; strict scope control prevents margin dilution.- Stable recurring fees
- Low marketing spend, high ROI
- 20–30% efficiency uplift (Deloitte 2024)
- Enforce scope discipline
Benchmarking and reporting suites
Benchmarking and reporting suites deliver monthly portfolio dashboards and KPI packs relied on by clients; as a mature Ashford cash cow they show low growth but churn below the 2024 SaaS median (≈5%), driving predictable recurring revenue. High perceived value versus delivery cost keeps margins healthy, and continuous minor upgrades sustain stickiness and upsell pathways.
- Monthly delivery: core product
- Churn: below 2024 SaaS median ≈5%
- Margin: high due to low delivery cost
- Retention: sticky via continuous minor upgrades
Retainer model: 25–35% EBITDA, <5% churn, 3–5% CAGR
Long-term advisory fees and platform retainer services form Ashford’s cash cows, yielding recurring EBITDA margins ~25–35% in 2024, low churn (<5%) and 3–5% organic CAGR. Centralized procurement and shared services add low-single-digit rebate income and 20–30% efficiency gains (Deloitte 2024), improving FCF conversion.
| Metric | 2024 |
|---|---|
| EBITDA margin | 25–35% |
| Churn | <5% |
| CAGR | 3–5% |
| Efficiency uplift | 20–30% |
What You See Is What You Get
Ashford BCG Matrix
The Ashford BCG Matrix you're previewing is the exact file you'll receive after purchase. No watermarks, no placeholders—just the fully formatted, analysis-ready report built for clarity. Delivered immediately to your inbox, it's editable, printable, and presentation-ready. Crafted by strategy pros, it slots straight into your planning, pitch decks, or client work with zero fuss.
Original: $10.00
-65%$10.00
$3.50Description
Visual. Strategic. Downloadable.
Curious where Ashford’s products sit—Stars, Cash Cows, Dogs, or Question Marks? This snapshot hints at opportunity and risk, but the full Ashford BCG Matrix lays out precise quadrant placements, revenue context, and clear, actionable moves. Buy the complete report for a ready-to-use Word summary and an Excel dashboard that lets you reassign capital and prioritize growth with confidence. Skip the guesswork—get the full analysis and start steering strategy today.
Stars
Flagship REIT advisory mandates
Flagship REIT advisory mandates are crown jewels: large, highly visible engagements in expanding luxury and resort niches, driving strong market share through sticky, performance-based relationships. Recovery in luxury hospitality since 2022 has increased fee pools, making these mandates high-growth Stars. Continued investment in senior talent and advanced analytics will scale them into even larger fee engines.
Hotel asset optimization platform
Hotel asset optimization platform lifts RevPAR 3–7% via dynamic revenue management, trims labor costs 2–5% through productivity tools, and drives capex ROI with typical paybacks of 12–24 months that directly raise NOI. Portfolio-wide adoption creates scale and a leadership edge, while results largely self-fund ongoing rollout. Incremental investment remains necessary to sustain rollout and support.
Performance fee structures tied to NOI/RevPAR
Performance fee structures tied to NOI/RevPAR create snowballing aligned incentives: when hotels outperform, incentive fees stack on top of base fees, often increasing total fee take by roughly 20–30% in outperformance years. STR reported mid-single-digit RevPAR growth in 2024, supporting outsized incentive pay as markets recover. This drives high growth and is competitively defensible if contracts remain clean and transparent to sustain market share.
Resort and lifestyle segment focus
Leisure-led resort and lifestyle assets continue to outpace broader lodging, delivering higher pricing power and ancillary spend; STR reported resort RevPAR exceeded total U.S. lodging by about 12% in 2024, supporting stronger EBITDA margins. Ashford’s operational know-how and portfolio management give it a leadership perch, with growth running above industry averages and attracting new mandates. The firm should double down while the cycle still has room.
- Tag: RevPAR +12% vs total U.S. lodging (2024, STR)
- Tag: Higher ancillary spend and pricing power
- Tag: Ashford leadership in resort/lifestyle operations
- Tag: Growth above industry averages; new mandates accelerating
Capital allocation and transaction advisory
In 2024 repositionings, brand conversions and selective dispositions are creating visible value; Ashford’s transaction pipeline remains active and the firm consistently sits at the table. High growth, high influence and high share with existing clients demand maintained speed and diligence to stay first call.
- Repositionings drive NOI uplift
- Brand conversions enhance RevPAR
- Selective dispositions free capital
- Speed + diligence = top-of-mind advisor
Flagship REITs: RevPAR +12% fuels fees; ops lift 3-7%, payback 12-24 mo
Flagship REIT mandates and resort advisory are Stars: RevPAR +12% vs total U.S. lodging (2024, STR), driving fee pools and market share. Asset optimization lifts RevPAR 3–7% and trims labor 2–5%, with capex paybacks 12–24 months. Performance fees add ~20–30% in outperformance years, creating scalable, high-growth, self-funding engines.
| Metric | 2024 | Impact |
|---|---|---|
| RevPAR vs US | +12% (STR) | Higher fees |
| Platform RevPAR lift | 3–7% | NOI uplift |
| Incentive uplift | 20–30% | Fee growth |
| Payback | 12–24 mo | Capex ROI |
What is included in the product
Detailed Word Document
Comprehensive BCG Matrix review of Ashford’s units, identifying Stars, Cash Cows, Question Marks, Dogs with investment and divestment guidance.
Customizable Excel Spreadsheet
One-page Ashford BCG Matrix that spots portfolio gaps and clarifies resource shifts for faster, C-level decisions.
Cash Cows
Long-term base advisory fees
Long-term base advisory fees deliver recurring, contract-based revenue with low churn, forming Ashford’s cash-cow core and enabling predictable cash flow. Mature services are efficient to service, and margins rise with scale and shared services as fixed costs are spread. Maintaining service quality allows management to consistently milk this stream while funding growth elsewhere.
Property-level asset management retainers
Property-level asset management retainers deliver standardized oversight and reporting across stabilized hotels, driving predictable revenue; in 2024 similar management services showed industry EBITDA margins around 30% and steadier cash flow. Low incremental cost per asset once the playbook is set (often under $10k incremental annual cost) supports modest growth of roughly 3–5% CAGR. Invest just enough—about 1% of asset revenue—to keep retention high and protect margins.
Centralized procurement and vendor programs
Centralized procurement and vendor programs drive volume buying that lowers unit hotel costs and generates steady low-single-digit rebates and fee income; Ashford’s scale in 2024 helps protect market share in this mature procurement market. Cash conversion remains strong, with procurement-led working capital improvements shortening payment cycles. Focus on tightening compliance and renegotiating payment terms to widen the spread and boost free cash flow.
Corporate services platform fees
Corporate services platform fees
Shared accounting, treasury and tax functions are billed as platform fees, driving predictable cash flows and low churn; usage remained stable in 2024 as clients favored bundled back-office support. Deloitte 2024 benchmarks show shared‑services efficiency gains of 20–30%, which flow largely to EBITDA when processes are tight; strict scope control prevents margin dilution.- Stable recurring fees
- Low marketing spend, high ROI
- 20–30% efficiency uplift (Deloitte 2024)
- Enforce scope discipline
Benchmarking and reporting suites
Benchmarking and reporting suites deliver monthly portfolio dashboards and KPI packs relied on by clients; as a mature Ashford cash cow they show low growth but churn below the 2024 SaaS median (≈5%), driving predictable recurring revenue. High perceived value versus delivery cost keeps margins healthy, and continuous minor upgrades sustain stickiness and upsell pathways.
- Monthly delivery: core product
- Churn: below 2024 SaaS median ≈5%
- Margin: high due to low delivery cost
- Retention: sticky via continuous minor upgrades
Retainer model: 25–35% EBITDA, <5% churn, 3–5% CAGR
Long-term advisory fees and platform retainer services form Ashford’s cash cows, yielding recurring EBITDA margins ~25–35% in 2024, low churn (<5%) and 3–5% organic CAGR. Centralized procurement and shared services add low-single-digit rebate income and 20–30% efficiency gains (Deloitte 2024), improving FCF conversion.
| Metric | 2024 |
|---|---|
| EBITDA margin | 25–35% |
| Churn | <5% |
| CAGR | 3–5% |
| Efficiency uplift | 20–30% |
What You See Is What You Get
Ashford BCG Matrix
The Ashford BCG Matrix you're previewing is the exact file you'll receive after purchase. No watermarks, no placeholders—just the fully formatted, analysis-ready report built for clarity. Delivered immediately to your inbox, it's editable, printable, and presentation-ready. Crafted by strategy pros, it slots straight into your planning, pitch decks, or client work with zero fuss.











