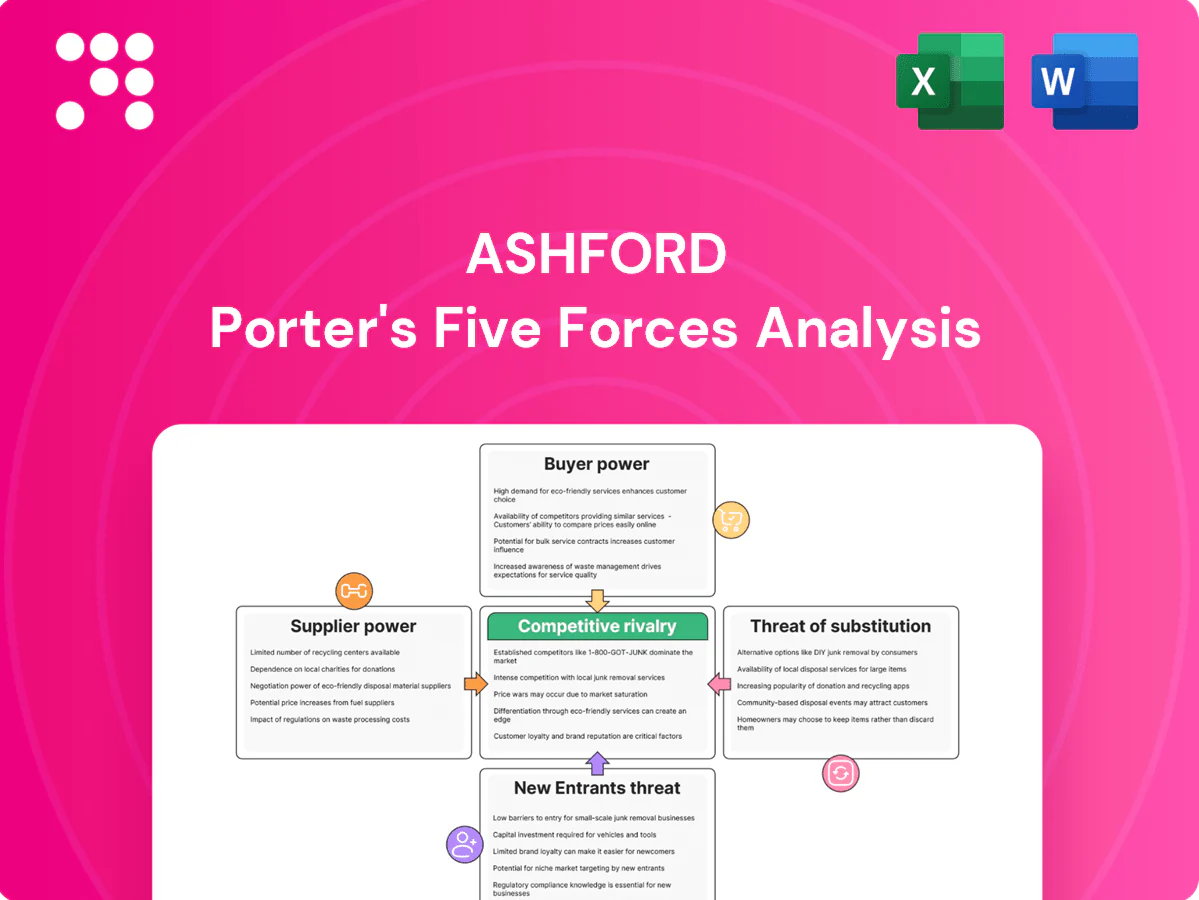
Ashford Porter's Five Forces Analysis

Don't Miss the Bigger Picture
Ashford’s Porter's Five Forces snapshot highlights key competitive dynamics—buyer and supplier power, rivalry intensity, and substitute and entrant threats—to frame strategic risks and opportunities. This concise view surfaces where Ashford gains leverage and where vulnerabilities lie. Ready for deeper, actionable insights? Unlock the full Porter's Five Forces Analysis to explore force-by-force ratings, visuals, and tailored business implications.
Suppliers Bargaining Power

Specialized data vendors
Hospitality asset managers depend on premium datasets—PMS, STR, RevPAR, booking and market analytics—to value assets and forecast cash flows. CoStar Group owns STR, which reports coverage in 180+ countries, and a small number of PMS and analytics firms dominate distribution and bundling. Price increases or licensing changes by these vendors can force model recalibration and disrupt benchmarks, raising operational risk. This concentration gives vendors moderate-to-high leverage over terms and access.
Technology platforms
Portfolio monitoring, forecasting and reporting hinge on SaaS integrations, and by 2024 many enterprises run over 100 SaaS apps, creating deep bespoke workflows that raise switching costs and vendor lock-in. Outage or licensing risk can directly breach SLAs—core storage promises like Amazon S3 durability at 99.999999999% nonetheless coexist with occasional service outages. Providers exercise supplier power via feature gating and routine annual uplifts that compress margins and raise renewal risks.

Talent and domain expertise
Experienced hotel asset managers, brand-negotiation experts and revenue-management specialists are scarce, giving them outsized leverage over fees and contract terms. Compensation and retention packages have risen sharply amid labor shortages—AHLA reported industry turnover near 70% in 2023—pushing firms to offer premium pay and signing bonuses. Client outcomes hinge on key individuals, creating key-person risk, while longer recruiting cycles delay project delivery and raise implementation costs.

Hotel operators and brands
Hotel operators and brands control critical property-level data and must align with Ashford on asset plans; large flags such as Marriott (≈8,700 properties, ~1.6M rooms in 2024), Hilton and Hyatt can restrict information flow and demand stricter contract terms. Disputes over capital plans, PIPs and management/brand fees regularly delay repositioning and value-creation timelines, giving operators situational leverage in renegotiations.
- Operator access: essential for underwriting and KPI tracking
- Big flags: scale allows influence on contract flexibility
- Disputes: PIPs and fee disagreements delay exits/renovations
- Leverage: interdependence grants operators bargaining power
Banking and service partners
- Financing counterparties dictate covenants and timing
- Legal/valuation panels gate access and fees
- 2024 rate backdrop (5.25–5.50%) elevated lender leverage
Supplier pricing and licensing power raises switching costs, model risk and renewal pressure
Suppliers—from data vendors (CoStar/STR, 180+ countries) and SaaS platforms (>100 apps per enterprise in 2024) to scarce asset managers (AHLA turnover ~70% in 2023) and big hotel flags (Marriott ≈8,700 properties in 2024)—hold moderate-to-high leverage via pricing, licensing and access, raising switching costs, model risk and renewal pressure.
| Supplier | 2024/2023 |
|---|---|
| STR coverage | 180+ countries |
| Enterprise SaaS | >100 apps |
| AHLA turnover | ~70% (2023) |
| Marriott | ≈8,700 properties (2024) |
What is included in the product
 Detailed Word Document
Uncovers key drivers of competition, customer influence, and market entry risks tailored exclusively to Ashford, identifying disruptive forces, substitutes, and emerging threats to market share. Evaluates supplier and buyer power, competitive rivalry, and barriers to entry with strategic commentary and industry data for easy incorporation into reports or investor materials.

 Customizable Excel Spreadsheet
Ashford Porter's Five Forces delivers a one-sheet, customizable view of competitive pressure—interactive spider charts, editable labels and scenarios, no macros—so teams get deck-ready strategic insight fast.
Customers Bargaining Power

Concentrated REIT clients
Hospitality REITs and large commingled vehicles often act as sophisticated, high-AUM buyers—separate accounts and REITs commonly exceed $1 billion—giving them leverage to negotiate fees and push back on scope. Their concentration means losing a single mandate can cut AUM-linked revenues materially; for boutique managers the top 5 clients frequently account for more than 20–30% of fee income. Such clients routinely demand bespoke reporting, quarterly KPIs and performance hurdles tied to NOI or RevPAR.
Internalization threat
Larger clients can build in-house asset management to cut external fees, commonly saving 25–100 basis points versus outsourced mandates. Internal teams reduce dependence and broaden switching options, with many institutions shifting roughly 10–30% of mandates in-house in recent years. That internalization threat disciplines pricing and contract renewals, and greater performance transparency makes the build-versus-buy calculus more straightforward.

Fee sensitivity
Industry norms in 2024 shifted toward lower base fees and stronger performance alignment, with large LPs reporting fee cuts up to 30% and median base fees approaching 1.0% in many private markets segments. Clients increasingly benchmark managers and demand breakpoints, clawbacks and expanded co-invest rights, compressing headline economics. Budget cycles and market drawdowns amplify price pressure, boosting buyer bargaining power.

Low-to-moderate switching costs
Demand for differentiated alpha
Clients reward unique sourcing, brand negotiation leverage, and RevPAR outperformance as primary drivers of manager selection; in 2024 top-differentiated managers captured disproportionate inflows while weak differentiation leads buyers to commoditize services and push fees down.
- Clients reward: unique sourcing, RevPAR outperformance
- Buyer power rises when differentiation weak
- Audited track records temper buyer leverage
- Poor 2024 performance amplifies pricing pressure
Clients extract up to 30% fee cuts; median base fee ~1.0%; onboarding 3-6 months
Bargaining power of customers is moderate: large REITs/commingled buyers (often >$1bn AUM) extract fee cuts up to 30% with median base fees ~1.0% in 2024. Top 5 clients often drive 20–30% of boutique fees and internalization (10–30% of mandates) pressures pricing. Onboarding median 3–6 months; termination notices typically 30–90 days, and larger clients save 25–100 bps by insourcing.
| Metric | 2024 Benchmark |
|---|---|
| Median onboarding | 3–6 months |
| Median base fee | ~1.0% |
| Max reported fee cuts | Up to 30% |
| Top-5 client concentration | 20–30% |
| Insourcing shift | 10–30% |
| Insourcing savings | 25–100 bps |
Full Version Awaits
Ashford Porter's Five Forces Analysis
This preview shows the exact Ashford Porter's Five Forces analysis you'll receive—no samples, no placeholders—fully formatted and ready for immediate download after purchase. It delivers a complete assessment of competitive rivalry, supplier and buyer power, threats of entry and substitution, and strategic implications tailored to Ashford. Purchase grants instant access to this exact file for immediate use.

Don't Miss the Bigger Picture
Ashford’s Porter's Five Forces snapshot highlights key competitive dynamics—buyer and supplier power, rivalry intensity, and substitute and entrant threats—to frame strategic risks and opportunities. This concise view surfaces where Ashford gains leverage and where vulnerabilities lie. Ready for deeper, actionable insights? Unlock the full Porter's Five Forces Analysis to explore force-by-force ratings, visuals, and tailored business implications.
Suppliers Bargaining Power
Specialized data vendors
Hospitality asset managers depend on premium datasets—PMS, STR, RevPAR, booking and market analytics—to value assets and forecast cash flows. CoStar Group owns STR, which reports coverage in 180+ countries, and a small number of PMS and analytics firms dominate distribution and bundling. Price increases or licensing changes by these vendors can force model recalibration and disrupt benchmarks, raising operational risk. This concentration gives vendors moderate-to-high leverage over terms and access.
Technology platforms
Portfolio monitoring, forecasting and reporting hinge on SaaS integrations, and by 2024 many enterprises run over 100 SaaS apps, creating deep bespoke workflows that raise switching costs and vendor lock-in. Outage or licensing risk can directly breach SLAs—core storage promises like Amazon S3 durability at 99.999999999% nonetheless coexist with occasional service outages. Providers exercise supplier power via feature gating and routine annual uplifts that compress margins and raise renewal risks.
Talent and domain expertise
Experienced hotel asset managers, brand-negotiation experts and revenue-management specialists are scarce, giving them outsized leverage over fees and contract terms. Compensation and retention packages have risen sharply amid labor shortages—AHLA reported industry turnover near 70% in 2023—pushing firms to offer premium pay and signing bonuses. Client outcomes hinge on key individuals, creating key-person risk, while longer recruiting cycles delay project delivery and raise implementation costs.
Hotel operators and brands
Hotel operators and brands control critical property-level data and must align with Ashford on asset plans; large flags such as Marriott (≈8,700 properties, ~1.6M rooms in 2024), Hilton and Hyatt can restrict information flow and demand stricter contract terms. Disputes over capital plans, PIPs and management/brand fees regularly delay repositioning and value-creation timelines, giving operators situational leverage in renegotiations.
- Operator access: essential for underwriting and KPI tracking
- Big flags: scale allows influence on contract flexibility
- Disputes: PIPs and fee disagreements delay exits/renovations
- Leverage: interdependence grants operators bargaining power
Banking and service partners
- Financing counterparties dictate covenants and timing
- Legal/valuation panels gate access and fees
- 2024 rate backdrop (5.25–5.50%) elevated lender leverage
Supplier pricing and licensing power raises switching costs, model risk and renewal pressure
Suppliers—from data vendors (CoStar/STR, 180+ countries) and SaaS platforms (>100 apps per enterprise in 2024) to scarce asset managers (AHLA turnover ~70% in 2023) and big hotel flags (Marriott ≈8,700 properties in 2024)—hold moderate-to-high leverage via pricing, licensing and access, raising switching costs, model risk and renewal pressure.
| Supplier | 2024/2023 |
|---|---|
| STR coverage | 180+ countries |
| Enterprise SaaS | >100 apps |
| AHLA turnover | ~70% (2023) |
| Marriott | ≈8,700 properties (2024) |
What is included in the product
Detailed Word Document
Uncovers key drivers of competition, customer influence, and market entry risks tailored exclusively to Ashford, identifying disruptive forces, substitutes, and emerging threats to market share. Evaluates supplier and buyer power, competitive rivalry, and barriers to entry with strategic commentary and industry data for easy incorporation into reports or investor materials.
Customizable Excel Spreadsheet
Ashford Porter's Five Forces delivers a one-sheet, customizable view of competitive pressure—interactive spider charts, editable labels and scenarios, no macros—so teams get deck-ready strategic insight fast.
Customers Bargaining Power
Concentrated REIT clients
Hospitality REITs and large commingled vehicles often act as sophisticated, high-AUM buyers—separate accounts and REITs commonly exceed $1 billion—giving them leverage to negotiate fees and push back on scope. Their concentration means losing a single mandate can cut AUM-linked revenues materially; for boutique managers the top 5 clients frequently account for more than 20–30% of fee income. Such clients routinely demand bespoke reporting, quarterly KPIs and performance hurdles tied to NOI or RevPAR.
Internalization threat
Larger clients can build in-house asset management to cut external fees, commonly saving 25–100 basis points versus outsourced mandates. Internal teams reduce dependence and broaden switching options, with many institutions shifting roughly 10–30% of mandates in-house in recent years. That internalization threat disciplines pricing and contract renewals, and greater performance transparency makes the build-versus-buy calculus more straightforward.
Fee sensitivity
Industry norms in 2024 shifted toward lower base fees and stronger performance alignment, with large LPs reporting fee cuts up to 30% and median base fees approaching 1.0% in many private markets segments. Clients increasingly benchmark managers and demand breakpoints, clawbacks and expanded co-invest rights, compressing headline economics. Budget cycles and market drawdowns amplify price pressure, boosting buyer bargaining power.
Low-to-moderate switching costs
Demand for differentiated alpha
Clients reward unique sourcing, brand negotiation leverage, and RevPAR outperformance as primary drivers of manager selection; in 2024 top-differentiated managers captured disproportionate inflows while weak differentiation leads buyers to commoditize services and push fees down.
- Clients reward: unique sourcing, RevPAR outperformance
- Buyer power rises when differentiation weak
- Audited track records temper buyer leverage
- Poor 2024 performance amplifies pricing pressure
Clients extract up to 30% fee cuts; median base fee ~1.0%; onboarding 3-6 months
Bargaining power of customers is moderate: large REITs/commingled buyers (often >$1bn AUM) extract fee cuts up to 30% with median base fees ~1.0% in 2024. Top 5 clients often drive 20–30% of boutique fees and internalization (10–30% of mandates) pressures pricing. Onboarding median 3–6 months; termination notices typically 30–90 days, and larger clients save 25–100 bps by insourcing.
| Metric | 2024 Benchmark |
|---|---|
| Median onboarding | 3–6 months |
| Median base fee | ~1.0% |
| Max reported fee cuts | Up to 30% |
| Top-5 client concentration | 20–30% |
| Insourcing shift | 10–30% |
| Insourcing savings | 25–100 bps |
Full Version Awaits
Ashford Porter's Five Forces Analysis
This preview shows the exact Ashford Porter's Five Forces analysis you'll receive—no samples, no placeholders—fully formatted and ready for immediate download after purchase. It delivers a complete assessment of competitive rivalry, supplier and buyer power, threats of entry and substitution, and strategic implications tailored to Ashford. Purchase grants instant access to this exact file for immediate use.
Description
Don't Miss the Bigger Picture
Ashford’s Porter's Five Forces snapshot highlights key competitive dynamics—buyer and supplier power, rivalry intensity, and substitute and entrant threats—to frame strategic risks and opportunities. This concise view surfaces where Ashford gains leverage and where vulnerabilities lie. Ready for deeper, actionable insights? Unlock the full Porter's Five Forces Analysis to explore force-by-force ratings, visuals, and tailored business implications.
Suppliers Bargaining Power
Specialized data vendors
Hospitality asset managers depend on premium datasets—PMS, STR, RevPAR, booking and market analytics—to value assets and forecast cash flows. CoStar Group owns STR, which reports coverage in 180+ countries, and a small number of PMS and analytics firms dominate distribution and bundling. Price increases or licensing changes by these vendors can force model recalibration and disrupt benchmarks, raising operational risk. This concentration gives vendors moderate-to-high leverage over terms and access.
Technology platforms
Portfolio monitoring, forecasting and reporting hinge on SaaS integrations, and by 2024 many enterprises run over 100 SaaS apps, creating deep bespoke workflows that raise switching costs and vendor lock-in. Outage or licensing risk can directly breach SLAs—core storage promises like Amazon S3 durability at 99.999999999% nonetheless coexist with occasional service outages. Providers exercise supplier power via feature gating and routine annual uplifts that compress margins and raise renewal risks.
Talent and domain expertise
Experienced hotel asset managers, brand-negotiation experts and revenue-management specialists are scarce, giving them outsized leverage over fees and contract terms. Compensation and retention packages have risen sharply amid labor shortages—AHLA reported industry turnover near 70% in 2023—pushing firms to offer premium pay and signing bonuses. Client outcomes hinge on key individuals, creating key-person risk, while longer recruiting cycles delay project delivery and raise implementation costs.
Hotel operators and brands
Hotel operators and brands control critical property-level data and must align with Ashford on asset plans; large flags such as Marriott (≈8,700 properties, ~1.6M rooms in 2024), Hilton and Hyatt can restrict information flow and demand stricter contract terms. Disputes over capital plans, PIPs and management/brand fees regularly delay repositioning and value-creation timelines, giving operators situational leverage in renegotiations.
- Operator access: essential for underwriting and KPI tracking
- Big flags: scale allows influence on contract flexibility
- Disputes: PIPs and fee disagreements delay exits/renovations
- Leverage: interdependence grants operators bargaining power
Banking and service partners
- Financing counterparties dictate covenants and timing
- Legal/valuation panels gate access and fees
- 2024 rate backdrop (5.25–5.50%) elevated lender leverage
Supplier pricing and licensing power raises switching costs, model risk and renewal pressure
Suppliers—from data vendors (CoStar/STR, 180+ countries) and SaaS platforms (>100 apps per enterprise in 2024) to scarce asset managers (AHLA turnover ~70% in 2023) and big hotel flags (Marriott ≈8,700 properties in 2024)—hold moderate-to-high leverage via pricing, licensing and access, raising switching costs, model risk and renewal pressure.
| Supplier | 2024/2023 |
|---|---|
| STR coverage | 180+ countries |
| Enterprise SaaS | >100 apps |
| AHLA turnover | ~70% (2023) |
| Marriott | ≈8,700 properties (2024) |
What is included in the product
Detailed Word Document
Uncovers key drivers of competition, customer influence, and market entry risks tailored exclusively to Ashford, identifying disruptive forces, substitutes, and emerging threats to market share. Evaluates supplier and buyer power, competitive rivalry, and barriers to entry with strategic commentary and industry data for easy incorporation into reports or investor materials.
Customizable Excel Spreadsheet
Ashford Porter's Five Forces delivers a one-sheet, customizable view of competitive pressure—interactive spider charts, editable labels and scenarios, no macros—so teams get deck-ready strategic insight fast.
Customers Bargaining Power
Concentrated REIT clients
Hospitality REITs and large commingled vehicles often act as sophisticated, high-AUM buyers—separate accounts and REITs commonly exceed $1 billion—giving them leverage to negotiate fees and push back on scope. Their concentration means losing a single mandate can cut AUM-linked revenues materially; for boutique managers the top 5 clients frequently account for more than 20–30% of fee income. Such clients routinely demand bespoke reporting, quarterly KPIs and performance hurdles tied to NOI or RevPAR.
Internalization threat
Larger clients can build in-house asset management to cut external fees, commonly saving 25–100 basis points versus outsourced mandates. Internal teams reduce dependence and broaden switching options, with many institutions shifting roughly 10–30% of mandates in-house in recent years. That internalization threat disciplines pricing and contract renewals, and greater performance transparency makes the build-versus-buy calculus more straightforward.
Fee sensitivity
Industry norms in 2024 shifted toward lower base fees and stronger performance alignment, with large LPs reporting fee cuts up to 30% and median base fees approaching 1.0% in many private markets segments. Clients increasingly benchmark managers and demand breakpoints, clawbacks and expanded co-invest rights, compressing headline economics. Budget cycles and market drawdowns amplify price pressure, boosting buyer bargaining power.
Low-to-moderate switching costs
Demand for differentiated alpha
Clients reward unique sourcing, brand negotiation leverage, and RevPAR outperformance as primary drivers of manager selection; in 2024 top-differentiated managers captured disproportionate inflows while weak differentiation leads buyers to commoditize services and push fees down.
- Clients reward: unique sourcing, RevPAR outperformance
- Buyer power rises when differentiation weak
- Audited track records temper buyer leverage
- Poor 2024 performance amplifies pricing pressure
Clients extract up to 30% fee cuts; median base fee ~1.0%; onboarding 3-6 months
Bargaining power of customers is moderate: large REITs/commingled buyers (often >$1bn AUM) extract fee cuts up to 30% with median base fees ~1.0% in 2024. Top 5 clients often drive 20–30% of boutique fees and internalization (10–30% of mandates) pressures pricing. Onboarding median 3–6 months; termination notices typically 30–90 days, and larger clients save 25–100 bps by insourcing.
| Metric | 2024 Benchmark |
|---|---|
| Median onboarding | 3–6 months |
| Median base fee | ~1.0% |
| Max reported fee cuts | Up to 30% |
| Top-5 client concentration | 20–30% |
| Insourcing shift | 10–30% |
| Insourcing savings | 25–100 bps |
Full Version Awaits
Ashford Porter's Five Forces Analysis
This preview shows the exact Ashford Porter's Five Forces analysis you'll receive—no samples, no placeholders—fully formatted and ready for immediate download after purchase. It delivers a complete assessment of competitive rivalry, supplier and buyer power, threats of entry and substitution, and strategic implications tailored to Ashford. Purchase grants instant access to this exact file for immediate use.











