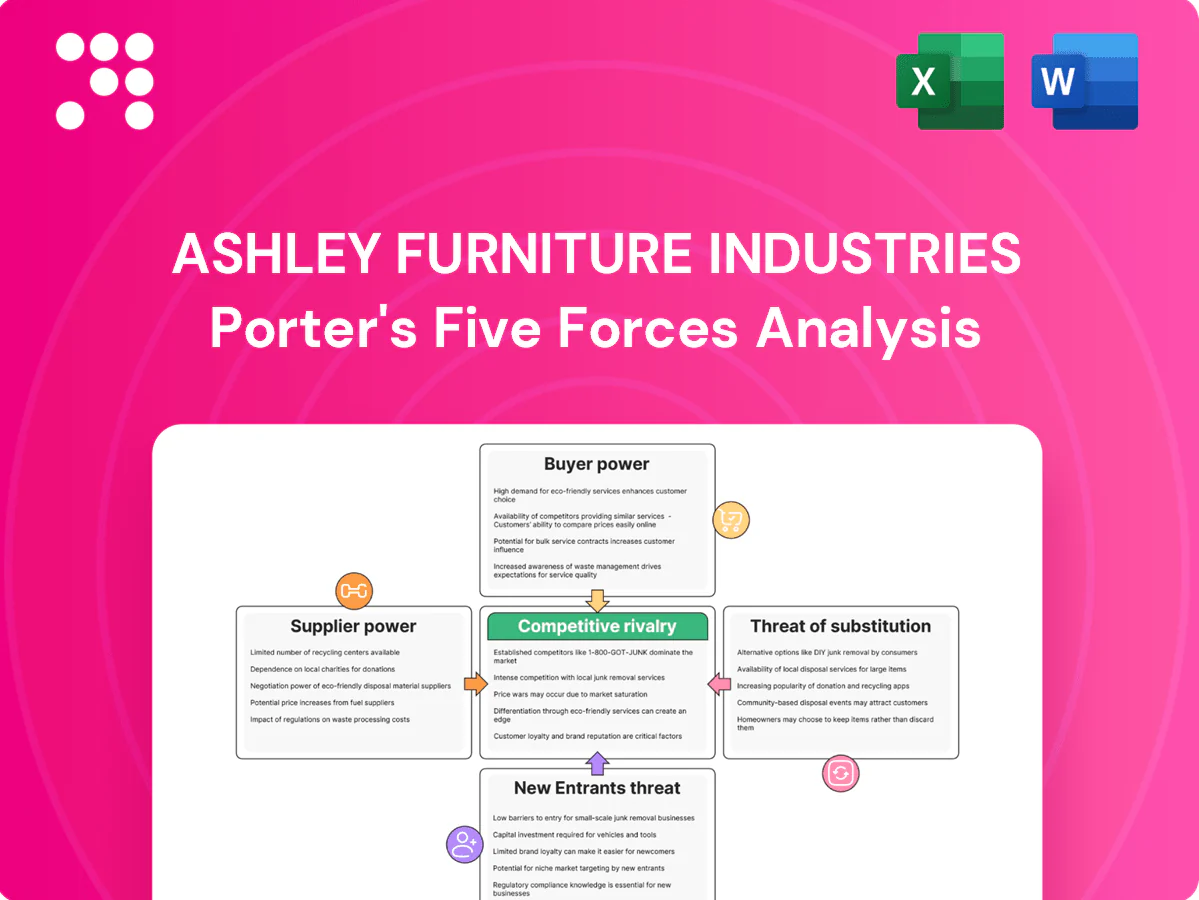
Ashley Furniture Industries Porter's Five Forces Analysis

Don't Miss the Bigger Picture
Ashley Furniture Industries faces intense competitive rivalry from national and online retailers, moderate supplier leverage given scale, and variable buyer power driven by pricing sensitivity and brand preference. Threats from substitutes and new entrants are tempered by distribution strength and economies of scale. This brief snapshot only scratches the surface. Unlock the full Porter's Five Forces Analysis to explore Ashley Furniture Industries’s competitive dynamics in detail.
Suppliers Bargaining Power

Diverse commodity input base
Ashley draws lumber, foam, steel, textiles and hardware from broad global pools, keeping individual supplier leverage modest and enabling multi-sourcing and frequent bidding. Commodity inputs—lumber down roughly 40% from 2021 peaks by 2024—can still spike, temporarily boosting supplier influence. AFI’s use of hedging and multi-year contracts partially offsets price volatility and short-term supplier power.
Logistics and freight constraints
Container capacity shortfalls, port congestion and trucking tightness in 2024 amplified carriers and 3PLs bargaining power, with furniture’s bulky cubic profile making Ashley particularly freight-cost sensitive; nearshoring and distributed plants lower exposure but do not eliminate lane bottlenecks, and seasonal promotion surges (often >20% volume spikes) can rapidly strain capacity and push spot rates higher.

Specialty chemicals and machinery
PU foam chemicals, specialty adhesives and CNC/automation vendors are industry-concentrated—major chemical players supply key PU feedstocks—creating switching frictions; technical specs, industry certifications and high uptime requirements increase dependency. Long equipment replacement cycles (typically 5–10 years) and multi-year service contracts give these suppliers measurable bargaining room and pricing leverage.

Standards, ESG, and compliance
Legal-sourced timber requirements, emissions controls, and workplace-safety standards in 2024 sharply narrow AFI’s eligible supplier pool, boosting negotiating leverage of compliant mills; certifications and third-party audits (FSC/PEFC) increase supplier costs and slow substitution. AFI’s scale aids enforcement of codes across its supply chain but cannot eliminate upstream capacity or compliance constraints.
- Supply constraint: compliant mills hold superior bargaining power
- Cost impact: certifications and audits raise supplier operating costs
- Switching lag: certification timelines limit quick substitution
- Scale mitigant: AFI can enforce codes but not remove scarcity
Scale counterbalances power
Ashley Furniture’s scale — retail footprint of over 1,000 stores and annual sales exceeding 5 billion dollars — gives it leverage: centralized forecasting, aggregated buys and vendor scorecards drive down pricing and enforce service levels, while dual/multi-region sourcing plus supplier financing and VMI cut single‑point risk and improve terms.
Balance of power: moderating commodity prices vs high freight and specialty vendor leverage
Ashley faces generally moderate supplier power: commodity inputs benefit from broad sourcing (lumber prices down ~40% from 2021 peaks by 2024) but can spike, raising short‑term leverage. Freight/3PLs tightened in 2024, boosting carrier power amid >20% seasonal volume surges. Specialized chemicals, adhesives and CNC vendors exert high power due to concentration and 5–10 year equipment cycles; scale and aggregated buys partially offset this.
| Supplier | Power 2024 | Metric |
|---|---|---|
| Commodities (lumber/foam) | Moderate | Lumber -40% vs 2021 |
| Freight/3PL | High | Seasonal spikes >20% |
| Specialty chemicals/equipment | High | 5–10 yr cycles |
| Certified timber mills | High | Compliance narrows pool |
What is included in the product
 Detailed Word Document
Tailored Porter’s Five Forces analysis of Ashley Furniture Industries assessing competitive rivalry, buyer and supplier power, threat of substitutes, and barriers to entry to identify the key drivers shaping pricing, margins, market share, and strategic vulnerabilities.

 Customizable Excel Spreadsheet
A concise one-sheet Porter's Five Forces for Ashley Furniture that visualizes supplier/buyer power, rivalry, substitutes and entry threats with an interactive spider chart—customize pressure levels by market data and drop straight into decks for fast, board-ready decisions.
Customers Bargaining Power

Price-sensitive consumers
End customers compare aggressively across retailers and online—e-commerce accounted for roughly 20% of US furniture sales in 2024—putting downward pressure on Ashley's margins. Furniture is discretionary and promotion-driven, with peak promotion seasons compressing margins. Consumers expect financing and bundles; BNPL and in-store credit penetration rose in 2024, and low switching costs amplify buyer power.
Omnichannel transparency
Omnichannel transparency elevates customer bargaining: 82% of shoppers consult reviews and price-tracking/AR tools raise switching propensity, pressuring margins. Rapid delivery and free returns norms from e-commerce have pushed furniture delivery expectations; U.S. online furniture sales ~48 billion USD in 2023, intensifying speed competition. Visible lead times become a negotiation lever, and stockouts rapidly divert demand to rivals.

Independent retailer leverage
Wholesale partners can consolidate volume—Ashley leverages over 1,000 retailer locations—so chains secure co-op marketing and tougher terms; floor space allocation depends on sell-through and vendor support, often tied to performance metrics. Private-label alternatives pressure category mix and margins, while performance-based rebates are common asks, shifting effective pricing and working capital demands in a US furniture market near $120 billion in 2024.

Own retail moderates power
Ashley HomeStore channel captures retail margin and customer data, moderating external buyer leverage as Ashley remains the largest US furniture manufacturer by sales in 2024. Direct assortment and merchandising control let the company shape demand and price resilience, while loyalty programs lower churn and increase repeat purchase rates. Stores still must match market promotions and competitor discounts to retain price-sensitive customers.
- Channel reach: nationwide multi-hundred store footprint
- Data advantage: proprietary POS and CRM analytics
- Loyalty: drives repeat purchases and higher CLV
- Constraint: must follow market promo cycles
Low switching costs
Comparable styles across brands at similar price points make switching easy; 2024 retail reports note post-purchase service and delivery windows are primary purchase differentiators. Limited customization keeps substitution straightforward, while clear returns policies and warranties reduce perceived risk and amplify customer bargaining power.
- Comparable styles/price parity
- Delivery windows, warranty, service responsiveness
- Limited customization = easy substitution
- Returns policies lower perceived risk
Customers hold pricing power: $120B market, 20% online, 82% review consults
Customers exert high bargaining power: 20% of US furniture sales were online in 2024 and the US market was ~$120B, heightening price and service competition. Low switching costs, BNPL growth and 82% who consult reviews compress margins. Ashley's store network and proprietary data partially offset pressure but must match market promotions and delivery expectations.
| Metric | 2024 |
|---|---|
| US furniture market | $120B |
| Online share | 20% |
| Shoppers consulting reviews | 82% |
Same Document Delivered
Ashley Furniture Industries Porter's Five Forces Analysis
This preview shows the exact Ashley Furniture Industries Porter's Five Forces analysis you'll receive after purchase—no placeholders or mockups. The document is fully formatted, professionally written, and ready for immediate download and use upon payment. What you see is what you get.

Don't Miss the Bigger Picture
Ashley Furniture Industries faces intense competitive rivalry from national and online retailers, moderate supplier leverage given scale, and variable buyer power driven by pricing sensitivity and brand preference. Threats from substitutes and new entrants are tempered by distribution strength and economies of scale. This brief snapshot only scratches the surface. Unlock the full Porter's Five Forces Analysis to explore Ashley Furniture Industries’s competitive dynamics in detail.
Suppliers Bargaining Power
Diverse commodity input base
Ashley draws lumber, foam, steel, textiles and hardware from broad global pools, keeping individual supplier leverage modest and enabling multi-sourcing and frequent bidding. Commodity inputs—lumber down roughly 40% from 2021 peaks by 2024—can still spike, temporarily boosting supplier influence. AFI’s use of hedging and multi-year contracts partially offsets price volatility and short-term supplier power.
Logistics and freight constraints
Container capacity shortfalls, port congestion and trucking tightness in 2024 amplified carriers and 3PLs bargaining power, with furniture’s bulky cubic profile making Ashley particularly freight-cost sensitive; nearshoring and distributed plants lower exposure but do not eliminate lane bottlenecks, and seasonal promotion surges (often >20% volume spikes) can rapidly strain capacity and push spot rates higher.
Specialty chemicals and machinery
PU foam chemicals, specialty adhesives and CNC/automation vendors are industry-concentrated—major chemical players supply key PU feedstocks—creating switching frictions; technical specs, industry certifications and high uptime requirements increase dependency. Long equipment replacement cycles (typically 5–10 years) and multi-year service contracts give these suppliers measurable bargaining room and pricing leverage.
Standards, ESG, and compliance
Legal-sourced timber requirements, emissions controls, and workplace-safety standards in 2024 sharply narrow AFI’s eligible supplier pool, boosting negotiating leverage of compliant mills; certifications and third-party audits (FSC/PEFC) increase supplier costs and slow substitution. AFI’s scale aids enforcement of codes across its supply chain but cannot eliminate upstream capacity or compliance constraints.
- Supply constraint: compliant mills hold superior bargaining power
- Cost impact: certifications and audits raise supplier operating costs
- Switching lag: certification timelines limit quick substitution
- Scale mitigant: AFI can enforce codes but not remove scarcity
Scale counterbalances power
Ashley Furniture’s scale — retail footprint of over 1,000 stores and annual sales exceeding 5 billion dollars — gives it leverage: centralized forecasting, aggregated buys and vendor scorecards drive down pricing and enforce service levels, while dual/multi-region sourcing plus supplier financing and VMI cut single‑point risk and improve terms.
Balance of power: moderating commodity prices vs high freight and specialty vendor leverage
Ashley faces generally moderate supplier power: commodity inputs benefit from broad sourcing (lumber prices down ~40% from 2021 peaks by 2024) but can spike, raising short‑term leverage. Freight/3PLs tightened in 2024, boosting carrier power amid >20% seasonal volume surges. Specialized chemicals, adhesives and CNC vendors exert high power due to concentration and 5–10 year equipment cycles; scale and aggregated buys partially offset this.
| Supplier | Power 2024 | Metric |
|---|---|---|
| Commodities (lumber/foam) | Moderate | Lumber -40% vs 2021 |
| Freight/3PL | High | Seasonal spikes >20% |
| Specialty chemicals/equipment | High | 5–10 yr cycles |
| Certified timber mills | High | Compliance narrows pool |
What is included in the product
Detailed Word Document
Tailored Porter’s Five Forces analysis of Ashley Furniture Industries assessing competitive rivalry, buyer and supplier power, threat of substitutes, and barriers to entry to identify the key drivers shaping pricing, margins, market share, and strategic vulnerabilities.
Customizable Excel Spreadsheet
A concise one-sheet Porter's Five Forces for Ashley Furniture that visualizes supplier/buyer power, rivalry, substitutes and entry threats with an interactive spider chart—customize pressure levels by market data and drop straight into decks for fast, board-ready decisions.
Customers Bargaining Power
Price-sensitive consumers
End customers compare aggressively across retailers and online—e-commerce accounted for roughly 20% of US furniture sales in 2024—putting downward pressure on Ashley's margins. Furniture is discretionary and promotion-driven, with peak promotion seasons compressing margins. Consumers expect financing and bundles; BNPL and in-store credit penetration rose in 2024, and low switching costs amplify buyer power.
Omnichannel transparency
Omnichannel transparency elevates customer bargaining: 82% of shoppers consult reviews and price-tracking/AR tools raise switching propensity, pressuring margins. Rapid delivery and free returns norms from e-commerce have pushed furniture delivery expectations; U.S. online furniture sales ~48 billion USD in 2023, intensifying speed competition. Visible lead times become a negotiation lever, and stockouts rapidly divert demand to rivals.
Independent retailer leverage
Wholesale partners can consolidate volume—Ashley leverages over 1,000 retailer locations—so chains secure co-op marketing and tougher terms; floor space allocation depends on sell-through and vendor support, often tied to performance metrics. Private-label alternatives pressure category mix and margins, while performance-based rebates are common asks, shifting effective pricing and working capital demands in a US furniture market near $120 billion in 2024.
Own retail moderates power
Ashley HomeStore channel captures retail margin and customer data, moderating external buyer leverage as Ashley remains the largest US furniture manufacturer by sales in 2024. Direct assortment and merchandising control let the company shape demand and price resilience, while loyalty programs lower churn and increase repeat purchase rates. Stores still must match market promotions and competitor discounts to retain price-sensitive customers.
- Channel reach: nationwide multi-hundred store footprint
- Data advantage: proprietary POS and CRM analytics
- Loyalty: drives repeat purchases and higher CLV
- Constraint: must follow market promo cycles
Low switching costs
Comparable styles across brands at similar price points make switching easy; 2024 retail reports note post-purchase service and delivery windows are primary purchase differentiators. Limited customization keeps substitution straightforward, while clear returns policies and warranties reduce perceived risk and amplify customer bargaining power.
- Comparable styles/price parity
- Delivery windows, warranty, service responsiveness
- Limited customization = easy substitution
- Returns policies lower perceived risk
Customers hold pricing power: $120B market, 20% online, 82% review consults
Customers exert high bargaining power: 20% of US furniture sales were online in 2024 and the US market was ~$120B, heightening price and service competition. Low switching costs, BNPL growth and 82% who consult reviews compress margins. Ashley's store network and proprietary data partially offset pressure but must match market promotions and delivery expectations.
| Metric | 2024 |
|---|---|
| US furniture market | $120B |
| Online share | 20% |
| Shoppers consulting reviews | 82% |
Same Document Delivered
Ashley Furniture Industries Porter's Five Forces Analysis
This preview shows the exact Ashley Furniture Industries Porter's Five Forces analysis you'll receive after purchase—no placeholders or mockups. The document is fully formatted, professionally written, and ready for immediate download and use upon payment. What you see is what you get.
Original: $10.00
-65%$10.00
$3.50Description
Don't Miss the Bigger Picture
Ashley Furniture Industries faces intense competitive rivalry from national and online retailers, moderate supplier leverage given scale, and variable buyer power driven by pricing sensitivity and brand preference. Threats from substitutes and new entrants are tempered by distribution strength and economies of scale. This brief snapshot only scratches the surface. Unlock the full Porter's Five Forces Analysis to explore Ashley Furniture Industries’s competitive dynamics in detail.
Suppliers Bargaining Power
Diverse commodity input base
Ashley draws lumber, foam, steel, textiles and hardware from broad global pools, keeping individual supplier leverage modest and enabling multi-sourcing and frequent bidding. Commodity inputs—lumber down roughly 40% from 2021 peaks by 2024—can still spike, temporarily boosting supplier influence. AFI’s use of hedging and multi-year contracts partially offsets price volatility and short-term supplier power.
Logistics and freight constraints
Container capacity shortfalls, port congestion and trucking tightness in 2024 amplified carriers and 3PLs bargaining power, with furniture’s bulky cubic profile making Ashley particularly freight-cost sensitive; nearshoring and distributed plants lower exposure but do not eliminate lane bottlenecks, and seasonal promotion surges (often >20% volume spikes) can rapidly strain capacity and push spot rates higher.
Specialty chemicals and machinery
PU foam chemicals, specialty adhesives and CNC/automation vendors are industry-concentrated—major chemical players supply key PU feedstocks—creating switching frictions; technical specs, industry certifications and high uptime requirements increase dependency. Long equipment replacement cycles (typically 5–10 years) and multi-year service contracts give these suppliers measurable bargaining room and pricing leverage.
Standards, ESG, and compliance
Legal-sourced timber requirements, emissions controls, and workplace-safety standards in 2024 sharply narrow AFI’s eligible supplier pool, boosting negotiating leverage of compliant mills; certifications and third-party audits (FSC/PEFC) increase supplier costs and slow substitution. AFI’s scale aids enforcement of codes across its supply chain but cannot eliminate upstream capacity or compliance constraints.
- Supply constraint: compliant mills hold superior bargaining power
- Cost impact: certifications and audits raise supplier operating costs
- Switching lag: certification timelines limit quick substitution
- Scale mitigant: AFI can enforce codes but not remove scarcity
Scale counterbalances power
Ashley Furniture’s scale — retail footprint of over 1,000 stores and annual sales exceeding 5 billion dollars — gives it leverage: centralized forecasting, aggregated buys and vendor scorecards drive down pricing and enforce service levels, while dual/multi-region sourcing plus supplier financing and VMI cut single‑point risk and improve terms.
Balance of power: moderating commodity prices vs high freight and specialty vendor leverage
Ashley faces generally moderate supplier power: commodity inputs benefit from broad sourcing (lumber prices down ~40% from 2021 peaks by 2024) but can spike, raising short‑term leverage. Freight/3PLs tightened in 2024, boosting carrier power amid >20% seasonal volume surges. Specialized chemicals, adhesives and CNC vendors exert high power due to concentration and 5–10 year equipment cycles; scale and aggregated buys partially offset this.
| Supplier | Power 2024 | Metric |
|---|---|---|
| Commodities (lumber/foam) | Moderate | Lumber -40% vs 2021 |
| Freight/3PL | High | Seasonal spikes >20% |
| Specialty chemicals/equipment | High | 5–10 yr cycles |
| Certified timber mills | High | Compliance narrows pool |
What is included in the product
Detailed Word Document
Tailored Porter’s Five Forces analysis of Ashley Furniture Industries assessing competitive rivalry, buyer and supplier power, threat of substitutes, and barriers to entry to identify the key drivers shaping pricing, margins, market share, and strategic vulnerabilities.
Customizable Excel Spreadsheet
A concise one-sheet Porter's Five Forces for Ashley Furniture that visualizes supplier/buyer power, rivalry, substitutes and entry threats with an interactive spider chart—customize pressure levels by market data and drop straight into decks for fast, board-ready decisions.
Customers Bargaining Power
Price-sensitive consumers
End customers compare aggressively across retailers and online—e-commerce accounted for roughly 20% of US furniture sales in 2024—putting downward pressure on Ashley's margins. Furniture is discretionary and promotion-driven, with peak promotion seasons compressing margins. Consumers expect financing and bundles; BNPL and in-store credit penetration rose in 2024, and low switching costs amplify buyer power.
Omnichannel transparency
Omnichannel transparency elevates customer bargaining: 82% of shoppers consult reviews and price-tracking/AR tools raise switching propensity, pressuring margins. Rapid delivery and free returns norms from e-commerce have pushed furniture delivery expectations; U.S. online furniture sales ~48 billion USD in 2023, intensifying speed competition. Visible lead times become a negotiation lever, and stockouts rapidly divert demand to rivals.
Independent retailer leverage
Wholesale partners can consolidate volume—Ashley leverages over 1,000 retailer locations—so chains secure co-op marketing and tougher terms; floor space allocation depends on sell-through and vendor support, often tied to performance metrics. Private-label alternatives pressure category mix and margins, while performance-based rebates are common asks, shifting effective pricing and working capital demands in a US furniture market near $120 billion in 2024.
Own retail moderates power
Ashley HomeStore channel captures retail margin and customer data, moderating external buyer leverage as Ashley remains the largest US furniture manufacturer by sales in 2024. Direct assortment and merchandising control let the company shape demand and price resilience, while loyalty programs lower churn and increase repeat purchase rates. Stores still must match market promotions and competitor discounts to retain price-sensitive customers.
- Channel reach: nationwide multi-hundred store footprint
- Data advantage: proprietary POS and CRM analytics
- Loyalty: drives repeat purchases and higher CLV
- Constraint: must follow market promo cycles
Low switching costs
Comparable styles across brands at similar price points make switching easy; 2024 retail reports note post-purchase service and delivery windows are primary purchase differentiators. Limited customization keeps substitution straightforward, while clear returns policies and warranties reduce perceived risk and amplify customer bargaining power.
- Comparable styles/price parity
- Delivery windows, warranty, service responsiveness
- Limited customization = easy substitution
- Returns policies lower perceived risk
Customers hold pricing power: $120B market, 20% online, 82% review consults
Customers exert high bargaining power: 20% of US furniture sales were online in 2024 and the US market was ~$120B, heightening price and service competition. Low switching costs, BNPL growth and 82% who consult reviews compress margins. Ashley's store network and proprietary data partially offset pressure but must match market promotions and delivery expectations.
| Metric | 2024 |
|---|---|
| US furniture market | $120B |
| Online share | 20% |
| Shoppers consulting reviews | 82% |
Same Document Delivered
Ashley Furniture Industries Porter's Five Forces Analysis
This preview shows the exact Ashley Furniture Industries Porter's Five Forces analysis you'll receive after purchase—no placeholders or mockups. The document is fully formatted, professionally written, and ready for immediate download and use upon payment. What you see is what you get.











