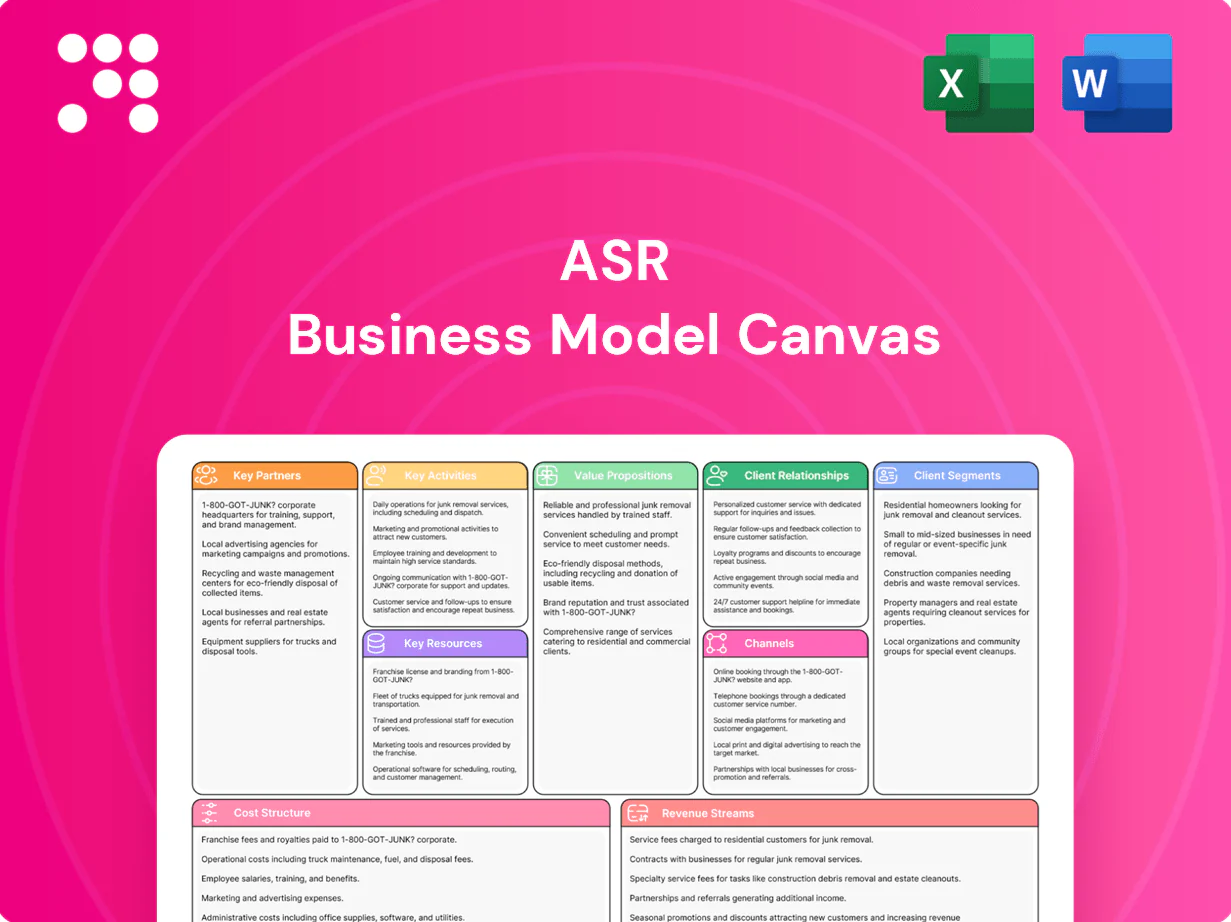
ASR Business Model Canvas

Unlock the Strategic Business Model Canvas for Rapid Value Creation and Investor Due Diligence
Unlock ASR’s strategic blueprint with our detailed Business Model Canvas, revealing how the company creates value, scales operations, and secures market share. This concise, professionally crafted canvas highlights customer segments, revenue streams, key partners, and cost drivers to support benchmarking or investor due diligence. Download the full Word/Excel package to get section-by-section insights and ready-to-use analysis for strategy or investment decisions.
Partnerships

Reinsurers
Reinsurers diversify and cap peak risks, enabling ASR to limit tail volatility and optimize Solvency II capital usage; market capacity tightened in 2023–2024, driving reinsurance rate increases roughly 10–25% in catastrophe-exposed classes. Long-term treaties secure layered catastrophe, life and health exposure and stabilize pricing across multi-year horizons. Partner selection emphasizes credit strength (typically A- or higher) and underwriting alignment to ensure capacity and claims cooperation.
Brokers and Intermediaries
Independent brokers expand ASRs market reach across retail and commercial lines, handling advisory sales and complex risk placement; commissions commonly range 5–15% on retail and are tiered for commercial to align incentives and service quality. 2024 industry analyses link enhanced data-sharing with underwriters to measurable retention gains and tighter loss ratios, improving placement accuracy and client stickiness.

Banks and Mortgage Distributors
Banks and mortgage distributors drive cross-sell via bancassurance and mortgage channels, giving ASR direct access to borrowers and savers and lifting conversion by about 20% and persistency by ~15% (industry 2024 benchmarks). Integrated digital journeys with partners increase completed sales and lifetime value; cooperation is governed by revenue-sharing models (typical splits near 70/30) and strict compliance frameworks.

Healthcare and Repair Networks
Healthcare and repair networks act as preferred provider networks that manage health and non-life claims, routing approximately 60–75% of cases through contracted partners in 2024 to ensure cost and quality control. Contracted hospitals, clinics, body shops and contractors reduce loss costs by an estimated 10–20% through negotiated rates and standardized repairs. Service-level agreements (SLAs) improve customer experience and turnaround times while continuous data loops feed pricing models and fraud-prevention engines, improving detection and pricing accuracy by roughly 10–15% in 2024.
- Network penetration: 60–75% of claims routed
- Loss cost reduction: 10–20%
- Pricing/fraud accuracy gains: ~10–15%
- Key partners: hospitals, clinics, body shops, contractors, TPAs
Technology, Data, and ESG Partners
Core system vendors, insurtechs, and data providers enable ASR’s digital operations while analytics, telematics, and AI refine risk selection and claims service, reducing loss ratios and speeding settlement cycles; cybersecurity firms guard uptime and sensitive data—IBM’s 2024 Cost of a Data Breach Report cites a $4.45M global average breach cost, underscoring risk.
- core-systems
- insurtech-data
- analytics-telematics-AI
- ESG-reporting
- cybersecurity
Reinsurance +10–25%, bancassurance +20% conversion; networks route 60–75% claims
Reinsurers cap tail risk; 2023–24 reinsurance rates rose 10–25% and multi‑year treaties secure capacity.
Brokers and bancassurance expand distribution; commissions 5–15%, bancassurance lifts conversion ~20% and persistency ~15% (2024).
Service networks and tech partners route 60–75% of claims, cut loss costs 10–20%; average data breach cost $4.45M (2024).
| Partner | Metric | 2024 |
|---|---|---|
| Reinsurers | Rate change | +10–25% |
| Brokers | Commission | 5–15% |
| Bancassurance | Conversion | +20% |
| Networks | Claims routed | 60–75% |
What is included in the product
 Detailed Word Document
A comprehensive ASR Business Model Canvas mapping the company’s real-world operations across the 9 classic BMC blocks, detailing customer segments, channels, value propositions, revenue streams, key resources and partners. Ideal for presentations and investor discussions, it includes SWOT-linked insights and competitive advantages to support strategic decisions and validation of business plans.

 Customizable Excel Spreadsheet
High-level, editable one-page ASR Business Model Canvas that quickly identifies core components, saves hours of formatting, and provides a clean, shareable layout ideal for team collaboration, boardrooms, and rapid executive summaries.
Activities

Underwriting and Pricing
Underwriting and pricing combine risk selection across life, non-life and health with actuarial models that in 2024 recalibrated loss trends and customer behavior using recent claims inflation; global insurance premiums were about 6.3 trillion USD in 2023 (Swiss Re), guiding portfolio steering to balance growth and profitability while governance ensures fairness, transparency and regulatory compliance.
Claims Management
Fast, fair claims handling drives loyalty and loss control: insurers reporting quicker FNOL and settlement see retention and satisfaction gains. Fraud, estimated to cost about 10% of P&C claims, is mitigated by triage and analytics; managed repair programs deliver industry savings often in the 10–20% range. Digital FNOL and straight-through processing have automated up to 70% of low-complexity claims, expediting settlements. Feedback loops refine products and wordings based on claim insights.

Asset and Capital Management
Investing premiums and reserves to generate yield is governed by strict risk limits and diversification mandates, while ALM actively matches duration and liquidity to projected liabilities to control interest-rate and cashflow risk. Solvency II capital optimization—designed around the 99.5% one-year SCR standard—safeguards resilience and capital efficiency. ESG integration influences allocation decisions and stewardship across fixed income and equity holdings.

Product and Distribution Development
- Modular products
- Omnichannel: direct, broker, bank
- Pricing engines & APIs: instant quotes/binds
- Continuous testing: +5 NPS, ~65% digital sales (2024)
Regulatory, Risk, and Compliance
Digital sales 65%, 70% STP, fraud ~10% — ALM & Solvency II
Underwriting, claims, investing and product distribution are core activities, driven by actuarial pricing, fast claims handling, ALM and omnichannel product delivery. Analytics reduce fraud (~10% of P&C claims) and enable 70% straight-through processing for simple claims. ALM and Solvency II guard capital adequacy while digital sales (~65% in 2024) and APIs speed acquisition and retention.
| Metric | Value |
|---|---|
| Global premiums (2023) | 6.3T USD |
| Digital sales (2024) | 65% |
| Fraud impact | ~10% P&C claims |
| Straight-through | 70% low-complexity |
Delivered as Displayed
Business Model Canvas
The document you're previewing is the exact ASR Business Model Canvas you'll receive after purchase, not a mockup or sample. When you complete your order you'll get the full, editable file formatted identically for immediate use in strategy, presentations, or team workshops. No placeholders, no hidden sections—what you see is what you'll download and own.

Unlock the Strategic Business Model Canvas for Rapid Value Creation and Investor Due Diligence
Unlock ASR’s strategic blueprint with our detailed Business Model Canvas, revealing how the company creates value, scales operations, and secures market share. This concise, professionally crafted canvas highlights customer segments, revenue streams, key partners, and cost drivers to support benchmarking or investor due diligence. Download the full Word/Excel package to get section-by-section insights and ready-to-use analysis for strategy or investment decisions.
Partnerships
Reinsurers
Reinsurers diversify and cap peak risks, enabling ASR to limit tail volatility and optimize Solvency II capital usage; market capacity tightened in 2023–2024, driving reinsurance rate increases roughly 10–25% in catastrophe-exposed classes. Long-term treaties secure layered catastrophe, life and health exposure and stabilize pricing across multi-year horizons. Partner selection emphasizes credit strength (typically A- or higher) and underwriting alignment to ensure capacity and claims cooperation.
Brokers and Intermediaries
Independent brokers expand ASRs market reach across retail and commercial lines, handling advisory sales and complex risk placement; commissions commonly range 5–15% on retail and are tiered for commercial to align incentives and service quality. 2024 industry analyses link enhanced data-sharing with underwriters to measurable retention gains and tighter loss ratios, improving placement accuracy and client stickiness.
Banks and Mortgage Distributors
Banks and mortgage distributors drive cross-sell via bancassurance and mortgage channels, giving ASR direct access to borrowers and savers and lifting conversion by about 20% and persistency by ~15% (industry 2024 benchmarks). Integrated digital journeys with partners increase completed sales and lifetime value; cooperation is governed by revenue-sharing models (typical splits near 70/30) and strict compliance frameworks.
Healthcare and Repair Networks
Healthcare and repair networks act as preferred provider networks that manage health and non-life claims, routing approximately 60–75% of cases through contracted partners in 2024 to ensure cost and quality control. Contracted hospitals, clinics, body shops and contractors reduce loss costs by an estimated 10–20% through negotiated rates and standardized repairs. Service-level agreements (SLAs) improve customer experience and turnaround times while continuous data loops feed pricing models and fraud-prevention engines, improving detection and pricing accuracy by roughly 10–15% in 2024.
- Network penetration: 60–75% of claims routed
- Loss cost reduction: 10–20%
- Pricing/fraud accuracy gains: ~10–15%
- Key partners: hospitals, clinics, body shops, contractors, TPAs
Technology, Data, and ESG Partners
Core system vendors, insurtechs, and data providers enable ASR’s digital operations while analytics, telematics, and AI refine risk selection and claims service, reducing loss ratios and speeding settlement cycles; cybersecurity firms guard uptime and sensitive data—IBM’s 2024 Cost of a Data Breach Report cites a $4.45M global average breach cost, underscoring risk.
- core-systems
- insurtech-data
- analytics-telematics-AI
- ESG-reporting
- cybersecurity
Reinsurance +10–25%, bancassurance +20% conversion; networks route 60–75% claims
Reinsurers cap tail risk; 2023–24 reinsurance rates rose 10–25% and multi‑year treaties secure capacity.
Brokers and bancassurance expand distribution; commissions 5–15%, bancassurance lifts conversion ~20% and persistency ~15% (2024).
Service networks and tech partners route 60–75% of claims, cut loss costs 10–20%; average data breach cost $4.45M (2024).
| Partner | Metric | 2024 |
|---|---|---|
| Reinsurers | Rate change | +10–25% |
| Brokers | Commission | 5–15% |
| Bancassurance | Conversion | +20% |
| Networks | Claims routed | 60–75% |
What is included in the product
Detailed Word Document
A comprehensive ASR Business Model Canvas mapping the company’s real-world operations across the 9 classic BMC blocks, detailing customer segments, channels, value propositions, revenue streams, key resources and partners. Ideal for presentations and investor discussions, it includes SWOT-linked insights and competitive advantages to support strategic decisions and validation of business plans.
Customizable Excel Spreadsheet
High-level, editable one-page ASR Business Model Canvas that quickly identifies core components, saves hours of formatting, and provides a clean, shareable layout ideal for team collaboration, boardrooms, and rapid executive summaries.
Activities
Underwriting and Pricing
Underwriting and pricing combine risk selection across life, non-life and health with actuarial models that in 2024 recalibrated loss trends and customer behavior using recent claims inflation; global insurance premiums were about 6.3 trillion USD in 2023 (Swiss Re), guiding portfolio steering to balance growth and profitability while governance ensures fairness, transparency and regulatory compliance.
Claims Management
Fast, fair claims handling drives loyalty and loss control: insurers reporting quicker FNOL and settlement see retention and satisfaction gains. Fraud, estimated to cost about 10% of P&C claims, is mitigated by triage and analytics; managed repair programs deliver industry savings often in the 10–20% range. Digital FNOL and straight-through processing have automated up to 70% of low-complexity claims, expediting settlements. Feedback loops refine products and wordings based on claim insights.
Asset and Capital Management
Investing premiums and reserves to generate yield is governed by strict risk limits and diversification mandates, while ALM actively matches duration and liquidity to projected liabilities to control interest-rate and cashflow risk. Solvency II capital optimization—designed around the 99.5% one-year SCR standard—safeguards resilience and capital efficiency. ESG integration influences allocation decisions and stewardship across fixed income and equity holdings.
Product and Distribution Development
- Modular products
- Omnichannel: direct, broker, bank
- Pricing engines & APIs: instant quotes/binds
- Continuous testing: +5 NPS, ~65% digital sales (2024)
Regulatory, Risk, and Compliance
Digital sales 65%, 70% STP, fraud ~10% — ALM & Solvency II
Underwriting, claims, investing and product distribution are core activities, driven by actuarial pricing, fast claims handling, ALM and omnichannel product delivery. Analytics reduce fraud (~10% of P&C claims) and enable 70% straight-through processing for simple claims. ALM and Solvency II guard capital adequacy while digital sales (~65% in 2024) and APIs speed acquisition and retention.
| Metric | Value |
|---|---|
| Global premiums (2023) | 6.3T USD |
| Digital sales (2024) | 65% |
| Fraud impact | ~10% P&C claims |
| Straight-through | 70% low-complexity |
Delivered as Displayed
Business Model Canvas
The document you're previewing is the exact ASR Business Model Canvas you'll receive after purchase, not a mockup or sample. When you complete your order you'll get the full, editable file formatted identically for immediate use in strategy, presentations, or team workshops. No placeholders, no hidden sections—what you see is what you'll download and own.
Description
Unlock the Strategic Business Model Canvas for Rapid Value Creation and Investor Due Diligence
Unlock ASR’s strategic blueprint with our detailed Business Model Canvas, revealing how the company creates value, scales operations, and secures market share. This concise, professionally crafted canvas highlights customer segments, revenue streams, key partners, and cost drivers to support benchmarking or investor due diligence. Download the full Word/Excel package to get section-by-section insights and ready-to-use analysis for strategy or investment decisions.
Partnerships
Reinsurers
Reinsurers diversify and cap peak risks, enabling ASR to limit tail volatility and optimize Solvency II capital usage; market capacity tightened in 2023–2024, driving reinsurance rate increases roughly 10–25% in catastrophe-exposed classes. Long-term treaties secure layered catastrophe, life and health exposure and stabilize pricing across multi-year horizons. Partner selection emphasizes credit strength (typically A- or higher) and underwriting alignment to ensure capacity and claims cooperation.
Brokers and Intermediaries
Independent brokers expand ASRs market reach across retail and commercial lines, handling advisory sales and complex risk placement; commissions commonly range 5–15% on retail and are tiered for commercial to align incentives and service quality. 2024 industry analyses link enhanced data-sharing with underwriters to measurable retention gains and tighter loss ratios, improving placement accuracy and client stickiness.
Banks and Mortgage Distributors
Banks and mortgage distributors drive cross-sell via bancassurance and mortgage channels, giving ASR direct access to borrowers and savers and lifting conversion by about 20% and persistency by ~15% (industry 2024 benchmarks). Integrated digital journeys with partners increase completed sales and lifetime value; cooperation is governed by revenue-sharing models (typical splits near 70/30) and strict compliance frameworks.
Healthcare and Repair Networks
Healthcare and repair networks act as preferred provider networks that manage health and non-life claims, routing approximately 60–75% of cases through contracted partners in 2024 to ensure cost and quality control. Contracted hospitals, clinics, body shops and contractors reduce loss costs by an estimated 10–20% through negotiated rates and standardized repairs. Service-level agreements (SLAs) improve customer experience and turnaround times while continuous data loops feed pricing models and fraud-prevention engines, improving detection and pricing accuracy by roughly 10–15% in 2024.
- Network penetration: 60–75% of claims routed
- Loss cost reduction: 10–20%
- Pricing/fraud accuracy gains: ~10–15%
- Key partners: hospitals, clinics, body shops, contractors, TPAs
Technology, Data, and ESG Partners
Core system vendors, insurtechs, and data providers enable ASR’s digital operations while analytics, telematics, and AI refine risk selection and claims service, reducing loss ratios and speeding settlement cycles; cybersecurity firms guard uptime and sensitive data—IBM’s 2024 Cost of a Data Breach Report cites a $4.45M global average breach cost, underscoring risk.
- core-systems
- insurtech-data
- analytics-telematics-AI
- ESG-reporting
- cybersecurity
Reinsurance +10–25%, bancassurance +20% conversion; networks route 60–75% claims
Reinsurers cap tail risk; 2023–24 reinsurance rates rose 10–25% and multi‑year treaties secure capacity.
Brokers and bancassurance expand distribution; commissions 5–15%, bancassurance lifts conversion ~20% and persistency ~15% (2024).
Service networks and tech partners route 60–75% of claims, cut loss costs 10–20%; average data breach cost $4.45M (2024).
| Partner | Metric | 2024 |
|---|---|---|
| Reinsurers | Rate change | +10–25% |
| Brokers | Commission | 5–15% |
| Bancassurance | Conversion | +20% |
| Networks | Claims routed | 60–75% |
What is included in the product
Detailed Word Document
A comprehensive ASR Business Model Canvas mapping the company’s real-world operations across the 9 classic BMC blocks, detailing customer segments, channels, value propositions, revenue streams, key resources and partners. Ideal for presentations and investor discussions, it includes SWOT-linked insights and competitive advantages to support strategic decisions and validation of business plans.
Customizable Excel Spreadsheet
High-level, editable one-page ASR Business Model Canvas that quickly identifies core components, saves hours of formatting, and provides a clean, shareable layout ideal for team collaboration, boardrooms, and rapid executive summaries.
Activities
Underwriting and Pricing
Underwriting and pricing combine risk selection across life, non-life and health with actuarial models that in 2024 recalibrated loss trends and customer behavior using recent claims inflation; global insurance premiums were about 6.3 trillion USD in 2023 (Swiss Re), guiding portfolio steering to balance growth and profitability while governance ensures fairness, transparency and regulatory compliance.
Claims Management
Fast, fair claims handling drives loyalty and loss control: insurers reporting quicker FNOL and settlement see retention and satisfaction gains. Fraud, estimated to cost about 10% of P&C claims, is mitigated by triage and analytics; managed repair programs deliver industry savings often in the 10–20% range. Digital FNOL and straight-through processing have automated up to 70% of low-complexity claims, expediting settlements. Feedback loops refine products and wordings based on claim insights.
Asset and Capital Management
Investing premiums and reserves to generate yield is governed by strict risk limits and diversification mandates, while ALM actively matches duration and liquidity to projected liabilities to control interest-rate and cashflow risk. Solvency II capital optimization—designed around the 99.5% one-year SCR standard—safeguards resilience and capital efficiency. ESG integration influences allocation decisions and stewardship across fixed income and equity holdings.
Product and Distribution Development
- Modular products
- Omnichannel: direct, broker, bank
- Pricing engines & APIs: instant quotes/binds
- Continuous testing: +5 NPS, ~65% digital sales (2024)
Regulatory, Risk, and Compliance
Digital sales 65%, 70% STP, fraud ~10% — ALM & Solvency II
Underwriting, claims, investing and product distribution are core activities, driven by actuarial pricing, fast claims handling, ALM and omnichannel product delivery. Analytics reduce fraud (~10% of P&C claims) and enable 70% straight-through processing for simple claims. ALM and Solvency II guard capital adequacy while digital sales (~65% in 2024) and APIs speed acquisition and retention.
| Metric | Value |
|---|---|
| Global premiums (2023) | 6.3T USD |
| Digital sales (2024) | 65% |
| Fraud impact | ~10% P&C claims |
| Straight-through | 70% low-complexity |
Delivered as Displayed
Business Model Canvas
The document you're previewing is the exact ASR Business Model Canvas you'll receive after purchase, not a mockup or sample. When you complete your order you'll get the full, editable file formatted identically for immediate use in strategy, presentations, or team workshops. No placeholders, no hidden sections—what you see is what you'll download and own.











