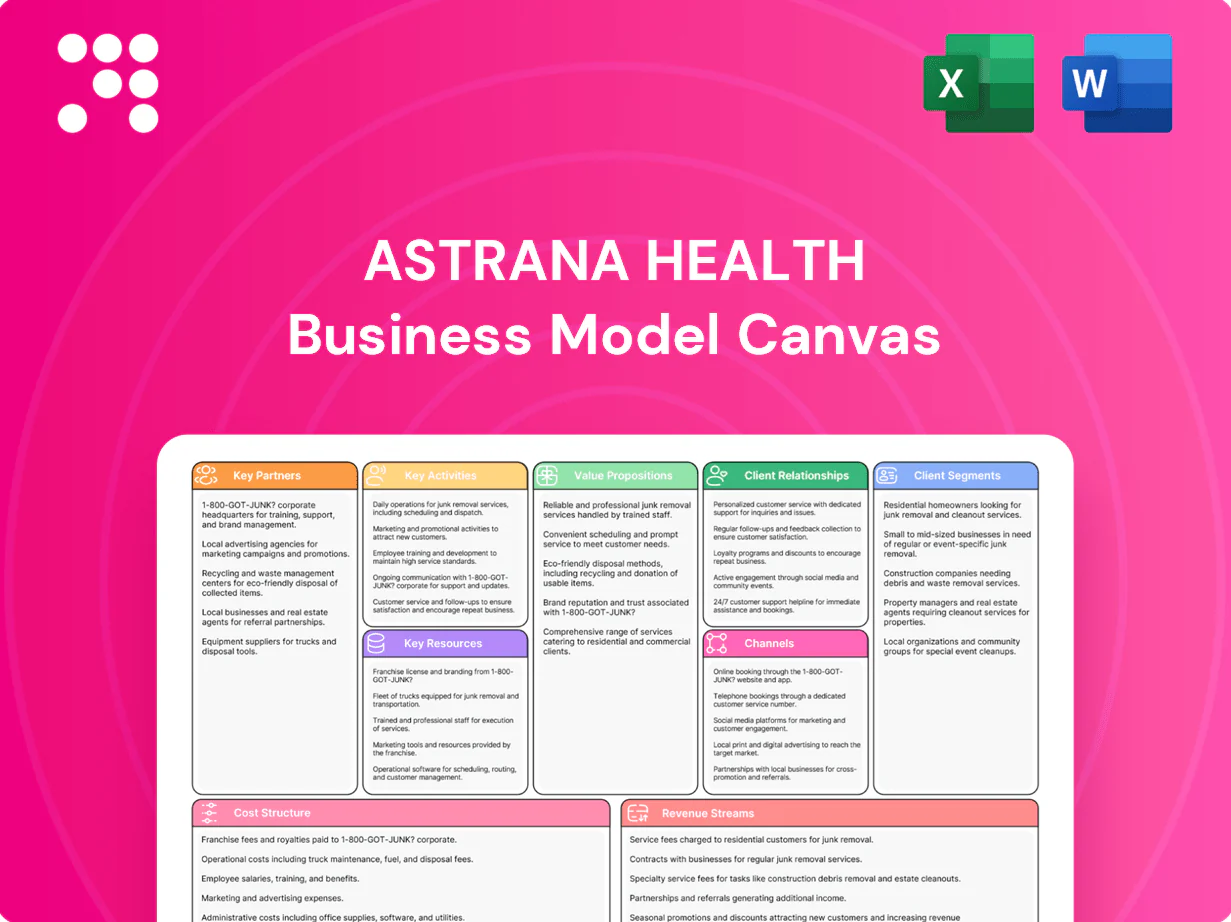
Astrana Health Business Model Canvas

Business Model Canvas: 3 Value Propositions, Target Segments & Scalability Levers
Unlock the full strategic blueprint behind Astrana Health with our Business Model Canvas: three clear value propositions, precise customer segments, and the scalability levers that drive revenue and retention. This professional, editable canvas is ideal for investors, consultants, and founders seeking actionable insights. Download the complete Word and Excel files to benchmark, adapt, and accelerate your strategy.
Partnerships

Managed care payers
Contracts with Medicare Advantage (≈32 million enrollees in 2024), Medicaid managed care (covering ~69% of Medicaid beneficiaries in 2024), and commercial plans underpin capitated and value‑based arrangements, delivering predictable PMPM revenue and member attribution. Joint governance drives utilization targets and quality metrics, while deep payer ties enable geographic expansion and stronger contract renegotiation leverage.
Independent physicians & IPAs
Astrana relies on primary care physicians, specialists and IPAs to deliver coordinated care, with primary care accounting for roughly 50% of ambulatory visits in the US, anchoring patient flow. Alignment is built via incentive contracts, standardized clinical pathways and shared-savings arrangements that target 2–4% total-cost-of-care reductions. Credentialing and network adequacy are co-managed to maintain access and compliance, while physician leaders shape care models and service design.

Hospitals & health systems
Partnerships with hospitals and health systems secure admissions management, preferred referral pathways, and coordinated discharge planning to improve throughput and capture referral revenue. Co-developed protocols target a reduction in 30-day readmissions versus the US Medicare baseline of about 15%, with transitional-care programs showing up to ~25% readmission reductions in meta-analyses. Timely data-sharing accelerates transitions of care and strategic affiliations expand service coverage and specialty depth.

Ancillary providers & post-acute
Alliances with labs, imaging, home health, SNFs, and behavioral health close care gaps and target the ~15% national 30-day readmission rate by coordinating transitions and shared care plans. Rate and quality agreements steer cost-effective utilization, while integrated scheduling and e-ordering cut delays and administrative waste. Continuous performance monitoring tracks outcomes and reduces variation.
- Close gaps: coordinated transitions
- Cost control: rate/quality contracts
- Throughput: integrated scheduling/e-orders
- Outcomes: performance monitoring
Health IT and analytics vendors
Health IT and analytics vendors—EHRs, HIEs, risk stratification and claims-analytics—drive population health; the global health analytics market was estimated near $38B in 2024, underpinning ROI from reduced readmissions and cost-to-serve. Interoperability partners (growing FHIR adoption in 2024) enable near-real-time insights, while cybersecurity and cloud providers support resilience and HIPAA compliance. Tech collaborations accelerate product roadmaps and automation, shaving deployment times and integration costs.
- EHR/HIE: real-time data flow
- Risk stratification: targeted outreach
- Claims analytics: cost visibility
- Cyber/cloud: resilience & compliance
- Tech partners: faster roadmap & automation
Payers, providers & tech align for 2–4% TCOC cuts, 32M MA reach
Astrana's payer, provider, post-acute, and tech partners secure capitated revenue, coordinated care pathways, and analytics-driven population health, targeting 2–4% TCOC reductions and fewer 30-day readmissions. Medicare Advantage (≈32M enrollees in 2024) and Medicaid MCO coverage (~69% of beneficiaries in 2024) underpin scale and PMPM predictability. Integrated EHR/HIE and analytics (health analytics market ≈$38B in 2024) enable real-time risk stratification.
| Partner | Role | 2024 metric |
|---|---|---|
| Payers | Capitation/value-based | MA 32M enrollees |
| Providers | Care delivery | Primary care ~50% visits |
| Tech | Analytics/interop | $38B market |
What is included in the product
 Detailed Word Document
A concise, investor-ready Business Model Canvas for Astrana Health covering all nine BMC blocks—customer segments, value propositions, channels, customer relationships, revenue streams, key resources, key activities, key partners, and cost structure—with practical narratives and competitive analysis. Designed for presentations, funding discussions, and strategic decision-making, including linked SWOT insights and validation against real-world operations.

 Customizable Excel Spreadsheet
High-level, editable Business Model Canvas for Astrana Health that quickly relieves the pain of misaligned strategy by condensing care delivery, revenue streams, and partnerships into a single, shareable page for fast stakeholder alignment and decision-making.
Activities

Care coordination & navigation
Multidisciplinary teams orchestrate patient journeys across settings, reducing 30-day readmissions by up to 20% in coordinated-care programs. Outreach focuses on high-risk and rising-risk cohorts—top 5% of patients account for nearly 50% of healthcare costs—enabling targeted interventions. Standardized medication reconciliation, referrals, and follow-ups uncover medication discrepancies in over 50% of encounters. Social needs screening links patients to community resources to address nonclinical drivers of health.
Risk contracting & population health
Astrana designs and manages capitated and shared-risk arrangements, using attribution, risk scoring and panel optimization as core functions. Interventions are prioritized via predictive modeling tied to 2024 CMS Star and HEDIS targets. Performance is tracked continuously against cost metrics (PMPM) and quality benchmarks such as CMS Star ratings and HEDIS measures.

Utilization management
Pre-auth, concurrent review and post-acute placement reduce unnecessary spend by steering care to guideline-based options; appropriate use criteria have cut low-value imaging by about 20% in real-world programs. Evidence-based guidelines drive consistent approvals and authorization accuracy. Peer-to-peer review improves provider alignment and acceptance. Denial-management data—initial claim denial rates averaging 5–10% in 2024—feeds continuous improvement.

Quality measurement & compliance
Programs target HEDIS (more than 90 measures) and CMS Stars (1–5 scale) to secure quality bonus payments; gap-closure campaigns raise measure completion and HEDIS rates. Rigorous coding accuracy and documentation integrity are enforced via audits and targeted training. Audits and education reduce compliance risk and align incentives for value-based contracts.
- HEDIS: >90 measures
- CMS Stars: 1-5
- Gap-closure: boosts completion
- Audits+training: risk mitigation
Provider network management
Provider network management focuses on recruitment, credentialing, and contracting to sustain access and adequacy; with Medicare Advantage enrollment exceeding 30 million in 2024, network sufficiency is critical. Performance dashboards drive coaching and incentive payments; clinical pathway adoption is reinforced via targeted education. Dispute resolution and closed feedback loops maintain provider engagement.
- Recruitment: timely credentialing reduces onboarding from months to weeks
- Dashboards: track utilization, quality, and costs
- Education: boosts pathway adherence
- Feedback: resolves disputes, retains providers
Multidisciplinary care cuts 30-day readmissions up to 20%, targets top 5%
Multidisciplinary teams coordinate care, cutting 30-day readmissions up to 20% and targeting top 5% who drive ~50% of costs. Medication reconciliation finds discrepancies in >50% of encounters; social needs screening connects to community resources. Value management (pre-auth, concurrent review) reduced low-value imaging ~20%; denial rates 5–10% in 2024. Provider network supports MA access amid >30M MA enrollees in 2024.
| Metric | 2024 Value |
|---|---|
| 30-day readmission reduction | up to 20% |
| Top-cost cohort | Top 5% ≈50% costs |
| Medication discrepancies | >50% |
| Low-value imaging | −20% |
| Denial rate | 5–10% |
| Medicare Advantage enrollment | >30M |
Full Version Awaits
Business Model Canvas
The document you're previewing is the exact Astrana Health Business Model Canvas you'll receive—it's not a mockup. Upon purchase you'll get this same complete, editable file ready for download in Word and Excel. No surprises: full content, formatting, and pages included.

Business Model Canvas: 3 Value Propositions, Target Segments & Scalability Levers
Unlock the full strategic blueprint behind Astrana Health with our Business Model Canvas: three clear value propositions, precise customer segments, and the scalability levers that drive revenue and retention. This professional, editable canvas is ideal for investors, consultants, and founders seeking actionable insights. Download the complete Word and Excel files to benchmark, adapt, and accelerate your strategy.
Partnerships
Managed care payers
Contracts with Medicare Advantage (≈32 million enrollees in 2024), Medicaid managed care (covering ~69% of Medicaid beneficiaries in 2024), and commercial plans underpin capitated and value‑based arrangements, delivering predictable PMPM revenue and member attribution. Joint governance drives utilization targets and quality metrics, while deep payer ties enable geographic expansion and stronger contract renegotiation leverage.
Independent physicians & IPAs
Astrana relies on primary care physicians, specialists and IPAs to deliver coordinated care, with primary care accounting for roughly 50% of ambulatory visits in the US, anchoring patient flow. Alignment is built via incentive contracts, standardized clinical pathways and shared-savings arrangements that target 2–4% total-cost-of-care reductions. Credentialing and network adequacy are co-managed to maintain access and compliance, while physician leaders shape care models and service design.
Hospitals & health systems
Partnerships with hospitals and health systems secure admissions management, preferred referral pathways, and coordinated discharge planning to improve throughput and capture referral revenue. Co-developed protocols target a reduction in 30-day readmissions versus the US Medicare baseline of about 15%, with transitional-care programs showing up to ~25% readmission reductions in meta-analyses. Timely data-sharing accelerates transitions of care and strategic affiliations expand service coverage and specialty depth.
Ancillary providers & post-acute
Alliances with labs, imaging, home health, SNFs, and behavioral health close care gaps and target the ~15% national 30-day readmission rate by coordinating transitions and shared care plans. Rate and quality agreements steer cost-effective utilization, while integrated scheduling and e-ordering cut delays and administrative waste. Continuous performance monitoring tracks outcomes and reduces variation.
- Close gaps: coordinated transitions
- Cost control: rate/quality contracts
- Throughput: integrated scheduling/e-orders
- Outcomes: performance monitoring
Health IT and analytics vendors
Health IT and analytics vendors—EHRs, HIEs, risk stratification and claims-analytics—drive population health; the global health analytics market was estimated near $38B in 2024, underpinning ROI from reduced readmissions and cost-to-serve. Interoperability partners (growing FHIR adoption in 2024) enable near-real-time insights, while cybersecurity and cloud providers support resilience and HIPAA compliance. Tech collaborations accelerate product roadmaps and automation, shaving deployment times and integration costs.
- EHR/HIE: real-time data flow
- Risk stratification: targeted outreach
- Claims analytics: cost visibility
- Cyber/cloud: resilience & compliance
- Tech partners: faster roadmap & automation
Payers, providers & tech align for 2–4% TCOC cuts, 32M MA reach
Astrana's payer, provider, post-acute, and tech partners secure capitated revenue, coordinated care pathways, and analytics-driven population health, targeting 2–4% TCOC reductions and fewer 30-day readmissions. Medicare Advantage (≈32M enrollees in 2024) and Medicaid MCO coverage (~69% of beneficiaries in 2024) underpin scale and PMPM predictability. Integrated EHR/HIE and analytics (health analytics market ≈$38B in 2024) enable real-time risk stratification.
| Partner | Role | 2024 metric |
|---|---|---|
| Payers | Capitation/value-based | MA 32M enrollees |
| Providers | Care delivery | Primary care ~50% visits |
| Tech | Analytics/interop | $38B market |
What is included in the product
Detailed Word Document
A concise, investor-ready Business Model Canvas for Astrana Health covering all nine BMC blocks—customer segments, value propositions, channels, customer relationships, revenue streams, key resources, key activities, key partners, and cost structure—with practical narratives and competitive analysis. Designed for presentations, funding discussions, and strategic decision-making, including linked SWOT insights and validation against real-world operations.
Customizable Excel Spreadsheet
High-level, editable Business Model Canvas for Astrana Health that quickly relieves the pain of misaligned strategy by condensing care delivery, revenue streams, and partnerships into a single, shareable page for fast stakeholder alignment and decision-making.
Activities
Care coordination & navigation
Multidisciplinary teams orchestrate patient journeys across settings, reducing 30-day readmissions by up to 20% in coordinated-care programs. Outreach focuses on high-risk and rising-risk cohorts—top 5% of patients account for nearly 50% of healthcare costs—enabling targeted interventions. Standardized medication reconciliation, referrals, and follow-ups uncover medication discrepancies in over 50% of encounters. Social needs screening links patients to community resources to address nonclinical drivers of health.
Risk contracting & population health
Astrana designs and manages capitated and shared-risk arrangements, using attribution, risk scoring and panel optimization as core functions. Interventions are prioritized via predictive modeling tied to 2024 CMS Star and HEDIS targets. Performance is tracked continuously against cost metrics (PMPM) and quality benchmarks such as CMS Star ratings and HEDIS measures.
Utilization management
Pre-auth, concurrent review and post-acute placement reduce unnecessary spend by steering care to guideline-based options; appropriate use criteria have cut low-value imaging by about 20% in real-world programs. Evidence-based guidelines drive consistent approvals and authorization accuracy. Peer-to-peer review improves provider alignment and acceptance. Denial-management data—initial claim denial rates averaging 5–10% in 2024—feeds continuous improvement.
Quality measurement & compliance
Programs target HEDIS (more than 90 measures) and CMS Stars (1–5 scale) to secure quality bonus payments; gap-closure campaigns raise measure completion and HEDIS rates. Rigorous coding accuracy and documentation integrity are enforced via audits and targeted training. Audits and education reduce compliance risk and align incentives for value-based contracts.
- HEDIS: >90 measures
- CMS Stars: 1-5
- Gap-closure: boosts completion
- Audits+training: risk mitigation
Provider network management
Provider network management focuses on recruitment, credentialing, and contracting to sustain access and adequacy; with Medicare Advantage enrollment exceeding 30 million in 2024, network sufficiency is critical. Performance dashboards drive coaching and incentive payments; clinical pathway adoption is reinforced via targeted education. Dispute resolution and closed feedback loops maintain provider engagement.
- Recruitment: timely credentialing reduces onboarding from months to weeks
- Dashboards: track utilization, quality, and costs
- Education: boosts pathway adherence
- Feedback: resolves disputes, retains providers
Multidisciplinary care cuts 30-day readmissions up to 20%, targets top 5%
Multidisciplinary teams coordinate care, cutting 30-day readmissions up to 20% and targeting top 5% who drive ~50% of costs. Medication reconciliation finds discrepancies in >50% of encounters; social needs screening connects to community resources. Value management (pre-auth, concurrent review) reduced low-value imaging ~20%; denial rates 5–10% in 2024. Provider network supports MA access amid >30M MA enrollees in 2024.
| Metric | 2024 Value |
|---|---|
| 30-day readmission reduction | up to 20% |
| Top-cost cohort | Top 5% ≈50% costs |
| Medication discrepancies | >50% |
| Low-value imaging | −20% |
| Denial rate | 5–10% |
| Medicare Advantage enrollment | >30M |
Full Version Awaits
Business Model Canvas
The document you're previewing is the exact Astrana Health Business Model Canvas you'll receive—it's not a mockup. Upon purchase you'll get this same complete, editable file ready for download in Word and Excel. No surprises: full content, formatting, and pages included.
Original: $10.00
-65%$10.00
$3.50Description
Business Model Canvas: 3 Value Propositions, Target Segments & Scalability Levers
Unlock the full strategic blueprint behind Astrana Health with our Business Model Canvas: three clear value propositions, precise customer segments, and the scalability levers that drive revenue and retention. This professional, editable canvas is ideal for investors, consultants, and founders seeking actionable insights. Download the complete Word and Excel files to benchmark, adapt, and accelerate your strategy.
Partnerships
Managed care payers
Contracts with Medicare Advantage (≈32 million enrollees in 2024), Medicaid managed care (covering ~69% of Medicaid beneficiaries in 2024), and commercial plans underpin capitated and value‑based arrangements, delivering predictable PMPM revenue and member attribution. Joint governance drives utilization targets and quality metrics, while deep payer ties enable geographic expansion and stronger contract renegotiation leverage.
Independent physicians & IPAs
Astrana relies on primary care physicians, specialists and IPAs to deliver coordinated care, with primary care accounting for roughly 50% of ambulatory visits in the US, anchoring patient flow. Alignment is built via incentive contracts, standardized clinical pathways and shared-savings arrangements that target 2–4% total-cost-of-care reductions. Credentialing and network adequacy are co-managed to maintain access and compliance, while physician leaders shape care models and service design.
Hospitals & health systems
Partnerships with hospitals and health systems secure admissions management, preferred referral pathways, and coordinated discharge planning to improve throughput and capture referral revenue. Co-developed protocols target a reduction in 30-day readmissions versus the US Medicare baseline of about 15%, with transitional-care programs showing up to ~25% readmission reductions in meta-analyses. Timely data-sharing accelerates transitions of care and strategic affiliations expand service coverage and specialty depth.
Ancillary providers & post-acute
Alliances with labs, imaging, home health, SNFs, and behavioral health close care gaps and target the ~15% national 30-day readmission rate by coordinating transitions and shared care plans. Rate and quality agreements steer cost-effective utilization, while integrated scheduling and e-ordering cut delays and administrative waste. Continuous performance monitoring tracks outcomes and reduces variation.
- Close gaps: coordinated transitions
- Cost control: rate/quality contracts
- Throughput: integrated scheduling/e-orders
- Outcomes: performance monitoring
Health IT and analytics vendors
Health IT and analytics vendors—EHRs, HIEs, risk stratification and claims-analytics—drive population health; the global health analytics market was estimated near $38B in 2024, underpinning ROI from reduced readmissions and cost-to-serve. Interoperability partners (growing FHIR adoption in 2024) enable near-real-time insights, while cybersecurity and cloud providers support resilience and HIPAA compliance. Tech collaborations accelerate product roadmaps and automation, shaving deployment times and integration costs.
- EHR/HIE: real-time data flow
- Risk stratification: targeted outreach
- Claims analytics: cost visibility
- Cyber/cloud: resilience & compliance
- Tech partners: faster roadmap & automation
Payers, providers & tech align for 2–4% TCOC cuts, 32M MA reach
Astrana's payer, provider, post-acute, and tech partners secure capitated revenue, coordinated care pathways, and analytics-driven population health, targeting 2–4% TCOC reductions and fewer 30-day readmissions. Medicare Advantage (≈32M enrollees in 2024) and Medicaid MCO coverage (~69% of beneficiaries in 2024) underpin scale and PMPM predictability. Integrated EHR/HIE and analytics (health analytics market ≈$38B in 2024) enable real-time risk stratification.
| Partner | Role | 2024 metric |
|---|---|---|
| Payers | Capitation/value-based | MA 32M enrollees |
| Providers | Care delivery | Primary care ~50% visits |
| Tech | Analytics/interop | $38B market |
What is included in the product
Detailed Word Document
A concise, investor-ready Business Model Canvas for Astrana Health covering all nine BMC blocks—customer segments, value propositions, channels, customer relationships, revenue streams, key resources, key activities, key partners, and cost structure—with practical narratives and competitive analysis. Designed for presentations, funding discussions, and strategic decision-making, including linked SWOT insights and validation against real-world operations.
Customizable Excel Spreadsheet
High-level, editable Business Model Canvas for Astrana Health that quickly relieves the pain of misaligned strategy by condensing care delivery, revenue streams, and partnerships into a single, shareable page for fast stakeholder alignment and decision-making.
Activities
Care coordination & navigation
Multidisciplinary teams orchestrate patient journeys across settings, reducing 30-day readmissions by up to 20% in coordinated-care programs. Outreach focuses on high-risk and rising-risk cohorts—top 5% of patients account for nearly 50% of healthcare costs—enabling targeted interventions. Standardized medication reconciliation, referrals, and follow-ups uncover medication discrepancies in over 50% of encounters. Social needs screening links patients to community resources to address nonclinical drivers of health.
Risk contracting & population health
Astrana designs and manages capitated and shared-risk arrangements, using attribution, risk scoring and panel optimization as core functions. Interventions are prioritized via predictive modeling tied to 2024 CMS Star and HEDIS targets. Performance is tracked continuously against cost metrics (PMPM) and quality benchmarks such as CMS Star ratings and HEDIS measures.
Utilization management
Pre-auth, concurrent review and post-acute placement reduce unnecessary spend by steering care to guideline-based options; appropriate use criteria have cut low-value imaging by about 20% in real-world programs. Evidence-based guidelines drive consistent approvals and authorization accuracy. Peer-to-peer review improves provider alignment and acceptance. Denial-management data—initial claim denial rates averaging 5–10% in 2024—feeds continuous improvement.
Quality measurement & compliance
Programs target HEDIS (more than 90 measures) and CMS Stars (1–5 scale) to secure quality bonus payments; gap-closure campaigns raise measure completion and HEDIS rates. Rigorous coding accuracy and documentation integrity are enforced via audits and targeted training. Audits and education reduce compliance risk and align incentives for value-based contracts.
- HEDIS: >90 measures
- CMS Stars: 1-5
- Gap-closure: boosts completion
- Audits+training: risk mitigation
Provider network management
Provider network management focuses on recruitment, credentialing, and contracting to sustain access and adequacy; with Medicare Advantage enrollment exceeding 30 million in 2024, network sufficiency is critical. Performance dashboards drive coaching and incentive payments; clinical pathway adoption is reinforced via targeted education. Dispute resolution and closed feedback loops maintain provider engagement.
- Recruitment: timely credentialing reduces onboarding from months to weeks
- Dashboards: track utilization, quality, and costs
- Education: boosts pathway adherence
- Feedback: resolves disputes, retains providers
Multidisciplinary care cuts 30-day readmissions up to 20%, targets top 5%
Multidisciplinary teams coordinate care, cutting 30-day readmissions up to 20% and targeting top 5% who drive ~50% of costs. Medication reconciliation finds discrepancies in >50% of encounters; social needs screening connects to community resources. Value management (pre-auth, concurrent review) reduced low-value imaging ~20%; denial rates 5–10% in 2024. Provider network supports MA access amid >30M MA enrollees in 2024.
| Metric | 2024 Value |
|---|---|
| 30-day readmission reduction | up to 20% |
| Top-cost cohort | Top 5% ≈50% costs |
| Medication discrepancies | >50% |
| Low-value imaging | −20% |
| Denial rate | 5–10% |
| Medicare Advantage enrollment | >30M |
Full Version Awaits
Business Model Canvas
The document you're previewing is the exact Astrana Health Business Model Canvas you'll receive—it's not a mockup. Upon purchase you'll get this same complete, editable file ready for download in Word and Excel. No surprises: full content, formatting, and pages included.











