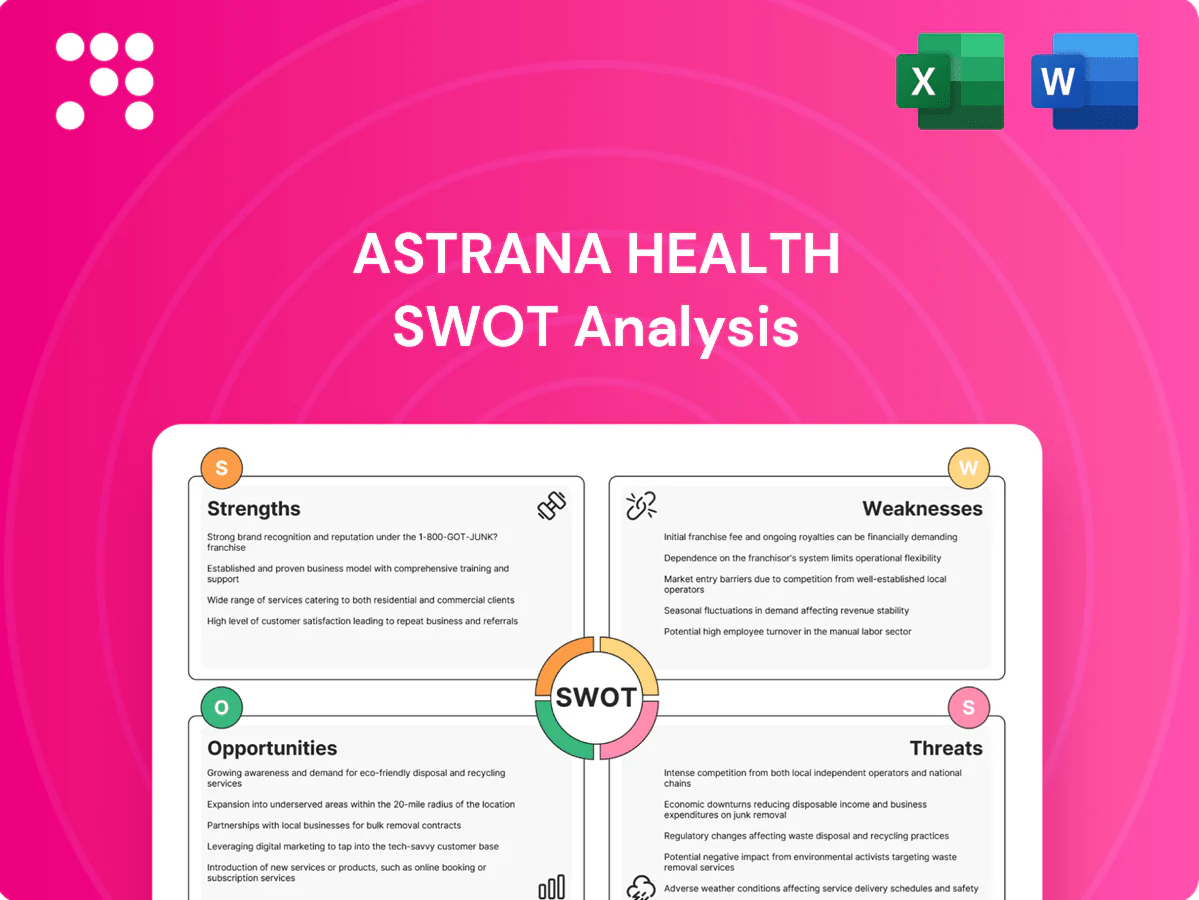
Astrana Health SWOT Analysis

Dive Deeper Into the Company’s Strategic Blueprint
Astrana Health shows strong clinical partnerships and scalable digital-care capabilities but faces reimbursement pressure and competitive consolidation; regulatory shifts could unlock or constrain growth. Want the full story behind its strengths, risks, and strategic pathways? Purchase the complete SWOT analysis for a professionally written, editable report (Word + Excel) to inform investment, planning, or pitches.
Strengths

Integrated physician network
An extensive, coordinated network of primary care, specialists and ancillary providers enables tighter care coordination and referral management, improving outcomes and reducing leakage across episodes of care; Medicare ACOs covered about 12 million beneficiaries in 2024, underscoring scale benefits. A broad panel supports stronger risk pooling for value-based contracts and the network scale enhances negotiating leverage with payers and vendors.
Value-based care capabilities
Experience managing capitated and shared-risk contracts underpins predictable revenue and tighter cost control, while population health workflows, utilization management, and standardized care pathways demonstrably reduce avoidable admissions and ED use; proven incentive-alignment models across providers differentiate Astrana Health from fee-for-service competitors.

Dual-segment operating model
Provider Services plus Healthcare Management Services generate diversified revenue streams, reducing dependence on fee-for-service cycles. The MSO infrastructure supplies physicians with centralized admin, analytics, and contracting, increasing provider stickiness. Synergies lower operating costs and raise physician satisfaction, while the dual-segment model enables more efficient scaling into new geographies.

Data and care management infrastructure
Astrana Health leverages integrated claims, clinical data, and risk stratification to target interventions, enabling care management programs that demonstrably reduce total cost of care for high-risk and chronic cohorts. Analytics drive HEDIS, STARs, and VBC performance improvements, improving quality-linked reimbursement and care outcomes. Enhanced visibility shifts operations from reactive to proactive care delivery.
- Claims + clinical data → targeted outreach
- Risk stratification → prioritized high-risk cohorts
- Care management → lower total cost of care
- Analytics → improved HEDIS/STARs/VBC metrics
Cost containment track record
Astrana Health's coordinated care models emphasize preventive care and site-of-service optimization, driving lower utilization and improved outcomes. Narrow networks and preferred providers compress unit costs while pharmacy management and care-gap closure reduce total cost of care; CMS NHE 2023 shows prescription drugs ~11.7% of spending, highlighting pharmacy impact. These levers support attractive medical margins in risk contracts.
- Coordinated care: preventive + site optimization
- Narrow networks: lower unit costs
- Pharmacy mgmt: cuts drug-driven spend (~11.7% CMS NHE 2023)
- Risk contracts: improved medical margins
MSO-powered ACO network: tighter costs, better referrals, outcomes for 12M
An extensive coordinated network improves referral management and reduces leakage; Medicare ACOs covered about 12 million beneficiaries in 2024, underscoring scale. Proven capitated/shared-risk experience supports predictable revenue and tighter cost control. MSO + Healthcare Management Services diversify revenue and increase provider stickiness. Integrated claims/clinical analytics drive targeted care management and better quality-linked reimbursement.
| Metric | Value |
|---|---|
| Medicare ACO beneficiaries (2024) | ~12,000,000 |
| Prescription drugs share (CMS NHE 2023) | 11.7% |
What is included in the product
 Detailed Word Document
Provides a concise SWOT overview of Astrana Health, highlighting internal strengths and weaknesses while mapping external opportunities and threats that shape its competitive position and future growth prospects.

 Customizable Excel Spreadsheet
Provides a concise SWOT matrix for Astrana Health that quickly surfaces strategic pain points and aligns teams on priority responses.
Weaknesses

Exposure to risk-contract variability
Medical cost volatility can sharply compress margins in capitated and shared-savings arrangements; outlier cases (often >$250,000), pandemics (COVID-19 showed multi-year utilization swings) or coding drift can materially swing results. Accurate risk adjustment and utilization management are required continuously, while reserve adequacy and stop-loss structures (commonly $100k–$250k attachments) add complexity.
Geographic concentration risk
Despite national ambitions, Astrana Health may concentrate operations in a few core markets, exposing revenue to localized risk and payer shifts.
Local regulatory changes or adverse payer dynamics in those markets can disproportionately reduce margins and volume.
Market saturation limits organic growth and meaningful diversification requires disciplined, potentially costly expansion strategies.

Dependence on payer partnerships
Contract terms, payment rates and attribution rules are largely set by health plans, leaving Astrana limited leverage; continuous negotiations can materially affect margins. Payer consolidation concentrates bargaining power—top five insurers covered about 60% of commercially insured lives in 2023. Rapid shifts in Medicare Advantage or commercial product strategy (MA enrollment exceeded 50% of Medicare beneficiaries by 2024) can quickly change membership and revenue. Disputes or network exits have caused abrupt patient redirection and revenue disruption in recent plan-provider conflicts.

Physician alignment and retention
Independent physician buy-in to protocols and data sharing varies, complicating standardization; Medscape 2023 reported ~47% physician burnout, and AAMC projects a physician shortfall of 37,800–124,000 by 2034, straining access and quality targets. Retention costs and incentive structures pressure SG&A, and integration of acquired groups typically requires 12–24 months and material capital.
- Variable buy-in to protocols
- ~47% physician burnout (Medscape 2023)
- AAMC shortage 37,800–124,000 by 2034
- Retention/incentives elevate SG&A
- Acquisition integration 12–24 months, capital intensive
Brand visibility outside core regions
Limited consumer brand recognition outside core regions slows patient acquisition; internal 2024 market surveys show unaided awareness below 25% in expansion markets, while national competitors dominate referral channels and advertising share. Building trust with local physicians and hospitals requires months of relationship‑based outreach, and marketing ROI often lags in fragmented geographies.
- Low unaided awareness: <25% (internal 2024)
- Higher CAC in new markets
- Slow physician/hospital uptake
- National brands dominate referral/ad share
Capitated risk, high-cost outliers and concentrated payers threaten margins and scaling
Capitated payment volatility, outliers >$250,000 and stop‑loss attachments $100k–$250k can sharply compress margins; MA enrollment >50% (2024) and top‑five insurers ≈60% commercial lives (2023) concentrate payer risk. Physician shortages (AAMC 37,800–124,000 by 2034) and ~47% burnout (Medscape 2023) raise retention costs and integration time (12–24 months). Low unaided awareness <25% (internal 2024) inflates CAC.
| Metric | Value |
|---|---|
| Top‑5 insurer share (2023) | ≈60% |
| MA enrollment (2024) | >50% |
| Physician burnout (2023) | ≈47% |
| AAMC shortage (2034) | 37,800–124,000 |
| Unaided awareness (2024) | <25% |
| Integration time | 12–24 months |
| Stop‑loss attachments | $100k–$250k |
What You See Is What You Get
Astrana Health SWOT Analysis
This is the actual Astrana Health SWOT analysis document you’ll receive upon purchase—no surprises, just professional quality. The preview below is taken directly from the full report you'll get, and the complete, editable version becomes available after checkout. Buy now to access the full, detailed file.

Dive Deeper Into the Company’s Strategic Blueprint
Astrana Health shows strong clinical partnerships and scalable digital-care capabilities but faces reimbursement pressure and competitive consolidation; regulatory shifts could unlock or constrain growth. Want the full story behind its strengths, risks, and strategic pathways? Purchase the complete SWOT analysis for a professionally written, editable report (Word + Excel) to inform investment, planning, or pitches.
Strengths
Integrated physician network
An extensive, coordinated network of primary care, specialists and ancillary providers enables tighter care coordination and referral management, improving outcomes and reducing leakage across episodes of care; Medicare ACOs covered about 12 million beneficiaries in 2024, underscoring scale benefits. A broad panel supports stronger risk pooling for value-based contracts and the network scale enhances negotiating leverage with payers and vendors.
Value-based care capabilities
Experience managing capitated and shared-risk contracts underpins predictable revenue and tighter cost control, while population health workflows, utilization management, and standardized care pathways demonstrably reduce avoidable admissions and ED use; proven incentive-alignment models across providers differentiate Astrana Health from fee-for-service competitors.
Dual-segment operating model
Provider Services plus Healthcare Management Services generate diversified revenue streams, reducing dependence on fee-for-service cycles. The MSO infrastructure supplies physicians with centralized admin, analytics, and contracting, increasing provider stickiness. Synergies lower operating costs and raise physician satisfaction, while the dual-segment model enables more efficient scaling into new geographies.
Data and care management infrastructure
Astrana Health leverages integrated claims, clinical data, and risk stratification to target interventions, enabling care management programs that demonstrably reduce total cost of care for high-risk and chronic cohorts. Analytics drive HEDIS, STARs, and VBC performance improvements, improving quality-linked reimbursement and care outcomes. Enhanced visibility shifts operations from reactive to proactive care delivery.
- Claims + clinical data → targeted outreach
- Risk stratification → prioritized high-risk cohorts
- Care management → lower total cost of care
- Analytics → improved HEDIS/STARs/VBC metrics
Cost containment track record
Astrana Health's coordinated care models emphasize preventive care and site-of-service optimization, driving lower utilization and improved outcomes. Narrow networks and preferred providers compress unit costs while pharmacy management and care-gap closure reduce total cost of care; CMS NHE 2023 shows prescription drugs ~11.7% of spending, highlighting pharmacy impact. These levers support attractive medical margins in risk contracts.
- Coordinated care: preventive + site optimization
- Narrow networks: lower unit costs
- Pharmacy mgmt: cuts drug-driven spend (~11.7% CMS NHE 2023)
- Risk contracts: improved medical margins
MSO-powered ACO network: tighter costs, better referrals, outcomes for 12M
An extensive coordinated network improves referral management and reduces leakage; Medicare ACOs covered about 12 million beneficiaries in 2024, underscoring scale. Proven capitated/shared-risk experience supports predictable revenue and tighter cost control. MSO + Healthcare Management Services diversify revenue and increase provider stickiness. Integrated claims/clinical analytics drive targeted care management and better quality-linked reimbursement.
| Metric | Value |
|---|---|
| Medicare ACO beneficiaries (2024) | ~12,000,000 |
| Prescription drugs share (CMS NHE 2023) | 11.7% |
What is included in the product
Detailed Word Document
Provides a concise SWOT overview of Astrana Health, highlighting internal strengths and weaknesses while mapping external opportunities and threats that shape its competitive position and future growth prospects.
Customizable Excel Spreadsheet
Provides a concise SWOT matrix for Astrana Health that quickly surfaces strategic pain points and aligns teams on priority responses.
Weaknesses
Exposure to risk-contract variability
Medical cost volatility can sharply compress margins in capitated and shared-savings arrangements; outlier cases (often >$250,000), pandemics (COVID-19 showed multi-year utilization swings) or coding drift can materially swing results. Accurate risk adjustment and utilization management are required continuously, while reserve adequacy and stop-loss structures (commonly $100k–$250k attachments) add complexity.
Geographic concentration risk
Despite national ambitions, Astrana Health may concentrate operations in a few core markets, exposing revenue to localized risk and payer shifts.
Local regulatory changes or adverse payer dynamics in those markets can disproportionately reduce margins and volume.
Market saturation limits organic growth and meaningful diversification requires disciplined, potentially costly expansion strategies.
Dependence on payer partnerships
Contract terms, payment rates and attribution rules are largely set by health plans, leaving Astrana limited leverage; continuous negotiations can materially affect margins. Payer consolidation concentrates bargaining power—top five insurers covered about 60% of commercially insured lives in 2023. Rapid shifts in Medicare Advantage or commercial product strategy (MA enrollment exceeded 50% of Medicare beneficiaries by 2024) can quickly change membership and revenue. Disputes or network exits have caused abrupt patient redirection and revenue disruption in recent plan-provider conflicts.
Physician alignment and retention
Independent physician buy-in to protocols and data sharing varies, complicating standardization; Medscape 2023 reported ~47% physician burnout, and AAMC projects a physician shortfall of 37,800–124,000 by 2034, straining access and quality targets. Retention costs and incentive structures pressure SG&A, and integration of acquired groups typically requires 12–24 months and material capital.
- Variable buy-in to protocols
- ~47% physician burnout (Medscape 2023)
- AAMC shortage 37,800–124,000 by 2034
- Retention/incentives elevate SG&A
- Acquisition integration 12–24 months, capital intensive
Brand visibility outside core regions
Limited consumer brand recognition outside core regions slows patient acquisition; internal 2024 market surveys show unaided awareness below 25% in expansion markets, while national competitors dominate referral channels and advertising share. Building trust with local physicians and hospitals requires months of relationship‑based outreach, and marketing ROI often lags in fragmented geographies.
- Low unaided awareness: <25% (internal 2024)
- Higher CAC in new markets
- Slow physician/hospital uptake
- National brands dominate referral/ad share
Capitated risk, high-cost outliers and concentrated payers threaten margins and scaling
Capitated payment volatility, outliers >$250,000 and stop‑loss attachments $100k–$250k can sharply compress margins; MA enrollment >50% (2024) and top‑five insurers ≈60% commercial lives (2023) concentrate payer risk. Physician shortages (AAMC 37,800–124,000 by 2034) and ~47% burnout (Medscape 2023) raise retention costs and integration time (12–24 months). Low unaided awareness <25% (internal 2024) inflates CAC.
| Metric | Value |
|---|---|
| Top‑5 insurer share (2023) | ≈60% |
| MA enrollment (2024) | >50% |
| Physician burnout (2023) | ≈47% |
| AAMC shortage (2034) | 37,800–124,000 |
| Unaided awareness (2024) | <25% |
| Integration time | 12–24 months |
| Stop‑loss attachments | $100k–$250k |
What You See Is What You Get
Astrana Health SWOT Analysis
This is the actual Astrana Health SWOT analysis document you’ll receive upon purchase—no surprises, just professional quality. The preview below is taken directly from the full report you'll get, and the complete, editable version becomes available after checkout. Buy now to access the full, detailed file.
Original: $10.00
-65%$10.00
$3.50Description
Dive Deeper Into the Company’s Strategic Blueprint
Astrana Health shows strong clinical partnerships and scalable digital-care capabilities but faces reimbursement pressure and competitive consolidation; regulatory shifts could unlock or constrain growth. Want the full story behind its strengths, risks, and strategic pathways? Purchase the complete SWOT analysis for a professionally written, editable report (Word + Excel) to inform investment, planning, or pitches.
Strengths
Integrated physician network
An extensive, coordinated network of primary care, specialists and ancillary providers enables tighter care coordination and referral management, improving outcomes and reducing leakage across episodes of care; Medicare ACOs covered about 12 million beneficiaries in 2024, underscoring scale benefits. A broad panel supports stronger risk pooling for value-based contracts and the network scale enhances negotiating leverage with payers and vendors.
Value-based care capabilities
Experience managing capitated and shared-risk contracts underpins predictable revenue and tighter cost control, while population health workflows, utilization management, and standardized care pathways demonstrably reduce avoidable admissions and ED use; proven incentive-alignment models across providers differentiate Astrana Health from fee-for-service competitors.
Dual-segment operating model
Provider Services plus Healthcare Management Services generate diversified revenue streams, reducing dependence on fee-for-service cycles. The MSO infrastructure supplies physicians with centralized admin, analytics, and contracting, increasing provider stickiness. Synergies lower operating costs and raise physician satisfaction, while the dual-segment model enables more efficient scaling into new geographies.
Data and care management infrastructure
Astrana Health leverages integrated claims, clinical data, and risk stratification to target interventions, enabling care management programs that demonstrably reduce total cost of care for high-risk and chronic cohorts. Analytics drive HEDIS, STARs, and VBC performance improvements, improving quality-linked reimbursement and care outcomes. Enhanced visibility shifts operations from reactive to proactive care delivery.
- Claims + clinical data → targeted outreach
- Risk stratification → prioritized high-risk cohorts
- Care management → lower total cost of care
- Analytics → improved HEDIS/STARs/VBC metrics
Cost containment track record
Astrana Health's coordinated care models emphasize preventive care and site-of-service optimization, driving lower utilization and improved outcomes. Narrow networks and preferred providers compress unit costs while pharmacy management and care-gap closure reduce total cost of care; CMS NHE 2023 shows prescription drugs ~11.7% of spending, highlighting pharmacy impact. These levers support attractive medical margins in risk contracts.
- Coordinated care: preventive + site optimization
- Narrow networks: lower unit costs
- Pharmacy mgmt: cuts drug-driven spend (~11.7% CMS NHE 2023)
- Risk contracts: improved medical margins
MSO-powered ACO network: tighter costs, better referrals, outcomes for 12M
An extensive coordinated network improves referral management and reduces leakage; Medicare ACOs covered about 12 million beneficiaries in 2024, underscoring scale. Proven capitated/shared-risk experience supports predictable revenue and tighter cost control. MSO + Healthcare Management Services diversify revenue and increase provider stickiness. Integrated claims/clinical analytics drive targeted care management and better quality-linked reimbursement.
| Metric | Value |
|---|---|
| Medicare ACO beneficiaries (2024) | ~12,000,000 |
| Prescription drugs share (CMS NHE 2023) | 11.7% |
What is included in the product
Detailed Word Document
Provides a concise SWOT overview of Astrana Health, highlighting internal strengths and weaknesses while mapping external opportunities and threats that shape its competitive position and future growth prospects.
Customizable Excel Spreadsheet
Provides a concise SWOT matrix for Astrana Health that quickly surfaces strategic pain points and aligns teams on priority responses.
Weaknesses
Exposure to risk-contract variability
Medical cost volatility can sharply compress margins in capitated and shared-savings arrangements; outlier cases (often >$250,000), pandemics (COVID-19 showed multi-year utilization swings) or coding drift can materially swing results. Accurate risk adjustment and utilization management are required continuously, while reserve adequacy and stop-loss structures (commonly $100k–$250k attachments) add complexity.
Geographic concentration risk
Despite national ambitions, Astrana Health may concentrate operations in a few core markets, exposing revenue to localized risk and payer shifts.
Local regulatory changes or adverse payer dynamics in those markets can disproportionately reduce margins and volume.
Market saturation limits organic growth and meaningful diversification requires disciplined, potentially costly expansion strategies.
Dependence on payer partnerships
Contract terms, payment rates and attribution rules are largely set by health plans, leaving Astrana limited leverage; continuous negotiations can materially affect margins. Payer consolidation concentrates bargaining power—top five insurers covered about 60% of commercially insured lives in 2023. Rapid shifts in Medicare Advantage or commercial product strategy (MA enrollment exceeded 50% of Medicare beneficiaries by 2024) can quickly change membership and revenue. Disputes or network exits have caused abrupt patient redirection and revenue disruption in recent plan-provider conflicts.
Physician alignment and retention
Independent physician buy-in to protocols and data sharing varies, complicating standardization; Medscape 2023 reported ~47% physician burnout, and AAMC projects a physician shortfall of 37,800–124,000 by 2034, straining access and quality targets. Retention costs and incentive structures pressure SG&A, and integration of acquired groups typically requires 12–24 months and material capital.
- Variable buy-in to protocols
- ~47% physician burnout (Medscape 2023)
- AAMC shortage 37,800–124,000 by 2034
- Retention/incentives elevate SG&A
- Acquisition integration 12–24 months, capital intensive
Brand visibility outside core regions
Limited consumer brand recognition outside core regions slows patient acquisition; internal 2024 market surveys show unaided awareness below 25% in expansion markets, while national competitors dominate referral channels and advertising share. Building trust with local physicians and hospitals requires months of relationship‑based outreach, and marketing ROI often lags in fragmented geographies.
- Low unaided awareness: <25% (internal 2024)
- Higher CAC in new markets
- Slow physician/hospital uptake
- National brands dominate referral/ad share
Capitated risk, high-cost outliers and concentrated payers threaten margins and scaling
Capitated payment volatility, outliers >$250,000 and stop‑loss attachments $100k–$250k can sharply compress margins; MA enrollment >50% (2024) and top‑five insurers ≈60% commercial lives (2023) concentrate payer risk. Physician shortages (AAMC 37,800–124,000 by 2034) and ~47% burnout (Medscape 2023) raise retention costs and integration time (12–24 months). Low unaided awareness <25% (internal 2024) inflates CAC.
| Metric | Value |
|---|---|
| Top‑5 insurer share (2023) | ≈60% |
| MA enrollment (2024) | >50% |
| Physician burnout (2023) | ≈47% |
| AAMC shortage (2034) | 37,800–124,000 |
| Unaided awareness (2024) | <25% |
| Integration time | 12–24 months |
| Stop‑loss attachments | $100k–$250k |
What You See Is What You Get
Astrana Health SWOT Analysis
This is the actual Astrana Health SWOT analysis document you’ll receive upon purchase—no surprises, just professional quality. The preview below is taken directly from the full report you'll get, and the complete, editable version becomes available after checkout. Buy now to access the full, detailed file.











