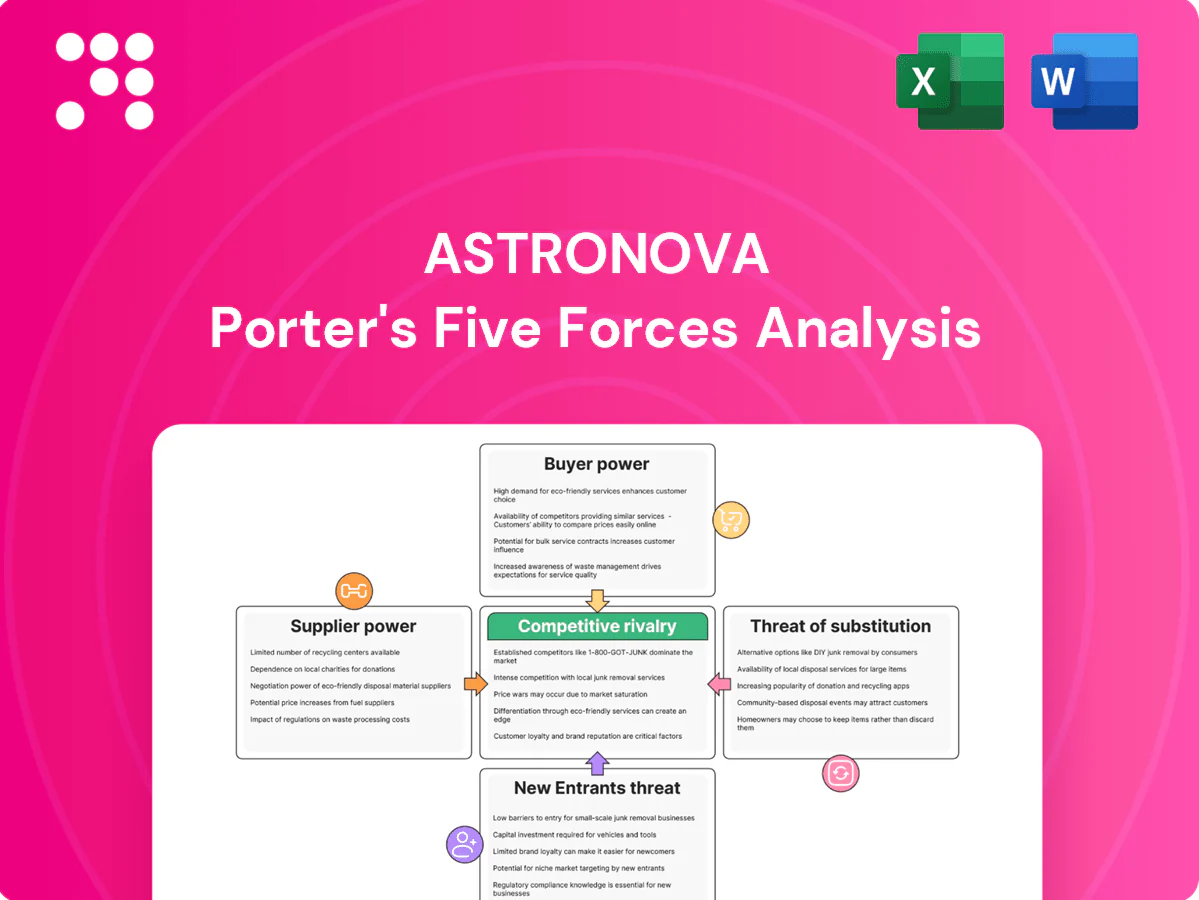
AstroNova Porter's Five Forces Analysis

Go Beyond the Preview—Access the Full Strategic Report
AstroNova’s Porter's Five Forces snapshot highlights moderate buyer power, niche supplier relationships, and a rising threat from digital substitutes as the company navigates specialized labeling and data-printing markets. Competitive rivalry is steady but innovation tilts advantage toward agile rivals. This brief snapshot only scratches the surface. Unlock the full Porter's Five Forces Analysis to explore AstroNova’s competitive dynamics, market pressures, and strategic advantages in detail.
Suppliers Bargaining Power

Dependence on proprietary print engines
Core thermal and inkjet printheads are concentrated among a few OEMs that industry estimates supply roughly three-quarters of modules, raising switching costs and lead-time risk (chip-enabled engines saw average lead times near 20–26 weeks in 2023–24). Supplier design roadmaps constrain AstroNova’s feature set and refresh cadence; dual-sourcing reduces allocation risk but can dilute performance tuning, while multi-year agreements often trade a 5–10% price premium for allocation priority.
Specialty inks, coatings, and substrates
Specialty inks, coatings and substrates command leverage because custom chemistries for chemical and heat resistance create technical lock-in; qualification cycles commonly exceed six months, increasing supplier stickiness. Volume commitments can secure unit pricing but raise inventory carrying risk for AstroNova. Private-labeling may hide supplier brands yet does not eliminate technical dependency on niche formulators or certified substrates.

Electronics and semiconductor availability
Critical MCUs, FPGAs and connectivity modules face cyclical shortages with lead times commonly exceeding 20+ weeks and pronounced price volatility. Design-for-availability and second-source parts materially reduce exposure. Long lead times can delay launches and slow backlog conversion, while strategic buys protect supply at the cost of tying up several months of working capital.

Calibration, sensors, and DAQ components
Test and Measurement depends on high-precision sensors, A/D converters, and accredited calibration services, creating a narrow supplier pool that increases supplier bargaining power; stringent metrology standards further limit alternatives. Long-term calibration contracts can secure better pricing and uptime, while supplier vertical integration into instrument systems threatens channel margins and system value.
Logistics and contract manufacturing partners
Contract manufacturers and logistics partners materially affect AstroNova’s cost base, yield and delivery reliability, with regional diversification mitigating disruption but fragmenting volumes and scale benefits. Process IP and proprietary test fixtures create exit frictions, raising switching costs for both parties. Performance-based SLAs and vendor-managed inventory programs can rebalance supplier leverage and improve fill rates.
Supplier concentration drives 20–26 wk lead times, allocation premiums and tech lock-in
Core printheads supply ~75% of modules (lead times 20–26 weeks in 2023–24), creating high switching costs; multi-year deals often carry a 5–10% premium for allocation. Specialty inks/substrates need >6-month qualification, locking AstroNova to niche formulators. MCUs/FPGA shortages drove 20+ week lead times and price volatility in 2024. Calibration/metrology suppliers remain narrowly concentrated, raising supplier leverage.
| Component | Supplier concentration | Lead time | Typical premium |
|---|---|---|---|
| Printheads | ~75% | 20–26 wk | 5–10% |
| Inks/Substrates | High (niche) | >6 mo qual | Varies |
| MCU/FPGA | Moderate–High | 20+ wk | Volatile |
| Calibration | Low vendor pool | NA | Contracted |
What is included in the product
 Detailed Word Document
Tailored Porter’s Five Forces analysis for AstroNova that uncovers competitive drivers, supplier and buyer power, threats from substitutes and new entrants, and emerging disruptive forces impacting pricing and profitability; delivered in fully editable Word format for easy incorporation into investor materials, strategy decks, or academic projects.

 Customizable Excel Spreadsheet
A concise one-sheet synthesizing AstroNova's Five Forces to relieve analysis overload—quickly assess competitive pressure, customize inputs for new market data, and drop slide-ready visuals into decks for faster, confident decision-making.
Customers Bargaining Power

Enterprise and regulated-industry customers
Large buyers in pharma, aerospace and food/logistics exert strong negotiating leverage, using RFP-driven cycles that increase price transparency and supplier comparability. Multi-year contracts, commonly 3–5 years, anchor volumes but force concessions on pricing, service-level agreements and lead times. Demand for certified compliance and traceability features often reduces pure price discounting by prioritizing validated solutions.
Consumables lock-in versus price sensitivity
As of 2024 the installed base of AstroNova printers underpins recurring media and ink sales, moderating churn by creating steady consumables demand. Buyers increasingly scrutinize total cost per label, pressuring consumables pricing and margins. Third-party media compatibility reduces vendor leverage, while subscription and service bundles help rebalance value toward recurring revenue.

Switching costs and workflow integration
Integrated label software, drivers, and validated processes raise switching costs by embedding workflow and reducing migration speed, with many industrial buyers operating on roughly 3-year refresh cycles in 2024. For DAQ, custom test scripts and data models create additional stickiness. Buyers still leverage pilots to extract discounts during refresh windows, with ~45% using pilot leverage in 2024 surveys. Rival interoperability claims, however, steadily erode lock-in.

After-sales support and uptime expectations
High uptime demands (typical SLA >=99.9% in industrial printing) give buyers leverage via service credits or penalties (commonly up to ~1% of contract value), while global spares and onsite teams are key differentiators. Predictive maintenance and remote diagnostics can cut unplanned downtime by around 30–40%, lowering perceived risk and compressing price sensitivity; weak coverage invites rapid competitive displacement.
- Uptime: >=99.9%
- Service credits: up to ~1% of contract
- Downtime reduction: predictive maintenance ~30–40%
- Global spares/on-site = competitive moat
Channel-driven purchasing dynamics
Distributors and VARs aggregate demand and negotiate rebates, concentrating purchasing power in channel partners that drive a large share of AstroNova's B2B orders; AstroNova reported FY2024 revenue of 168.8 million USD, underscoring channel importance. End-user price visibility via e-commerce compresses margins and forces tighter MAP enforcement. Deal registration and MDF steer share but add cost; direct-to-enterprise sales can bypass channel leverage.
- Channel rebates concentrate buying power
- E-commerce price visibility compresses margins
- MDF/deal registration trade share for expense
- Direct enterprise sales reduce channel influence
Large buyers use 3–5y RFPs; 45% pilots in 2024; SLAs >=99.9% cut downtime 30–40%
Large pharma/aero/food buyers use RFPs and 3–5y contracts to extract concessions; 45% use pilots in 2024. Installed base (AstroNova FY2024 rev 168.8M) supports consumables sales but third-party media and e-commerce compress margins. SLAs >=99.9% with service credits ~1% and predictive maintenance cuts downtime 30–40%.
| Metric | 2024 |
|---|---|
| FY Revenue | 168.8M USD |
| Pilots used | 45% |
| SLA | >=99.9% |
| Downtime reduction | 30–40% |
What You See Is What You Get
AstroNova Porter's Five Forces Analysis
This preview shows the exact AstroNova Porter's Five Forces Analysis you'll receive after purchase—fully written, professionally formatted, and ready for immediate download. There are no placeholders, mockups, or samples; the document here is the final deliverable. Once you complete payment, you’ll get instant access to this same file for your use.

Go Beyond the Preview—Access the Full Strategic Report
AstroNova’s Porter's Five Forces snapshot highlights moderate buyer power, niche supplier relationships, and a rising threat from digital substitutes as the company navigates specialized labeling and data-printing markets. Competitive rivalry is steady but innovation tilts advantage toward agile rivals. This brief snapshot only scratches the surface. Unlock the full Porter's Five Forces Analysis to explore AstroNova’s competitive dynamics, market pressures, and strategic advantages in detail.
Suppliers Bargaining Power
Dependence on proprietary print engines
Core thermal and inkjet printheads are concentrated among a few OEMs that industry estimates supply roughly three-quarters of modules, raising switching costs and lead-time risk (chip-enabled engines saw average lead times near 20–26 weeks in 2023–24). Supplier design roadmaps constrain AstroNova’s feature set and refresh cadence; dual-sourcing reduces allocation risk but can dilute performance tuning, while multi-year agreements often trade a 5–10% price premium for allocation priority.
Specialty inks, coatings, and substrates
Specialty inks, coatings and substrates command leverage because custom chemistries for chemical and heat resistance create technical lock-in; qualification cycles commonly exceed six months, increasing supplier stickiness. Volume commitments can secure unit pricing but raise inventory carrying risk for AstroNova. Private-labeling may hide supplier brands yet does not eliminate technical dependency on niche formulators or certified substrates.
Electronics and semiconductor availability
Critical MCUs, FPGAs and connectivity modules face cyclical shortages with lead times commonly exceeding 20+ weeks and pronounced price volatility. Design-for-availability and second-source parts materially reduce exposure. Long lead times can delay launches and slow backlog conversion, while strategic buys protect supply at the cost of tying up several months of working capital.
Calibration, sensors, and DAQ components
Test and Measurement depends on high-precision sensors, A/D converters, and accredited calibration services, creating a narrow supplier pool that increases supplier bargaining power; stringent metrology standards further limit alternatives. Long-term calibration contracts can secure better pricing and uptime, while supplier vertical integration into instrument systems threatens channel margins and system value.
Logistics and contract manufacturing partners
Contract manufacturers and logistics partners materially affect AstroNova’s cost base, yield and delivery reliability, with regional diversification mitigating disruption but fragmenting volumes and scale benefits. Process IP and proprietary test fixtures create exit frictions, raising switching costs for both parties. Performance-based SLAs and vendor-managed inventory programs can rebalance supplier leverage and improve fill rates.
Supplier concentration drives 20–26 wk lead times, allocation premiums and tech lock-in
Core printheads supply ~75% of modules (lead times 20–26 weeks in 2023–24), creating high switching costs; multi-year deals often carry a 5–10% premium for allocation. Specialty inks/substrates need >6-month qualification, locking AstroNova to niche formulators. MCUs/FPGA shortages drove 20+ week lead times and price volatility in 2024. Calibration/metrology suppliers remain narrowly concentrated, raising supplier leverage.
| Component | Supplier concentration | Lead time | Typical premium |
|---|---|---|---|
| Printheads | ~75% | 20–26 wk | 5–10% |
| Inks/Substrates | High (niche) | >6 mo qual | Varies |
| MCU/FPGA | Moderate–High | 20+ wk | Volatile |
| Calibration | Low vendor pool | NA | Contracted |
What is included in the product
Detailed Word Document
Tailored Porter’s Five Forces analysis for AstroNova that uncovers competitive drivers, supplier and buyer power, threats from substitutes and new entrants, and emerging disruptive forces impacting pricing and profitability; delivered in fully editable Word format for easy incorporation into investor materials, strategy decks, or academic projects.
Customizable Excel Spreadsheet
A concise one-sheet synthesizing AstroNova's Five Forces to relieve analysis overload—quickly assess competitive pressure, customize inputs for new market data, and drop slide-ready visuals into decks for faster, confident decision-making.
Customers Bargaining Power
Enterprise and regulated-industry customers
Large buyers in pharma, aerospace and food/logistics exert strong negotiating leverage, using RFP-driven cycles that increase price transparency and supplier comparability. Multi-year contracts, commonly 3–5 years, anchor volumes but force concessions on pricing, service-level agreements and lead times. Demand for certified compliance and traceability features often reduces pure price discounting by prioritizing validated solutions.
Consumables lock-in versus price sensitivity
As of 2024 the installed base of AstroNova printers underpins recurring media and ink sales, moderating churn by creating steady consumables demand. Buyers increasingly scrutinize total cost per label, pressuring consumables pricing and margins. Third-party media compatibility reduces vendor leverage, while subscription and service bundles help rebalance value toward recurring revenue.
Switching costs and workflow integration
Integrated label software, drivers, and validated processes raise switching costs by embedding workflow and reducing migration speed, with many industrial buyers operating on roughly 3-year refresh cycles in 2024. For DAQ, custom test scripts and data models create additional stickiness. Buyers still leverage pilots to extract discounts during refresh windows, with ~45% using pilot leverage in 2024 surveys. Rival interoperability claims, however, steadily erode lock-in.
After-sales support and uptime expectations
High uptime demands (typical SLA >=99.9% in industrial printing) give buyers leverage via service credits or penalties (commonly up to ~1% of contract value), while global spares and onsite teams are key differentiators. Predictive maintenance and remote diagnostics can cut unplanned downtime by around 30–40%, lowering perceived risk and compressing price sensitivity; weak coverage invites rapid competitive displacement.
- Uptime: >=99.9%
- Service credits: up to ~1% of contract
- Downtime reduction: predictive maintenance ~30–40%
- Global spares/on-site = competitive moat
Channel-driven purchasing dynamics
Distributors and VARs aggregate demand and negotiate rebates, concentrating purchasing power in channel partners that drive a large share of AstroNova's B2B orders; AstroNova reported FY2024 revenue of 168.8 million USD, underscoring channel importance. End-user price visibility via e-commerce compresses margins and forces tighter MAP enforcement. Deal registration and MDF steer share but add cost; direct-to-enterprise sales can bypass channel leverage.
- Channel rebates concentrate buying power
- E-commerce price visibility compresses margins
- MDF/deal registration trade share for expense
- Direct enterprise sales reduce channel influence
Large buyers use 3–5y RFPs; 45% pilots in 2024; SLAs >=99.9% cut downtime 30–40%
Large pharma/aero/food buyers use RFPs and 3–5y contracts to extract concessions; 45% use pilots in 2024. Installed base (AstroNova FY2024 rev 168.8M) supports consumables sales but third-party media and e-commerce compress margins. SLAs >=99.9% with service credits ~1% and predictive maintenance cuts downtime 30–40%.
| Metric | 2024 |
|---|---|
| FY Revenue | 168.8M USD |
| Pilots used | 45% |
| SLA | >=99.9% |
| Downtime reduction | 30–40% |
What You See Is What You Get
AstroNova Porter's Five Forces Analysis
This preview shows the exact AstroNova Porter's Five Forces Analysis you'll receive after purchase—fully written, professionally formatted, and ready for immediate download. There are no placeholders, mockups, or samples; the document here is the final deliverable. Once you complete payment, you’ll get instant access to this same file for your use.
Original: $10.00
-65%$10.00
$3.50Description
Go Beyond the Preview—Access the Full Strategic Report
AstroNova’s Porter's Five Forces snapshot highlights moderate buyer power, niche supplier relationships, and a rising threat from digital substitutes as the company navigates specialized labeling and data-printing markets. Competitive rivalry is steady but innovation tilts advantage toward agile rivals. This brief snapshot only scratches the surface. Unlock the full Porter's Five Forces Analysis to explore AstroNova’s competitive dynamics, market pressures, and strategic advantages in detail.
Suppliers Bargaining Power
Dependence on proprietary print engines
Core thermal and inkjet printheads are concentrated among a few OEMs that industry estimates supply roughly three-quarters of modules, raising switching costs and lead-time risk (chip-enabled engines saw average lead times near 20–26 weeks in 2023–24). Supplier design roadmaps constrain AstroNova’s feature set and refresh cadence; dual-sourcing reduces allocation risk but can dilute performance tuning, while multi-year agreements often trade a 5–10% price premium for allocation priority.
Specialty inks, coatings, and substrates
Specialty inks, coatings and substrates command leverage because custom chemistries for chemical and heat resistance create technical lock-in; qualification cycles commonly exceed six months, increasing supplier stickiness. Volume commitments can secure unit pricing but raise inventory carrying risk for AstroNova. Private-labeling may hide supplier brands yet does not eliminate technical dependency on niche formulators or certified substrates.
Electronics and semiconductor availability
Critical MCUs, FPGAs and connectivity modules face cyclical shortages with lead times commonly exceeding 20+ weeks and pronounced price volatility. Design-for-availability and second-source parts materially reduce exposure. Long lead times can delay launches and slow backlog conversion, while strategic buys protect supply at the cost of tying up several months of working capital.
Calibration, sensors, and DAQ components
Test and Measurement depends on high-precision sensors, A/D converters, and accredited calibration services, creating a narrow supplier pool that increases supplier bargaining power; stringent metrology standards further limit alternatives. Long-term calibration contracts can secure better pricing and uptime, while supplier vertical integration into instrument systems threatens channel margins and system value.
Logistics and contract manufacturing partners
Contract manufacturers and logistics partners materially affect AstroNova’s cost base, yield and delivery reliability, with regional diversification mitigating disruption but fragmenting volumes and scale benefits. Process IP and proprietary test fixtures create exit frictions, raising switching costs for both parties. Performance-based SLAs and vendor-managed inventory programs can rebalance supplier leverage and improve fill rates.
Supplier concentration drives 20–26 wk lead times, allocation premiums and tech lock-in
Core printheads supply ~75% of modules (lead times 20–26 weeks in 2023–24), creating high switching costs; multi-year deals often carry a 5–10% premium for allocation. Specialty inks/substrates need >6-month qualification, locking AstroNova to niche formulators. MCUs/FPGA shortages drove 20+ week lead times and price volatility in 2024. Calibration/metrology suppliers remain narrowly concentrated, raising supplier leverage.
| Component | Supplier concentration | Lead time | Typical premium |
|---|---|---|---|
| Printheads | ~75% | 20–26 wk | 5–10% |
| Inks/Substrates | High (niche) | >6 mo qual | Varies |
| MCU/FPGA | Moderate–High | 20+ wk | Volatile |
| Calibration | Low vendor pool | NA | Contracted |
What is included in the product
Detailed Word Document
Tailored Porter’s Five Forces analysis for AstroNova that uncovers competitive drivers, supplier and buyer power, threats from substitutes and new entrants, and emerging disruptive forces impacting pricing and profitability; delivered in fully editable Word format for easy incorporation into investor materials, strategy decks, or academic projects.
Customizable Excel Spreadsheet
A concise one-sheet synthesizing AstroNova's Five Forces to relieve analysis overload—quickly assess competitive pressure, customize inputs for new market data, and drop slide-ready visuals into decks for faster, confident decision-making.
Customers Bargaining Power
Enterprise and regulated-industry customers
Large buyers in pharma, aerospace and food/logistics exert strong negotiating leverage, using RFP-driven cycles that increase price transparency and supplier comparability. Multi-year contracts, commonly 3–5 years, anchor volumes but force concessions on pricing, service-level agreements and lead times. Demand for certified compliance and traceability features often reduces pure price discounting by prioritizing validated solutions.
Consumables lock-in versus price sensitivity
As of 2024 the installed base of AstroNova printers underpins recurring media and ink sales, moderating churn by creating steady consumables demand. Buyers increasingly scrutinize total cost per label, pressuring consumables pricing and margins. Third-party media compatibility reduces vendor leverage, while subscription and service bundles help rebalance value toward recurring revenue.
Switching costs and workflow integration
Integrated label software, drivers, and validated processes raise switching costs by embedding workflow and reducing migration speed, with many industrial buyers operating on roughly 3-year refresh cycles in 2024. For DAQ, custom test scripts and data models create additional stickiness. Buyers still leverage pilots to extract discounts during refresh windows, with ~45% using pilot leverage in 2024 surveys. Rival interoperability claims, however, steadily erode lock-in.
After-sales support and uptime expectations
High uptime demands (typical SLA >=99.9% in industrial printing) give buyers leverage via service credits or penalties (commonly up to ~1% of contract value), while global spares and onsite teams are key differentiators. Predictive maintenance and remote diagnostics can cut unplanned downtime by around 30–40%, lowering perceived risk and compressing price sensitivity; weak coverage invites rapid competitive displacement.
- Uptime: >=99.9%
- Service credits: up to ~1% of contract
- Downtime reduction: predictive maintenance ~30–40%
- Global spares/on-site = competitive moat
Channel-driven purchasing dynamics
Distributors and VARs aggregate demand and negotiate rebates, concentrating purchasing power in channel partners that drive a large share of AstroNova's B2B orders; AstroNova reported FY2024 revenue of 168.8 million USD, underscoring channel importance. End-user price visibility via e-commerce compresses margins and forces tighter MAP enforcement. Deal registration and MDF steer share but add cost; direct-to-enterprise sales can bypass channel leverage.
- Channel rebates concentrate buying power
- E-commerce price visibility compresses margins
- MDF/deal registration trade share for expense
- Direct enterprise sales reduce channel influence
Large buyers use 3–5y RFPs; 45% pilots in 2024; SLAs >=99.9% cut downtime 30–40%
Large pharma/aero/food buyers use RFPs and 3–5y contracts to extract concessions; 45% use pilots in 2024. Installed base (AstroNova FY2024 rev 168.8M) supports consumables sales but third-party media and e-commerce compress margins. SLAs >=99.9% with service credits ~1% and predictive maintenance cuts downtime 30–40%.
| Metric | 2024 |
|---|---|
| FY Revenue | 168.8M USD |
| Pilots used | 45% |
| SLA | >=99.9% |
| Downtime reduction | 30–40% |
What You See Is What You Get
AstroNova Porter's Five Forces Analysis
This preview shows the exact AstroNova Porter's Five Forces Analysis you'll receive after purchase—fully written, professionally formatted, and ready for immediate download. There are no placeholders, mockups, or samples; the document here is the final deliverable. Once you complete payment, you’ll get instant access to this same file for your use.











