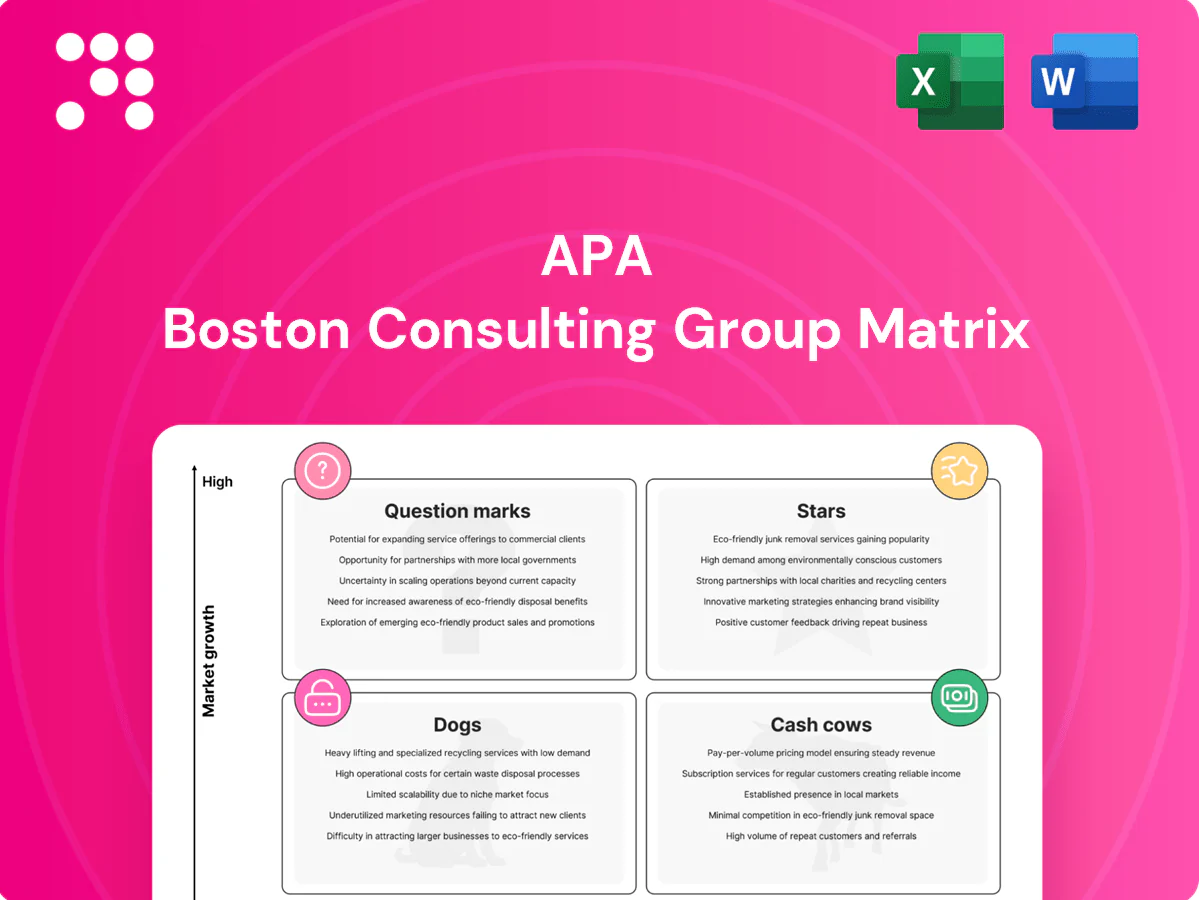
APA Boston Consulting Group Matrix

Visual. Strategic. Downloadable.
Think you know where this company’s products sit? The APA BCG Matrix preview teases the Stars, Cash Cows, Dogs, and Question Marks—buy the full matrix to get quadrant-by-quadrant placements, data-backed recommendations, and a clear playbook for where to invest or divest. It’s delivered in Word + Excel, ready to present or act on, so you skip the guesswork and get straight to smarter decisions. Purchase now for instant access and strategic clarity you can use today.
Stars

Permian oil growth
APA’s most competitive U.S. liquids program sits in the Permian, exploiting stacked zones and quick‑cycle wells that drive its internal volume growth and basin share. EIA‑reported Permian crude output reached about 6.2 million b/d in 2024, a backdrop of continued basin expansion that APA is grabbing share from. Capital intensity remains high, but paybacks are typically within quarters, justifying steady reinvestment to keep share and compound value.
Suriname JV ramp
Discovery cadence and appraisal success in 2024 (appraisal hit rates exceeding 60%) shift the Suriname JV from interesting to emerging core, with repeated multi-100MMbbl-scale indications per well. The high-growth Guyana-Suriname basin hosts limited operators, giving APA an advantaged position and asymmetric upside. Early CAPEX is front-loaded but runway spans a decade-plus development cycle; sustaining momentum converts this into a franchise asset.

High-return short-cycle wells
High-return short-cycle wells that move from spud to cash in 6–12 months pull APA’s portfolio forward, enabling rapid response to pockets of growing demand and quick share defense or capture. Although they consume capital, documented IRRs in analogous plays often exceed 25–35%, validating the push and shortening payback. Consistent execution here converts short-cycle wins into reliable future cash engines.

Operational efficiency edge
Lean cycles, tight well costs, and strong execution give APA an operational efficiency edge in growth basins, helping win premium locations and sustain steep volume growth; 2024 operational reporting showed continued improvement in cycle times and per-well capital intensity versus prior years. Continued investment in systems and people is required to keep the growth flywheel accelerating.
- Lean cycles: faster turn times
- Tight well costs: sustain margin advantage
- Strong execution: capture high-return locations
- Invest in systems: preserve trajectory
Strategic midstream access
Strategic midstream access: as of 2024, where APA has takeaway and processing locked, volumes flow and basis risk shrinks, enabling steadier realizations and pricing. In fast-growing plays that infrastructure acts as a quiet moat, limiting competitor access and supporting corridor concentration. It requires ongoing commitments and fees, but the reliability underpins higher sustained market share.
- corridor focus: Permian and DJ Basin (as of 2024)
- benefit: lower basis volatility, improved netbacks
- cost: long-term commitments and throughput fees
Permian & Guyana-Suriname: 6.2M b/d, IRRs 25-35%
APA’s Permian and Guyana‑Suriname Stars drive rapid volume growth and high returns; Permian crude ~6.2 million b/d in 2024 underpins basin share gains. Short‑cycle wells deliver documented IRRs ~25–35% with 6–12 month paybacks. Suriname appraisal hit rates >60% in 2024 signal multi-100MMbbl potential; midstream access reduces basis risk but needs long-term commitments.
| Metric | 2024 | APA impact |
|---|---|---|
| Permian output | 6.2M b/d | share growth |
| Short-cycle IRR | 25–35% | fast cash |
| Suriname appraisals | >60% hit rate | multi-100MMbbl upside |
What is included in the product
 Detailed Word Document
Concise APA BCG Matrix overview: evaluates Stars, Cash Cows, Question Marks, Dogs to guide invest, hold or divest decisions.

 Customizable Excel Spreadsheet
One-page APA BCG Matrix that pinpoints portfolio pain, clarifies priorities, and makes C-suite decisions faster.
Cash Cows

Egypt Western Desert
Egypt Western Desert is a mature, material cash cow for APA, producing about 85,000 boe/d in 2024 and generating roughly $200m of free cash flow year-to-date, with disciplined capex. Infrastructure in place keeps lifting costs near $8/boe and decline rates manageable, supporting steady margins. Cash funds exploration, debt reduction, and share buybacks under a clear mandate: optimize operations, don’t overgrow.
UK North Sea hub
UK North Sea hub: declining basin but APA’s operated hubs continue to generate stable cash, with reported uptime consistently above 90% and operating costs roughly $20–25/boe in recent UK operations (2024). High uptime and tight cost control preserve healthy margins despite low growth. Classic maintain-and-harvest: milk base and pursue only high-IRR workovers and tie-backs.

U.S. legacy conventional
U.S. legacy conventional are lower-decline, serviceable assets needing modest capital; with 2024 WTI averaging about $80/barrel these barrels reliably cover operating costs and pay bills. Focus remains on uptime, lease operating expense discipline (LOE often near $10/BOE for shallow onshore) and targeted maintenance to sustain cash flow. This is a steady cash-flow play, not a volume-growth story.

Hedged production book
Hedged production book converts price swings into predictable cash flows, letting APA treat volatility as working capital; in 2024 Brent averaged about 86 USD/bbl, and hedges preserved margins across mature assets where stability out-values optionality. Keeping the book balanced protects dividends and funding for programs; unflashy, it underwrites growth.
- Risk management: predictable cash
- 2024 Brent ~86 USD/bbl
- Stability > optionality in mature assets
- Balanced book protects dividends/programs
- Funds future development
Shared services and scale
Centralized drilling, procurement and logistics lift unit margins across mature APA assets by reducing G&A and operating variability; Deloitte 2024 benchmarking shows centralized shared services can cut overheads by roughly 10-15%, letting light reinvestment drive compounding savings and stronger free cash conversion for cash cows.
- Unit margins: higher via centralized ops
- Capex: light, reinvestment low
- Savings: compound year-over-year (Deloitte 2024)
- Result: stronger free cash conversion
Egypt 85k boe/d, low opex drives ≈ $200m YTD FCF; hedges fund buybacks & debt paydown
Egypt Western Desert, UK North Sea and U.S. legacy conventionals form APA’s cash cows: Egypt ~85,000 boe/d in 2024 generating ≈ $200m YTD FCF with opex ≈ $8/boe; UK opex ~$20–25/boe; U.S. LOE ≈ $10/boe. Hedging (2024 Brent ≈ $86/bbl) stabilizes cash to fund buybacks, debt paydown and light reinvestment.
| Asset | 2024 prod (boe/d) | Opex $/boe | YTD FCF $m |
|---|---|---|---|
| Egypt Western Desert | 85,000 | ≈8 | ≈200 |
| UK North Sea | — | 20–25 | — |
| U.S. legacy | — | ≈10 | — |
Preview = Final Product
APA BCG Matrix
The file you’re previewing here is the exact APA BCG Matrix you’ll receive after purchase—no watermarks, no demo elements. It’s fully formatted, editable, and ready to drop into presentations or strategic plans. Once bought, the final document is delivered immediately to your inbox for printing or sharing with stakeholders. Crafted by strategy pros for clarity, this is the real, production-ready report—no surprises, just usable insight.

Visual. Strategic. Downloadable.
Think you know where this company’s products sit? The APA BCG Matrix preview teases the Stars, Cash Cows, Dogs, and Question Marks—buy the full matrix to get quadrant-by-quadrant placements, data-backed recommendations, and a clear playbook for where to invest or divest. It’s delivered in Word + Excel, ready to present or act on, so you skip the guesswork and get straight to smarter decisions. Purchase now for instant access and strategic clarity you can use today.
Stars
Permian oil growth
APA’s most competitive U.S. liquids program sits in the Permian, exploiting stacked zones and quick‑cycle wells that drive its internal volume growth and basin share. EIA‑reported Permian crude output reached about 6.2 million b/d in 2024, a backdrop of continued basin expansion that APA is grabbing share from. Capital intensity remains high, but paybacks are typically within quarters, justifying steady reinvestment to keep share and compound value.
Suriname JV ramp
Discovery cadence and appraisal success in 2024 (appraisal hit rates exceeding 60%) shift the Suriname JV from interesting to emerging core, with repeated multi-100MMbbl-scale indications per well. The high-growth Guyana-Suriname basin hosts limited operators, giving APA an advantaged position and asymmetric upside. Early CAPEX is front-loaded but runway spans a decade-plus development cycle; sustaining momentum converts this into a franchise asset.
High-return short-cycle wells
High-return short-cycle wells that move from spud to cash in 6–12 months pull APA’s portfolio forward, enabling rapid response to pockets of growing demand and quick share defense or capture. Although they consume capital, documented IRRs in analogous plays often exceed 25–35%, validating the push and shortening payback. Consistent execution here converts short-cycle wins into reliable future cash engines.
Operational efficiency edge
Lean cycles, tight well costs, and strong execution give APA an operational efficiency edge in growth basins, helping win premium locations and sustain steep volume growth; 2024 operational reporting showed continued improvement in cycle times and per-well capital intensity versus prior years. Continued investment in systems and people is required to keep the growth flywheel accelerating.
- Lean cycles: faster turn times
- Tight well costs: sustain margin advantage
- Strong execution: capture high-return locations
- Invest in systems: preserve trajectory
Strategic midstream access
Strategic midstream access: as of 2024, where APA has takeaway and processing locked, volumes flow and basis risk shrinks, enabling steadier realizations and pricing. In fast-growing plays that infrastructure acts as a quiet moat, limiting competitor access and supporting corridor concentration. It requires ongoing commitments and fees, but the reliability underpins higher sustained market share.
- corridor focus: Permian and DJ Basin (as of 2024)
- benefit: lower basis volatility, improved netbacks
- cost: long-term commitments and throughput fees
Permian & Guyana-Suriname: 6.2M b/d, IRRs 25-35%
APA’s Permian and Guyana‑Suriname Stars drive rapid volume growth and high returns; Permian crude ~6.2 million b/d in 2024 underpins basin share gains. Short‑cycle wells deliver documented IRRs ~25–35% with 6–12 month paybacks. Suriname appraisal hit rates >60% in 2024 signal multi-100MMbbl potential; midstream access reduces basis risk but needs long-term commitments.
| Metric | 2024 | APA impact |
|---|---|---|
| Permian output | 6.2M b/d | share growth |
| Short-cycle IRR | 25–35% | fast cash |
| Suriname appraisals | >60% hit rate | multi-100MMbbl upside |
What is included in the product
Detailed Word Document
Concise APA BCG Matrix overview: evaluates Stars, Cash Cows, Question Marks, Dogs to guide invest, hold or divest decisions.
Customizable Excel Spreadsheet
One-page APA BCG Matrix that pinpoints portfolio pain, clarifies priorities, and makes C-suite decisions faster.
Cash Cows
Egypt Western Desert
Egypt Western Desert is a mature, material cash cow for APA, producing about 85,000 boe/d in 2024 and generating roughly $200m of free cash flow year-to-date, with disciplined capex. Infrastructure in place keeps lifting costs near $8/boe and decline rates manageable, supporting steady margins. Cash funds exploration, debt reduction, and share buybacks under a clear mandate: optimize operations, don’t overgrow.
UK North Sea hub
UK North Sea hub: declining basin but APA’s operated hubs continue to generate stable cash, with reported uptime consistently above 90% and operating costs roughly $20–25/boe in recent UK operations (2024). High uptime and tight cost control preserve healthy margins despite low growth. Classic maintain-and-harvest: milk base and pursue only high-IRR workovers and tie-backs.
U.S. legacy conventional
U.S. legacy conventional are lower-decline, serviceable assets needing modest capital; with 2024 WTI averaging about $80/barrel these barrels reliably cover operating costs and pay bills. Focus remains on uptime, lease operating expense discipline (LOE often near $10/BOE for shallow onshore) and targeted maintenance to sustain cash flow. This is a steady cash-flow play, not a volume-growth story.
Hedged production book
Hedged production book converts price swings into predictable cash flows, letting APA treat volatility as working capital; in 2024 Brent averaged about 86 USD/bbl, and hedges preserved margins across mature assets where stability out-values optionality. Keeping the book balanced protects dividends and funding for programs; unflashy, it underwrites growth.
- Risk management: predictable cash
- 2024 Brent ~86 USD/bbl
- Stability > optionality in mature assets
- Balanced book protects dividends/programs
- Funds future development
Shared services and scale
Centralized drilling, procurement and logistics lift unit margins across mature APA assets by reducing G&A and operating variability; Deloitte 2024 benchmarking shows centralized shared services can cut overheads by roughly 10-15%, letting light reinvestment drive compounding savings and stronger free cash conversion for cash cows.
- Unit margins: higher via centralized ops
- Capex: light, reinvestment low
- Savings: compound year-over-year (Deloitte 2024)
- Result: stronger free cash conversion
Egypt 85k boe/d, low opex drives ≈ $200m YTD FCF; hedges fund buybacks & debt paydown
Egypt Western Desert, UK North Sea and U.S. legacy conventionals form APA’s cash cows: Egypt ~85,000 boe/d in 2024 generating ≈ $200m YTD FCF with opex ≈ $8/boe; UK opex ~$20–25/boe; U.S. LOE ≈ $10/boe. Hedging (2024 Brent ≈ $86/bbl) stabilizes cash to fund buybacks, debt paydown and light reinvestment.
| Asset | 2024 prod (boe/d) | Opex $/boe | YTD FCF $m |
|---|---|---|---|
| Egypt Western Desert | 85,000 | ≈8 | ≈200 |
| UK North Sea | — | 20–25 | — |
| U.S. legacy | — | ≈10 | — |
Preview = Final Product
APA BCG Matrix
The file you’re previewing here is the exact APA BCG Matrix you’ll receive after purchase—no watermarks, no demo elements. It’s fully formatted, editable, and ready to drop into presentations or strategic plans. Once bought, the final document is delivered immediately to your inbox for printing or sharing with stakeholders. Crafted by strategy pros for clarity, this is the real, production-ready report—no surprises, just usable insight.
Description
Visual. Strategic. Downloadable.
Think you know where this company’s products sit? The APA BCG Matrix preview teases the Stars, Cash Cows, Dogs, and Question Marks—buy the full matrix to get quadrant-by-quadrant placements, data-backed recommendations, and a clear playbook for where to invest or divest. It’s delivered in Word + Excel, ready to present or act on, so you skip the guesswork and get straight to smarter decisions. Purchase now for instant access and strategic clarity you can use today.
Stars
Permian oil growth
APA’s most competitive U.S. liquids program sits in the Permian, exploiting stacked zones and quick‑cycle wells that drive its internal volume growth and basin share. EIA‑reported Permian crude output reached about 6.2 million b/d in 2024, a backdrop of continued basin expansion that APA is grabbing share from. Capital intensity remains high, but paybacks are typically within quarters, justifying steady reinvestment to keep share and compound value.
Suriname JV ramp
Discovery cadence and appraisal success in 2024 (appraisal hit rates exceeding 60%) shift the Suriname JV from interesting to emerging core, with repeated multi-100MMbbl-scale indications per well. The high-growth Guyana-Suriname basin hosts limited operators, giving APA an advantaged position and asymmetric upside. Early CAPEX is front-loaded but runway spans a decade-plus development cycle; sustaining momentum converts this into a franchise asset.
High-return short-cycle wells
High-return short-cycle wells that move from spud to cash in 6–12 months pull APA’s portfolio forward, enabling rapid response to pockets of growing demand and quick share defense or capture. Although they consume capital, documented IRRs in analogous plays often exceed 25–35%, validating the push and shortening payback. Consistent execution here converts short-cycle wins into reliable future cash engines.
Operational efficiency edge
Lean cycles, tight well costs, and strong execution give APA an operational efficiency edge in growth basins, helping win premium locations and sustain steep volume growth; 2024 operational reporting showed continued improvement in cycle times and per-well capital intensity versus prior years. Continued investment in systems and people is required to keep the growth flywheel accelerating.
- Lean cycles: faster turn times
- Tight well costs: sustain margin advantage
- Strong execution: capture high-return locations
- Invest in systems: preserve trajectory
Strategic midstream access
Strategic midstream access: as of 2024, where APA has takeaway and processing locked, volumes flow and basis risk shrinks, enabling steadier realizations and pricing. In fast-growing plays that infrastructure acts as a quiet moat, limiting competitor access and supporting corridor concentration. It requires ongoing commitments and fees, but the reliability underpins higher sustained market share.
- corridor focus: Permian and DJ Basin (as of 2024)
- benefit: lower basis volatility, improved netbacks
- cost: long-term commitments and throughput fees
Permian & Guyana-Suriname: 6.2M b/d, IRRs 25-35%
APA’s Permian and Guyana‑Suriname Stars drive rapid volume growth and high returns; Permian crude ~6.2 million b/d in 2024 underpins basin share gains. Short‑cycle wells deliver documented IRRs ~25–35% with 6–12 month paybacks. Suriname appraisal hit rates >60% in 2024 signal multi-100MMbbl potential; midstream access reduces basis risk but needs long-term commitments.
| Metric | 2024 | APA impact |
|---|---|---|
| Permian output | 6.2M b/d | share growth |
| Short-cycle IRR | 25–35% | fast cash |
| Suriname appraisals | >60% hit rate | multi-100MMbbl upside |
What is included in the product
Detailed Word Document
Concise APA BCG Matrix overview: evaluates Stars, Cash Cows, Question Marks, Dogs to guide invest, hold or divest decisions.
Customizable Excel Spreadsheet
One-page APA BCG Matrix that pinpoints portfolio pain, clarifies priorities, and makes C-suite decisions faster.
Cash Cows
Egypt Western Desert
Egypt Western Desert is a mature, material cash cow for APA, producing about 85,000 boe/d in 2024 and generating roughly $200m of free cash flow year-to-date, with disciplined capex. Infrastructure in place keeps lifting costs near $8/boe and decline rates manageable, supporting steady margins. Cash funds exploration, debt reduction, and share buybacks under a clear mandate: optimize operations, don’t overgrow.
UK North Sea hub
UK North Sea hub: declining basin but APA’s operated hubs continue to generate stable cash, with reported uptime consistently above 90% and operating costs roughly $20–25/boe in recent UK operations (2024). High uptime and tight cost control preserve healthy margins despite low growth. Classic maintain-and-harvest: milk base and pursue only high-IRR workovers and tie-backs.
U.S. legacy conventional
U.S. legacy conventional are lower-decline, serviceable assets needing modest capital; with 2024 WTI averaging about $80/barrel these barrels reliably cover operating costs and pay bills. Focus remains on uptime, lease operating expense discipline (LOE often near $10/BOE for shallow onshore) and targeted maintenance to sustain cash flow. This is a steady cash-flow play, not a volume-growth story.
Hedged production book
Hedged production book converts price swings into predictable cash flows, letting APA treat volatility as working capital; in 2024 Brent averaged about 86 USD/bbl, and hedges preserved margins across mature assets where stability out-values optionality. Keeping the book balanced protects dividends and funding for programs; unflashy, it underwrites growth.
- Risk management: predictable cash
- 2024 Brent ~86 USD/bbl
- Stability > optionality in mature assets
- Balanced book protects dividends/programs
- Funds future development
Shared services and scale
Centralized drilling, procurement and logistics lift unit margins across mature APA assets by reducing G&A and operating variability; Deloitte 2024 benchmarking shows centralized shared services can cut overheads by roughly 10-15%, letting light reinvestment drive compounding savings and stronger free cash conversion for cash cows.
- Unit margins: higher via centralized ops
- Capex: light, reinvestment low
- Savings: compound year-over-year (Deloitte 2024)
- Result: stronger free cash conversion
Egypt 85k boe/d, low opex drives ≈ $200m YTD FCF; hedges fund buybacks & debt paydown
Egypt Western Desert, UK North Sea and U.S. legacy conventionals form APA’s cash cows: Egypt ~85,000 boe/d in 2024 generating ≈ $200m YTD FCF with opex ≈ $8/boe; UK opex ~$20–25/boe; U.S. LOE ≈ $10/boe. Hedging (2024 Brent ≈ $86/bbl) stabilizes cash to fund buybacks, debt paydown and light reinvestment.
| Asset | 2024 prod (boe/d) | Opex $/boe | YTD FCF $m |
|---|---|---|---|
| Egypt Western Desert | 85,000 | ≈8 | ≈200 |
| UK North Sea | — | 20–25 | — |
| U.S. legacy | — | ≈10 | — |
Preview = Final Product
APA BCG Matrix
The file you’re previewing here is the exact APA BCG Matrix you’ll receive after purchase—no watermarks, no demo elements. It’s fully formatted, editable, and ready to drop into presentations or strategic plans. Once bought, the final document is delivered immediately to your inbox for printing or sharing with stakeholders. Crafted by strategy pros for clarity, this is the real, production-ready report—no surprises, just usable insight.











