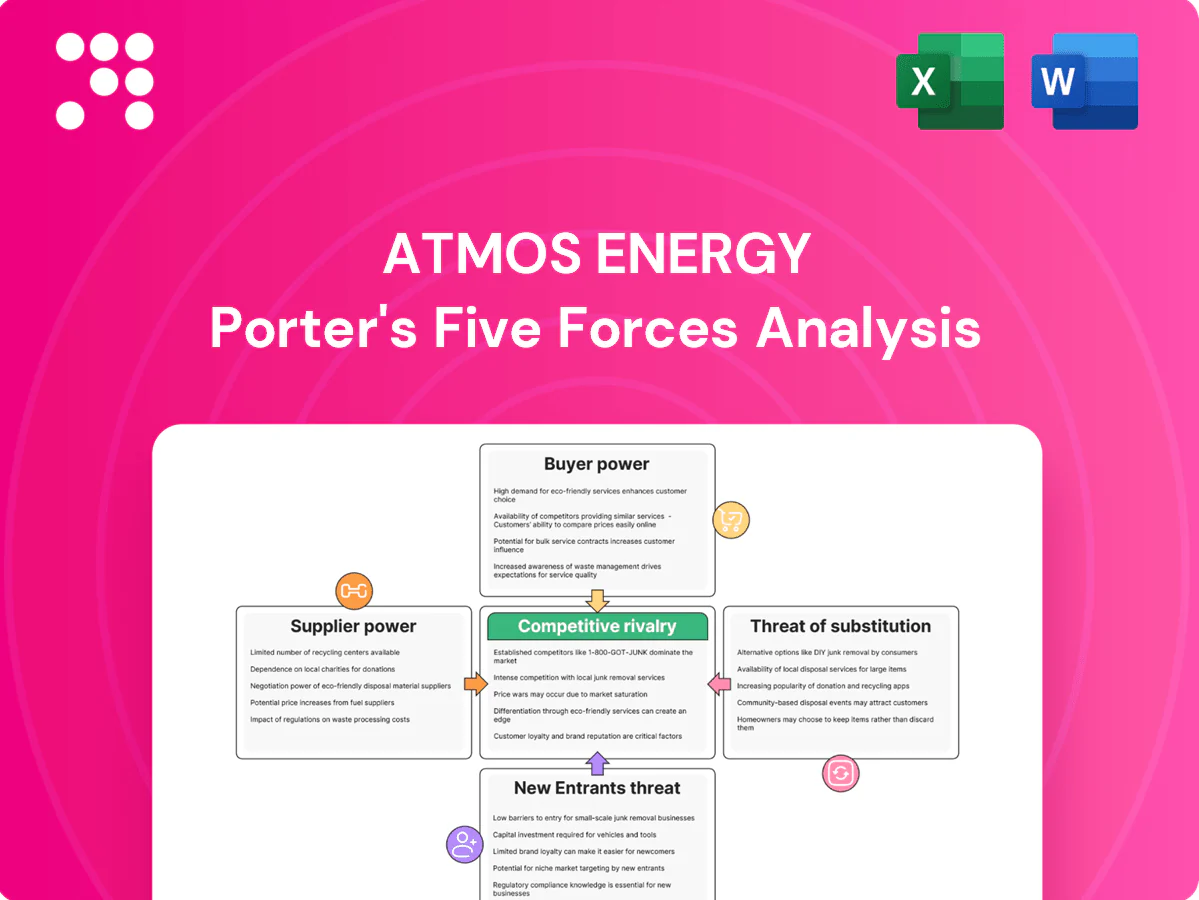
Atmos Energy Porter's Five Forces Analysis

Elevate Your Analysis with the Complete Porter's Five Forces Analysis
Atmos Energy's Porter's Five Forces review highlights moderate supplier power, regulated yet resilient buyer dynamics, limited substitutes, high entry barriers, and competitive rivalry driven by scale and network efficiency. This snapshot outlines key strategic pressures and opportunities. Unlock the full Porter's Five Forces Analysis to explore Atmos Energy’s competitive dynamics and market pressures in detail.
Suppliers Bargaining Power

Fragmented gas producers
Atmos sources gas from numerous producers and marketers across major basins, limiting any single supplier’s leverage and reflecting a fragmented upstream market. U.S. dry gas production averaged about 106 Bcf/d in 2024, supporting hub liquidity and constraining price markups. Henry Hub averaged roughly $2.98/MMBtu in 2024, while long-term contracts and hedging reduce dependence on any one counterparty.
Interstate pipeline capacity
Firm transportation and storage on interstate pipelines can tighten in peak winter, with EIA reporting average pipeline utilization near 85% in winter 2024, giving midstream providers situational leverage over delivery timing and reliability.
Take-or-pay contracts and reservation fees create fixed cash obligations for shippers, as reservation charges are billed irrespective of volumes transported, locking distribution utilities into capacity costs.
However, access to multiple pipeline routes in Atmos Energy franchise areas and FERC-regulated tariff frameworks constrain unilateral price increases and preserve competitive tolling discipline.

Specialized equipment and services
Pipe, compressors, meters and skilled contractors for Atmos Energy come from a constrained vendor base, concentrating bargaining power during replacement cycles. Supply-chain tightness has historically increased costs and extended lead times, pressuring margins and project timing. Multi-sourcing, equipment standardization and long-dated procurement contracts reduce supplier leverage and stabilize delivery and pricing risk.

Regulatory cost recovery
Regulatory cost recovery limits supplier pricing power: Atmos Energy’s 2024 Form 10-K notes purchased gas costs are largely passed through to customers subject to prudence reviews, while riders and rate mechanisms recover capital and portions of O&M, muting input-spike impact but preserving regulatory scrutiny that enforces procurement discipline.
- Purchased gas largely passed through (2024 Form 10-K)
- Riders recover capital and some O&M
- Prudence reviews force tight procurement controls
Fuel price volatility
Short-term fuel price swings (Henry Hub 2024 average ~2.80/MMBtu) increase Atmos Energy’s operational complexity and working capital needs as purchase-pay timing widens; financial hedging and storage (company hedges and utility-scale storage covering material shares of winter demand) smooth delivered costs and reduce supplier leverage, while diverse basin access across Gulf Coast and Midcontinent offsets localized price shocks.
- Short-term swings raise working capital
- Hedging and storage cut supplier leverage
- Diverse basin access offsets local shocks
Limited supplier pricing power amid diversified gas supply, hedging and pipeline constraints
Atmos faces limited supplier leverage due to sourcing from multiple basins (US dry gas ~106 Bcf/d in 2024) and regulatory pass-throughs; Henry Hub averaged ~$2.98/MMBtu in 2024. Winter pipeline utilization (~85% in 2024) and concentrated equipment vendors create situational leverage. Hedging, storage and FERC tariffs constrain supplier pricing power.
| Metric | 2024 |
|---|---|
| US dry gas supply | 106 Bcf/d |
| Henry Hub | $2.98/MMBtu |
| Winter pipeline use | ~85% |
What is included in the product
 Detailed Word Document
Concise Porter’s Five Forces analysis tailored for Atmos Energy, highlighting competitive rivalry, buyer and supplier power, threats from new entrants and substitutes, and regulatory barriers shaping profitability and strategic positioning.

 Customizable Excel Spreadsheet
One-sheet Porter's Five Forces for Atmos Energy that quickly pinpoints regulatory, supplier and competitive pressures to ease strategic decision-making. Customizable ratings and clean visuals make it simple to update for changing market or policy scenarios and drop straight into decks.
Customers Bargaining Power

Regulated captive customers
Residential and small commercial customers—approximately 3 million across eight states and roughly 1,400 discrete service territories—are captive to Atmos Energy, limiting direct switching. State public utility commissions approve rates and returns, aligning Atmos’ allowed earnings with prudent investment and service levels. This regulatory framework constrains individual buyer bargaining power and shifts negotiation to regulatory proceedings.
Industrial and power customers
Atmos Energy serves roughly 3 million customers across eight states (2024); industrial and power customers, while a small share of accounts, constitute a disproportionate share of throughput and often hold interruptible contracts or alternative-fuel options that give them negotiating latitude. They are highly price sensitive to delivered gas and transportation terms, yet distribution rates remain tariffed and subject to state regulatory oversight.

Aggregate demand elasticity
Aggregate demand for Atmos Energy (serving ~3.1 million customers) remains weather- and efficiency-driven; 2024 saw a low-single-digit throughput decline as milder weather, efficiency gains and early electrification uptake reduced use. Commodity cost passthrough preserved margins, but bill-affordability concerns shaped several 2024 rate-case outcomes; conservation programs and redesigned rates continue to temper throughput and revenue recovery.

Regulatory advocacy
Consumer advocates and municipalities frequently intervene in Atmos Energy rate cases, increasing buyer leverage in proceedings. Settlements in 2024 shifted allowed returns and riders; U.S. gas utility ROEs commonly ranged 9–11% in recent cases, directly affecting Atmos's revenue recovery. Atmos's reputation and safety metrics are cited by intervenors to negotiate stricter service standards.
- Intervention by municipalities boosts buyer power
- 2024 settlements influenced ROE/riders (typical ROE 9–11%)
- Reputation and safety records strengthen intervenor leverage
Service reliability expectations
Reliability, safety, and rapid emergency response drive customer value for Atmos Energy, with the company serving about 3 million gas customers (2024), making uptime and safety central to retention. High service expectations reduce willingness to switch fuels absent clear cost or reliability benefits. Strong operational performance and fast emergency response lower customer pressure for price concessions.
- Reliability: central to retention
- Scale: ~3 million customers (2024)
- Switching: low without clear benefits
- Performance: moderates concession pressure
~3.1M customers, low switching power; throughput down, ROE 9–11%
Atmos serves ~3.1M customers (2024); low switching power for residential accounts, higher leverage for large industrial/power users due to volume and alternative-fuel options. State regulation and rate-case outcomes (ROE ~9–11% in 2024) cap customer bargaining, while municipal/advocate interventions increase negotiated concessions; throughput fell low-single-digit in 2024.
| Metric | 2024 |
|---|---|
| Customers | ~3.1M |
| Throughput change | Low-single-digit decline |
| Allowed ROE | 9–11% |
Preview the Actual Deliverable
Atmos Energy Porter's Five Forces Analysis
This Atmos Energy Porter's Five Forces Analysis evaluates competitive rivalry, supplier and buyer power, threat of substitutes, and entry barriers to clarify strategic pressures on the firm. It highlights regulatory impacts and regional market dynamics. This preview shows the exact document you'll receive immediately after purchase—no surprises, ready to download and use.

Elevate Your Analysis with the Complete Porter's Five Forces Analysis
Atmos Energy's Porter's Five Forces review highlights moderate supplier power, regulated yet resilient buyer dynamics, limited substitutes, high entry barriers, and competitive rivalry driven by scale and network efficiency. This snapshot outlines key strategic pressures and opportunities. Unlock the full Porter's Five Forces Analysis to explore Atmos Energy’s competitive dynamics and market pressures in detail.
Suppliers Bargaining Power
Fragmented gas producers
Atmos sources gas from numerous producers and marketers across major basins, limiting any single supplier’s leverage and reflecting a fragmented upstream market. U.S. dry gas production averaged about 106 Bcf/d in 2024, supporting hub liquidity and constraining price markups. Henry Hub averaged roughly $2.98/MMBtu in 2024, while long-term contracts and hedging reduce dependence on any one counterparty.
Interstate pipeline capacity
Firm transportation and storage on interstate pipelines can tighten in peak winter, with EIA reporting average pipeline utilization near 85% in winter 2024, giving midstream providers situational leverage over delivery timing and reliability.
Take-or-pay contracts and reservation fees create fixed cash obligations for shippers, as reservation charges are billed irrespective of volumes transported, locking distribution utilities into capacity costs.
However, access to multiple pipeline routes in Atmos Energy franchise areas and FERC-regulated tariff frameworks constrain unilateral price increases and preserve competitive tolling discipline.
Specialized equipment and services
Pipe, compressors, meters and skilled contractors for Atmos Energy come from a constrained vendor base, concentrating bargaining power during replacement cycles. Supply-chain tightness has historically increased costs and extended lead times, pressuring margins and project timing. Multi-sourcing, equipment standardization and long-dated procurement contracts reduce supplier leverage and stabilize delivery and pricing risk.
Regulatory cost recovery
Regulatory cost recovery limits supplier pricing power: Atmos Energy’s 2024 Form 10-K notes purchased gas costs are largely passed through to customers subject to prudence reviews, while riders and rate mechanisms recover capital and portions of O&M, muting input-spike impact but preserving regulatory scrutiny that enforces procurement discipline.
- Purchased gas largely passed through (2024 Form 10-K)
- Riders recover capital and some O&M
- Prudence reviews force tight procurement controls
Fuel price volatility
Short-term fuel price swings (Henry Hub 2024 average ~2.80/MMBtu) increase Atmos Energy’s operational complexity and working capital needs as purchase-pay timing widens; financial hedging and storage (company hedges and utility-scale storage covering material shares of winter demand) smooth delivered costs and reduce supplier leverage, while diverse basin access across Gulf Coast and Midcontinent offsets localized price shocks.
- Short-term swings raise working capital
- Hedging and storage cut supplier leverage
- Diverse basin access offsets local shocks
Limited supplier pricing power amid diversified gas supply, hedging and pipeline constraints
Atmos faces limited supplier leverage due to sourcing from multiple basins (US dry gas ~106 Bcf/d in 2024) and regulatory pass-throughs; Henry Hub averaged ~$2.98/MMBtu in 2024. Winter pipeline utilization (~85% in 2024) and concentrated equipment vendors create situational leverage. Hedging, storage and FERC tariffs constrain supplier pricing power.
| Metric | 2024 |
|---|---|
| US dry gas supply | 106 Bcf/d |
| Henry Hub | $2.98/MMBtu |
| Winter pipeline use | ~85% |
What is included in the product
Detailed Word Document
Concise Porter’s Five Forces analysis tailored for Atmos Energy, highlighting competitive rivalry, buyer and supplier power, threats from new entrants and substitutes, and regulatory barriers shaping profitability and strategic positioning.
Customizable Excel Spreadsheet
One-sheet Porter's Five Forces for Atmos Energy that quickly pinpoints regulatory, supplier and competitive pressures to ease strategic decision-making. Customizable ratings and clean visuals make it simple to update for changing market or policy scenarios and drop straight into decks.
Customers Bargaining Power
Regulated captive customers
Residential and small commercial customers—approximately 3 million across eight states and roughly 1,400 discrete service territories—are captive to Atmos Energy, limiting direct switching. State public utility commissions approve rates and returns, aligning Atmos’ allowed earnings with prudent investment and service levels. This regulatory framework constrains individual buyer bargaining power and shifts negotiation to regulatory proceedings.
Industrial and power customers
Atmos Energy serves roughly 3 million customers across eight states (2024); industrial and power customers, while a small share of accounts, constitute a disproportionate share of throughput and often hold interruptible contracts or alternative-fuel options that give them negotiating latitude. They are highly price sensitive to delivered gas and transportation terms, yet distribution rates remain tariffed and subject to state regulatory oversight.
Aggregate demand elasticity
Aggregate demand for Atmos Energy (serving ~3.1 million customers) remains weather- and efficiency-driven; 2024 saw a low-single-digit throughput decline as milder weather, efficiency gains and early electrification uptake reduced use. Commodity cost passthrough preserved margins, but bill-affordability concerns shaped several 2024 rate-case outcomes; conservation programs and redesigned rates continue to temper throughput and revenue recovery.
Regulatory advocacy
Consumer advocates and municipalities frequently intervene in Atmos Energy rate cases, increasing buyer leverage in proceedings. Settlements in 2024 shifted allowed returns and riders; U.S. gas utility ROEs commonly ranged 9–11% in recent cases, directly affecting Atmos's revenue recovery. Atmos's reputation and safety metrics are cited by intervenors to negotiate stricter service standards.
- Intervention by municipalities boosts buyer power
- 2024 settlements influenced ROE/riders (typical ROE 9–11%)
- Reputation and safety records strengthen intervenor leverage
Service reliability expectations
Reliability, safety, and rapid emergency response drive customer value for Atmos Energy, with the company serving about 3 million gas customers (2024), making uptime and safety central to retention. High service expectations reduce willingness to switch fuels absent clear cost or reliability benefits. Strong operational performance and fast emergency response lower customer pressure for price concessions.
- Reliability: central to retention
- Scale: ~3 million customers (2024)
- Switching: low without clear benefits
- Performance: moderates concession pressure
~3.1M customers, low switching power; throughput down, ROE 9–11%
Atmos serves ~3.1M customers (2024); low switching power for residential accounts, higher leverage for large industrial/power users due to volume and alternative-fuel options. State regulation and rate-case outcomes (ROE ~9–11% in 2024) cap customer bargaining, while municipal/advocate interventions increase negotiated concessions; throughput fell low-single-digit in 2024.
| Metric | 2024 |
|---|---|
| Customers | ~3.1M |
| Throughput change | Low-single-digit decline |
| Allowed ROE | 9–11% |
Preview the Actual Deliverable
Atmos Energy Porter's Five Forces Analysis
This Atmos Energy Porter's Five Forces Analysis evaluates competitive rivalry, supplier and buyer power, threat of substitutes, and entry barriers to clarify strategic pressures on the firm. It highlights regulatory impacts and regional market dynamics. This preview shows the exact document you'll receive immediately after purchase—no surprises, ready to download and use.
Original: $10.00
-65%$10.00
$3.50Description
Elevate Your Analysis with the Complete Porter's Five Forces Analysis
Atmos Energy's Porter's Five Forces review highlights moderate supplier power, regulated yet resilient buyer dynamics, limited substitutes, high entry barriers, and competitive rivalry driven by scale and network efficiency. This snapshot outlines key strategic pressures and opportunities. Unlock the full Porter's Five Forces Analysis to explore Atmos Energy’s competitive dynamics and market pressures in detail.
Suppliers Bargaining Power
Fragmented gas producers
Atmos sources gas from numerous producers and marketers across major basins, limiting any single supplier’s leverage and reflecting a fragmented upstream market. U.S. dry gas production averaged about 106 Bcf/d in 2024, supporting hub liquidity and constraining price markups. Henry Hub averaged roughly $2.98/MMBtu in 2024, while long-term contracts and hedging reduce dependence on any one counterparty.
Interstate pipeline capacity
Firm transportation and storage on interstate pipelines can tighten in peak winter, with EIA reporting average pipeline utilization near 85% in winter 2024, giving midstream providers situational leverage over delivery timing and reliability.
Take-or-pay contracts and reservation fees create fixed cash obligations for shippers, as reservation charges are billed irrespective of volumes transported, locking distribution utilities into capacity costs.
However, access to multiple pipeline routes in Atmos Energy franchise areas and FERC-regulated tariff frameworks constrain unilateral price increases and preserve competitive tolling discipline.
Specialized equipment and services
Pipe, compressors, meters and skilled contractors for Atmos Energy come from a constrained vendor base, concentrating bargaining power during replacement cycles. Supply-chain tightness has historically increased costs and extended lead times, pressuring margins and project timing. Multi-sourcing, equipment standardization and long-dated procurement contracts reduce supplier leverage and stabilize delivery and pricing risk.
Regulatory cost recovery
Regulatory cost recovery limits supplier pricing power: Atmos Energy’s 2024 Form 10-K notes purchased gas costs are largely passed through to customers subject to prudence reviews, while riders and rate mechanisms recover capital and portions of O&M, muting input-spike impact but preserving regulatory scrutiny that enforces procurement discipline.
- Purchased gas largely passed through (2024 Form 10-K)
- Riders recover capital and some O&M
- Prudence reviews force tight procurement controls
Fuel price volatility
Short-term fuel price swings (Henry Hub 2024 average ~2.80/MMBtu) increase Atmos Energy’s operational complexity and working capital needs as purchase-pay timing widens; financial hedging and storage (company hedges and utility-scale storage covering material shares of winter demand) smooth delivered costs and reduce supplier leverage, while diverse basin access across Gulf Coast and Midcontinent offsets localized price shocks.
- Short-term swings raise working capital
- Hedging and storage cut supplier leverage
- Diverse basin access offsets local shocks
Limited supplier pricing power amid diversified gas supply, hedging and pipeline constraints
Atmos faces limited supplier leverage due to sourcing from multiple basins (US dry gas ~106 Bcf/d in 2024) and regulatory pass-throughs; Henry Hub averaged ~$2.98/MMBtu in 2024. Winter pipeline utilization (~85% in 2024) and concentrated equipment vendors create situational leverage. Hedging, storage and FERC tariffs constrain supplier pricing power.
| Metric | 2024 |
|---|---|
| US dry gas supply | 106 Bcf/d |
| Henry Hub | $2.98/MMBtu |
| Winter pipeline use | ~85% |
What is included in the product
Detailed Word Document
Concise Porter’s Five Forces analysis tailored for Atmos Energy, highlighting competitive rivalry, buyer and supplier power, threats from new entrants and substitutes, and regulatory barriers shaping profitability and strategic positioning.
Customizable Excel Spreadsheet
One-sheet Porter's Five Forces for Atmos Energy that quickly pinpoints regulatory, supplier and competitive pressures to ease strategic decision-making. Customizable ratings and clean visuals make it simple to update for changing market or policy scenarios and drop straight into decks.
Customers Bargaining Power
Regulated captive customers
Residential and small commercial customers—approximately 3 million across eight states and roughly 1,400 discrete service territories—are captive to Atmos Energy, limiting direct switching. State public utility commissions approve rates and returns, aligning Atmos’ allowed earnings with prudent investment and service levels. This regulatory framework constrains individual buyer bargaining power and shifts negotiation to regulatory proceedings.
Industrial and power customers
Atmos Energy serves roughly 3 million customers across eight states (2024); industrial and power customers, while a small share of accounts, constitute a disproportionate share of throughput and often hold interruptible contracts or alternative-fuel options that give them negotiating latitude. They are highly price sensitive to delivered gas and transportation terms, yet distribution rates remain tariffed and subject to state regulatory oversight.
Aggregate demand elasticity
Aggregate demand for Atmos Energy (serving ~3.1 million customers) remains weather- and efficiency-driven; 2024 saw a low-single-digit throughput decline as milder weather, efficiency gains and early electrification uptake reduced use. Commodity cost passthrough preserved margins, but bill-affordability concerns shaped several 2024 rate-case outcomes; conservation programs and redesigned rates continue to temper throughput and revenue recovery.
Regulatory advocacy
Consumer advocates and municipalities frequently intervene in Atmos Energy rate cases, increasing buyer leverage in proceedings. Settlements in 2024 shifted allowed returns and riders; U.S. gas utility ROEs commonly ranged 9–11% in recent cases, directly affecting Atmos's revenue recovery. Atmos's reputation and safety metrics are cited by intervenors to negotiate stricter service standards.
- Intervention by municipalities boosts buyer power
- 2024 settlements influenced ROE/riders (typical ROE 9–11%)
- Reputation and safety records strengthen intervenor leverage
Service reliability expectations
Reliability, safety, and rapid emergency response drive customer value for Atmos Energy, with the company serving about 3 million gas customers (2024), making uptime and safety central to retention. High service expectations reduce willingness to switch fuels absent clear cost or reliability benefits. Strong operational performance and fast emergency response lower customer pressure for price concessions.
- Reliability: central to retention
- Scale: ~3 million customers (2024)
- Switching: low without clear benefits
- Performance: moderates concession pressure
~3.1M customers, low switching power; throughput down, ROE 9–11%
Atmos serves ~3.1M customers (2024); low switching power for residential accounts, higher leverage for large industrial/power users due to volume and alternative-fuel options. State regulation and rate-case outcomes (ROE ~9–11% in 2024) cap customer bargaining, while municipal/advocate interventions increase negotiated concessions; throughput fell low-single-digit in 2024.
| Metric | 2024 |
|---|---|
| Customers | ~3.1M |
| Throughput change | Low-single-digit decline |
| Allowed ROE | 9–11% |
Preview the Actual Deliverable
Atmos Energy Porter's Five Forces Analysis
This Atmos Energy Porter's Five Forces Analysis evaluates competitive rivalry, supplier and buyer power, threat of substitutes, and entry barriers to clarify strategic pressures on the firm. It highlights regulatory impacts and regional market dynamics. This preview shows the exact document you'll receive immediately after purchase—no surprises, ready to download and use.











