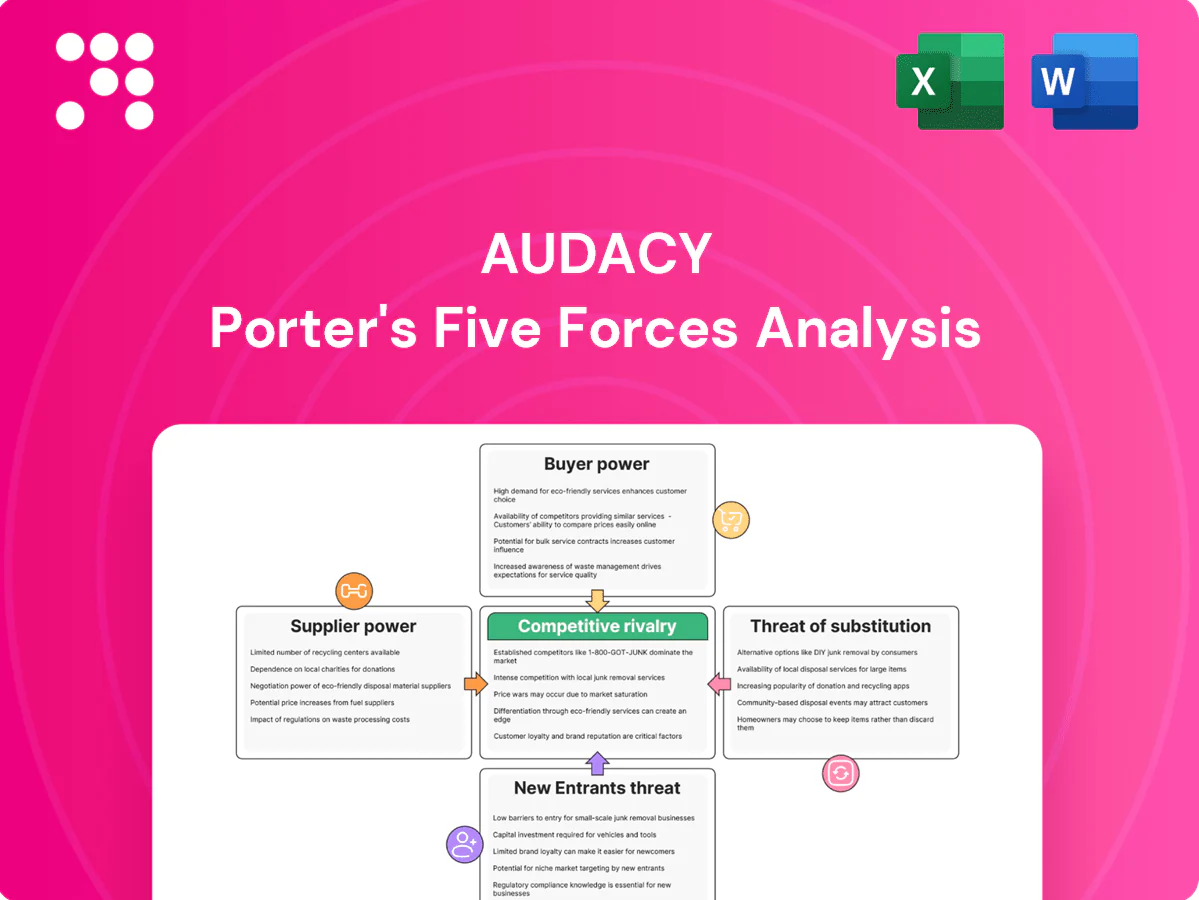
Audacy Porter's Five Forces Analysis

Don't Miss the Bigger Picture
Audacy’s competitive landscape is shaped by intense rivalry, evolving listener preferences, digital substitution and concentrated advertiser power. Our Porter's Five Forces snapshot highlights these pressures and strategic levers management can use. This brief preview only scratches the surface. Unlock the full Porter's Five Forces Analysis to explore force-by-force ratings, visuals, and actionable insights for investment or strategy.
Suppliers Bargaining Power

Music licensing bodies leverage
As of 2024, collective rights organizations (ASCAP, BMI, SESAC, SoundExchange) set largely standardized public-performance and digital licensing rates, constraining Audacy’s negotiating latitude. Statutory and consent-decree frameworks preserve meaningful fee exposure and periodic rate resets, so license increases directly compress margins on broadcast and streaming. Concentrated rights pools raise switching costs and deepen dependency on a few licensors.
On‑air talent and content creators
Star hosts, morning shows and marquee podcasters command premium compensation and revenue shares—Spotify paid Joe Rogan reportedly over 100 million in 2020, illustrating scale; US podcast ad revenue reached about 2.1 billion in 2023 (IAB/PwC), concentrating value with top talent. Audience loyalty follows talent, raising replacement costs; non‑competes and exclusivity rigidify contracts and talent scarcity in key formats amplifies supplier power.

Sports leagues and news affiliates
Exclusive sports rights are concentrated among a handful of leagues—NFL, MLB, NBA and the NCAA—and NFL national media rights deals alone exceed $10 billion per year, giving leagues outsized leverage. Losing a rights package can materially reduce station audience and ad yield, as live sports drive premium CPMs. Network news affiliations impose fees and content constraints, and limited substitutability elevates supplier bargaining strength.

Technology, ad‑tech, and distribution partners
CDNs, streaming platforms, DSPs and ad‑tech vendors set take rates and gate first‑party data access, creating pricing pressure for Audacy; dependence on third‑party measurement and targeting tools produces lock‑in. Platform policy or privacy changes (e.g., 2024 shifts to tracking rules) can reprice inventory overnight, while consolidation (Google+Meta >50% US digital ad spend in 2024) reduces optionality and raises costs.
- Take‑rates: platform fees and CDN costs
- Data access: measurement/vendor lock‑in
- Privacy: policy shifts reprice inventory
- Consolidation: higher costs, less choice
Transmitters, equipment, and tower access
Engineering vendors (Nautel, GatesAir) and tower firms command essential transmitters and tower access, constraining Audacy’s alternatives; long-term leases (commonly 5–20 years) and FCC licensing reduce supplier-switching. Maintenance and upgrade cycles drive periodic capex spikes, and local tower monopolies in key markets elevate supplier leverage, pressuring margins.
- Vendors: specialized transmitter OEMs
- Leases: typically 5–20 years
- Capex: cyclical upgrade pressure
- Local monopolies: higher supplier power
Supplier power squeezes broadcasters: podcast ads 2.1B, NFL >10B, platforms >50%
Supplier power is high: collective rights orgs and statutory rate resets limit Audacy’s pricing leverage; podcast ad market was about 2.1 billion USD in 2023. Star talent and exclusives concentrate value, raising replacement costs; major sports rights (NFL national deals >10 billion USD/yr) amplify risk. Platform consolidation (Google+Meta >50% US digital ad spend in 2024) and CDN/vendor lock‑in further constrain options.
| Supplier | Influence | Key stat |
|---|---|---|
| Rights orgs | Rate-setting | — |
| Talent | Premium pay | Podcast ads 2.1B (2023) |
| Leagues | Exclusive fees | NFL >10B/yr |
| Platforms | Ad access | Google+Meta >50% (2024) |
What is included in the product
 Detailed Word Document
Comprehensive Porter's Five Forces analysis tailored to Audacy that uncovers competitive rivalry, buyer and supplier power, threat of new entrants and substitutes, and emerging digital/audio streaming disruptions. Delivered in fully editable Word format with industry data and strategic commentary for investor materials, strategy decks, or academic use.

 Customizable Excel Spreadsheet
A compact, one-sheet Porter’s Five Forces tool that visualizes strategic pressure with a radar chart, is fully customizable with your own data, requires no macros, and exports cleanly for decks—so teams quickly identify risks and test scenarios without technical friction.
Customers Bargaining Power

Advertisers and agencies concentrate spend
Major brands and holding-company agencies negotiate volume discounts and bundled rates, forcing scale-based deals. Programmatic and multi-platform campaigns heighten price transparency—programmatic captured about 85% of US display ad spend in 2024. Budget reallocations to digital video and social increase buyer leverage, so Audacy must prove incremental reach and clear ROI to defend pricing.
Local SMBs with many ad options
Local SMBs—which make up 99.9% of US firms (SBA)—compare radio, streaming, search and social when buying ads, increasing buyer power. Low switching costs and frequent channel testing compress campaign lengths and force short-term proof of ROI. In 2024 search and social still capture the majority of digital ad spend, driving demand for attribution and flexible terms. Price sensitivity rises sharply during macro slowdowns, tightening negotiation on CPMs and guarantees.

Programmatic buyers and yield pressure
Programmatic buying — responsible for roughly 86% of US display inventory in 2024 — compresses margins through real-time price discovery, forcing publishers like Audacy to accept lower CPMs. Buyers can cap frequency and target narrowly, cutting wasted impressions and reducing yield per impression. Header bidding and exchanges have increased auction competition, while data‑rich rivals often deliver 10–30% higher ROAS, enabling them to undercut prices.

Listeners with zero monetary price
Listeners pay with attention and face abundant zero-price alternatives in 2024, giving them high bargaining power; churn risk forces Audacy to invest in content and UX to retain time spent listening. Perceived high ad load can reduce session length and ad effectiveness, and low loyalty among casual listeners limits Audacy’s indirect pricing leverage with advertisers.
- High attention-cost model
- Churn-driven content/UX spend
- Ad-load reduces time spent
- Low casual-loyalty → weak pricing power
National vs. local mix volatility
National brand spend cycles in 2024 continue to whipsaw CPMs, with national campaign surges pushing rates up while local demand lulls drive sharp declines; local sales can offset volatility but require higher sales effort per revenue dollar. Buyer leverage shifts by category—auto, retail, entertainment—where category health directly compresses or expands pricing power. Diversification across national/local and digital reduces but does not eliminate bargaining pressure.
- 2024: national swings increase CPM volatility
- Local offsets cost more in sales resources
- Category health (auto, retail, entertainment) shifts leverage
- Diversification mitigates but not removes pressure
Programmatic ~85% of US display compresses CPMs; SMBs demand ROI
Buyers have high leverage: programmatic captured ~85% of US display ad spend in 2024 and compresses CPMs; national seasonality drives CPM volatility. SMBs (99.9% of US firms) compare channels and demand short-term ROI and flexible terms. Listener churn and zero-price alternatives force Audacy into content/UX spend to defend rates.
| Metric | 2024 |
|---|---|
| Programmatic share | ~85% |
| SMB share of firms | 99.9% |
| Typical ROAS gap vs rivals | 10–30% |
What You See Is What You Get
Audacy Porter's Five Forces Analysis
This preview shows the exact Audacy Porter's Five Forces analysis you'll receive immediately after purchase—no placeholders or mockups. The document is fully formatted, professionally written, and ready for download and use the moment you buy. You're getting the final deliverable without delay.

Don't Miss the Bigger Picture
Audacy’s competitive landscape is shaped by intense rivalry, evolving listener preferences, digital substitution and concentrated advertiser power. Our Porter's Five Forces snapshot highlights these pressures and strategic levers management can use. This brief preview only scratches the surface. Unlock the full Porter's Five Forces Analysis to explore force-by-force ratings, visuals, and actionable insights for investment or strategy.
Suppliers Bargaining Power
Music licensing bodies leverage
As of 2024, collective rights organizations (ASCAP, BMI, SESAC, SoundExchange) set largely standardized public-performance and digital licensing rates, constraining Audacy’s negotiating latitude. Statutory and consent-decree frameworks preserve meaningful fee exposure and periodic rate resets, so license increases directly compress margins on broadcast and streaming. Concentrated rights pools raise switching costs and deepen dependency on a few licensors.
On‑air talent and content creators
Star hosts, morning shows and marquee podcasters command premium compensation and revenue shares—Spotify paid Joe Rogan reportedly over 100 million in 2020, illustrating scale; US podcast ad revenue reached about 2.1 billion in 2023 (IAB/PwC), concentrating value with top talent. Audience loyalty follows talent, raising replacement costs; non‑competes and exclusivity rigidify contracts and talent scarcity in key formats amplifies supplier power.
Sports leagues and news affiliates
Exclusive sports rights are concentrated among a handful of leagues—NFL, MLB, NBA and the NCAA—and NFL national media rights deals alone exceed $10 billion per year, giving leagues outsized leverage. Losing a rights package can materially reduce station audience and ad yield, as live sports drive premium CPMs. Network news affiliations impose fees and content constraints, and limited substitutability elevates supplier bargaining strength.
Technology, ad‑tech, and distribution partners
CDNs, streaming platforms, DSPs and ad‑tech vendors set take rates and gate first‑party data access, creating pricing pressure for Audacy; dependence on third‑party measurement and targeting tools produces lock‑in. Platform policy or privacy changes (e.g., 2024 shifts to tracking rules) can reprice inventory overnight, while consolidation (Google+Meta >50% US digital ad spend in 2024) reduces optionality and raises costs.
- Take‑rates: platform fees and CDN costs
- Data access: measurement/vendor lock‑in
- Privacy: policy shifts reprice inventory
- Consolidation: higher costs, less choice
Transmitters, equipment, and tower access
Engineering vendors (Nautel, GatesAir) and tower firms command essential transmitters and tower access, constraining Audacy’s alternatives; long-term leases (commonly 5–20 years) and FCC licensing reduce supplier-switching. Maintenance and upgrade cycles drive periodic capex spikes, and local tower monopolies in key markets elevate supplier leverage, pressuring margins.
- Vendors: specialized transmitter OEMs
- Leases: typically 5–20 years
- Capex: cyclical upgrade pressure
- Local monopolies: higher supplier power
Supplier power squeezes broadcasters: podcast ads 2.1B, NFL >10B, platforms >50%
Supplier power is high: collective rights orgs and statutory rate resets limit Audacy’s pricing leverage; podcast ad market was about 2.1 billion USD in 2023. Star talent and exclusives concentrate value, raising replacement costs; major sports rights (NFL national deals >10 billion USD/yr) amplify risk. Platform consolidation (Google+Meta >50% US digital ad spend in 2024) and CDN/vendor lock‑in further constrain options.
| Supplier | Influence | Key stat |
|---|---|---|
| Rights orgs | Rate-setting | — |
| Talent | Premium pay | Podcast ads 2.1B (2023) |
| Leagues | Exclusive fees | NFL >10B/yr |
| Platforms | Ad access | Google+Meta >50% (2024) |
What is included in the product
Detailed Word Document
Comprehensive Porter's Five Forces analysis tailored to Audacy that uncovers competitive rivalry, buyer and supplier power, threat of new entrants and substitutes, and emerging digital/audio streaming disruptions. Delivered in fully editable Word format with industry data and strategic commentary for investor materials, strategy decks, or academic use.
Customizable Excel Spreadsheet
A compact, one-sheet Porter’s Five Forces tool that visualizes strategic pressure with a radar chart, is fully customizable with your own data, requires no macros, and exports cleanly for decks—so teams quickly identify risks and test scenarios without technical friction.
Customers Bargaining Power
Advertisers and agencies concentrate spend
Major brands and holding-company agencies negotiate volume discounts and bundled rates, forcing scale-based deals. Programmatic and multi-platform campaigns heighten price transparency—programmatic captured about 85% of US display ad spend in 2024. Budget reallocations to digital video and social increase buyer leverage, so Audacy must prove incremental reach and clear ROI to defend pricing.
Local SMBs with many ad options
Local SMBs—which make up 99.9% of US firms (SBA)—compare radio, streaming, search and social when buying ads, increasing buyer power. Low switching costs and frequent channel testing compress campaign lengths and force short-term proof of ROI. In 2024 search and social still capture the majority of digital ad spend, driving demand for attribution and flexible terms. Price sensitivity rises sharply during macro slowdowns, tightening negotiation on CPMs and guarantees.
Programmatic buyers and yield pressure
Programmatic buying — responsible for roughly 86% of US display inventory in 2024 — compresses margins through real-time price discovery, forcing publishers like Audacy to accept lower CPMs. Buyers can cap frequency and target narrowly, cutting wasted impressions and reducing yield per impression. Header bidding and exchanges have increased auction competition, while data‑rich rivals often deliver 10–30% higher ROAS, enabling them to undercut prices.
Listeners with zero monetary price
Listeners pay with attention and face abundant zero-price alternatives in 2024, giving them high bargaining power; churn risk forces Audacy to invest in content and UX to retain time spent listening. Perceived high ad load can reduce session length and ad effectiveness, and low loyalty among casual listeners limits Audacy’s indirect pricing leverage with advertisers.
- High attention-cost model
- Churn-driven content/UX spend
- Ad-load reduces time spent
- Low casual-loyalty → weak pricing power
National vs. local mix volatility
National brand spend cycles in 2024 continue to whipsaw CPMs, with national campaign surges pushing rates up while local demand lulls drive sharp declines; local sales can offset volatility but require higher sales effort per revenue dollar. Buyer leverage shifts by category—auto, retail, entertainment—where category health directly compresses or expands pricing power. Diversification across national/local and digital reduces but does not eliminate bargaining pressure.
- 2024: national swings increase CPM volatility
- Local offsets cost more in sales resources
- Category health (auto, retail, entertainment) shifts leverage
- Diversification mitigates but not removes pressure
Programmatic ~85% of US display compresses CPMs; SMBs demand ROI
Buyers have high leverage: programmatic captured ~85% of US display ad spend in 2024 and compresses CPMs; national seasonality drives CPM volatility. SMBs (99.9% of US firms) compare channels and demand short-term ROI and flexible terms. Listener churn and zero-price alternatives force Audacy into content/UX spend to defend rates.
| Metric | 2024 |
|---|---|
| Programmatic share | ~85% |
| SMB share of firms | 99.9% |
| Typical ROAS gap vs rivals | 10–30% |
What You See Is What You Get
Audacy Porter's Five Forces Analysis
This preview shows the exact Audacy Porter's Five Forces analysis you'll receive immediately after purchase—no placeholders or mockups. The document is fully formatted, professionally written, and ready for download and use the moment you buy. You're getting the final deliverable without delay.
Description
Don't Miss the Bigger Picture
Audacy’s competitive landscape is shaped by intense rivalry, evolving listener preferences, digital substitution and concentrated advertiser power. Our Porter's Five Forces snapshot highlights these pressures and strategic levers management can use. This brief preview only scratches the surface. Unlock the full Porter's Five Forces Analysis to explore force-by-force ratings, visuals, and actionable insights for investment or strategy.
Suppliers Bargaining Power
Music licensing bodies leverage
As of 2024, collective rights organizations (ASCAP, BMI, SESAC, SoundExchange) set largely standardized public-performance and digital licensing rates, constraining Audacy’s negotiating latitude. Statutory and consent-decree frameworks preserve meaningful fee exposure and periodic rate resets, so license increases directly compress margins on broadcast and streaming. Concentrated rights pools raise switching costs and deepen dependency on a few licensors.
On‑air talent and content creators
Star hosts, morning shows and marquee podcasters command premium compensation and revenue shares—Spotify paid Joe Rogan reportedly over 100 million in 2020, illustrating scale; US podcast ad revenue reached about 2.1 billion in 2023 (IAB/PwC), concentrating value with top talent. Audience loyalty follows talent, raising replacement costs; non‑competes and exclusivity rigidify contracts and talent scarcity in key formats amplifies supplier power.
Sports leagues and news affiliates
Exclusive sports rights are concentrated among a handful of leagues—NFL, MLB, NBA and the NCAA—and NFL national media rights deals alone exceed $10 billion per year, giving leagues outsized leverage. Losing a rights package can materially reduce station audience and ad yield, as live sports drive premium CPMs. Network news affiliations impose fees and content constraints, and limited substitutability elevates supplier bargaining strength.
Technology, ad‑tech, and distribution partners
CDNs, streaming platforms, DSPs and ad‑tech vendors set take rates and gate first‑party data access, creating pricing pressure for Audacy; dependence on third‑party measurement and targeting tools produces lock‑in. Platform policy or privacy changes (e.g., 2024 shifts to tracking rules) can reprice inventory overnight, while consolidation (Google+Meta >50% US digital ad spend in 2024) reduces optionality and raises costs.
- Take‑rates: platform fees and CDN costs
- Data access: measurement/vendor lock‑in
- Privacy: policy shifts reprice inventory
- Consolidation: higher costs, less choice
Transmitters, equipment, and tower access
Engineering vendors (Nautel, GatesAir) and tower firms command essential transmitters and tower access, constraining Audacy’s alternatives; long-term leases (commonly 5–20 years) and FCC licensing reduce supplier-switching. Maintenance and upgrade cycles drive periodic capex spikes, and local tower monopolies in key markets elevate supplier leverage, pressuring margins.
- Vendors: specialized transmitter OEMs
- Leases: typically 5–20 years
- Capex: cyclical upgrade pressure
- Local monopolies: higher supplier power
Supplier power squeezes broadcasters: podcast ads 2.1B, NFL >10B, platforms >50%
Supplier power is high: collective rights orgs and statutory rate resets limit Audacy’s pricing leverage; podcast ad market was about 2.1 billion USD in 2023. Star talent and exclusives concentrate value, raising replacement costs; major sports rights (NFL national deals >10 billion USD/yr) amplify risk. Platform consolidation (Google+Meta >50% US digital ad spend in 2024) and CDN/vendor lock‑in further constrain options.
| Supplier | Influence | Key stat |
|---|---|---|
| Rights orgs | Rate-setting | — |
| Talent | Premium pay | Podcast ads 2.1B (2023) |
| Leagues | Exclusive fees | NFL >10B/yr |
| Platforms | Ad access | Google+Meta >50% (2024) |
What is included in the product
Detailed Word Document
Comprehensive Porter's Five Forces analysis tailored to Audacy that uncovers competitive rivalry, buyer and supplier power, threat of new entrants and substitutes, and emerging digital/audio streaming disruptions. Delivered in fully editable Word format with industry data and strategic commentary for investor materials, strategy decks, or academic use.
Customizable Excel Spreadsheet
A compact, one-sheet Porter’s Five Forces tool that visualizes strategic pressure with a radar chart, is fully customizable with your own data, requires no macros, and exports cleanly for decks—so teams quickly identify risks and test scenarios without technical friction.
Customers Bargaining Power
Advertisers and agencies concentrate spend
Major brands and holding-company agencies negotiate volume discounts and bundled rates, forcing scale-based deals. Programmatic and multi-platform campaigns heighten price transparency—programmatic captured about 85% of US display ad spend in 2024. Budget reallocations to digital video and social increase buyer leverage, so Audacy must prove incremental reach and clear ROI to defend pricing.
Local SMBs with many ad options
Local SMBs—which make up 99.9% of US firms (SBA)—compare radio, streaming, search and social when buying ads, increasing buyer power. Low switching costs and frequent channel testing compress campaign lengths and force short-term proof of ROI. In 2024 search and social still capture the majority of digital ad spend, driving demand for attribution and flexible terms. Price sensitivity rises sharply during macro slowdowns, tightening negotiation on CPMs and guarantees.
Programmatic buyers and yield pressure
Programmatic buying — responsible for roughly 86% of US display inventory in 2024 — compresses margins through real-time price discovery, forcing publishers like Audacy to accept lower CPMs. Buyers can cap frequency and target narrowly, cutting wasted impressions and reducing yield per impression. Header bidding and exchanges have increased auction competition, while data‑rich rivals often deliver 10–30% higher ROAS, enabling them to undercut prices.
Listeners with zero monetary price
Listeners pay with attention and face abundant zero-price alternatives in 2024, giving them high bargaining power; churn risk forces Audacy to invest in content and UX to retain time spent listening. Perceived high ad load can reduce session length and ad effectiveness, and low loyalty among casual listeners limits Audacy’s indirect pricing leverage with advertisers.
- High attention-cost model
- Churn-driven content/UX spend
- Ad-load reduces time spent
- Low casual-loyalty → weak pricing power
National vs. local mix volatility
National brand spend cycles in 2024 continue to whipsaw CPMs, with national campaign surges pushing rates up while local demand lulls drive sharp declines; local sales can offset volatility but require higher sales effort per revenue dollar. Buyer leverage shifts by category—auto, retail, entertainment—where category health directly compresses or expands pricing power. Diversification across national/local and digital reduces but does not eliminate bargaining pressure.
- 2024: national swings increase CPM volatility
- Local offsets cost more in sales resources
- Category health (auto, retail, entertainment) shifts leverage
- Diversification mitigates but not removes pressure
Programmatic ~85% of US display compresses CPMs; SMBs demand ROI
Buyers have high leverage: programmatic captured ~85% of US display ad spend in 2024 and compresses CPMs; national seasonality drives CPM volatility. SMBs (99.9% of US firms) compare channels and demand short-term ROI and flexible terms. Listener churn and zero-price alternatives force Audacy into content/UX spend to defend rates.
| Metric | 2024 |
|---|---|
| Programmatic share | ~85% |
| SMB share of firms | 99.9% |
| Typical ROAS gap vs rivals | 10–30% |
What You See Is What You Get
Audacy Porter's Five Forces Analysis
This preview shows the exact Audacy Porter's Five Forces analysis you'll receive immediately after purchase—no placeholders or mockups. The document is fully formatted, professionally written, and ready for download and use the moment you buy. You're getting the final deliverable without delay.











