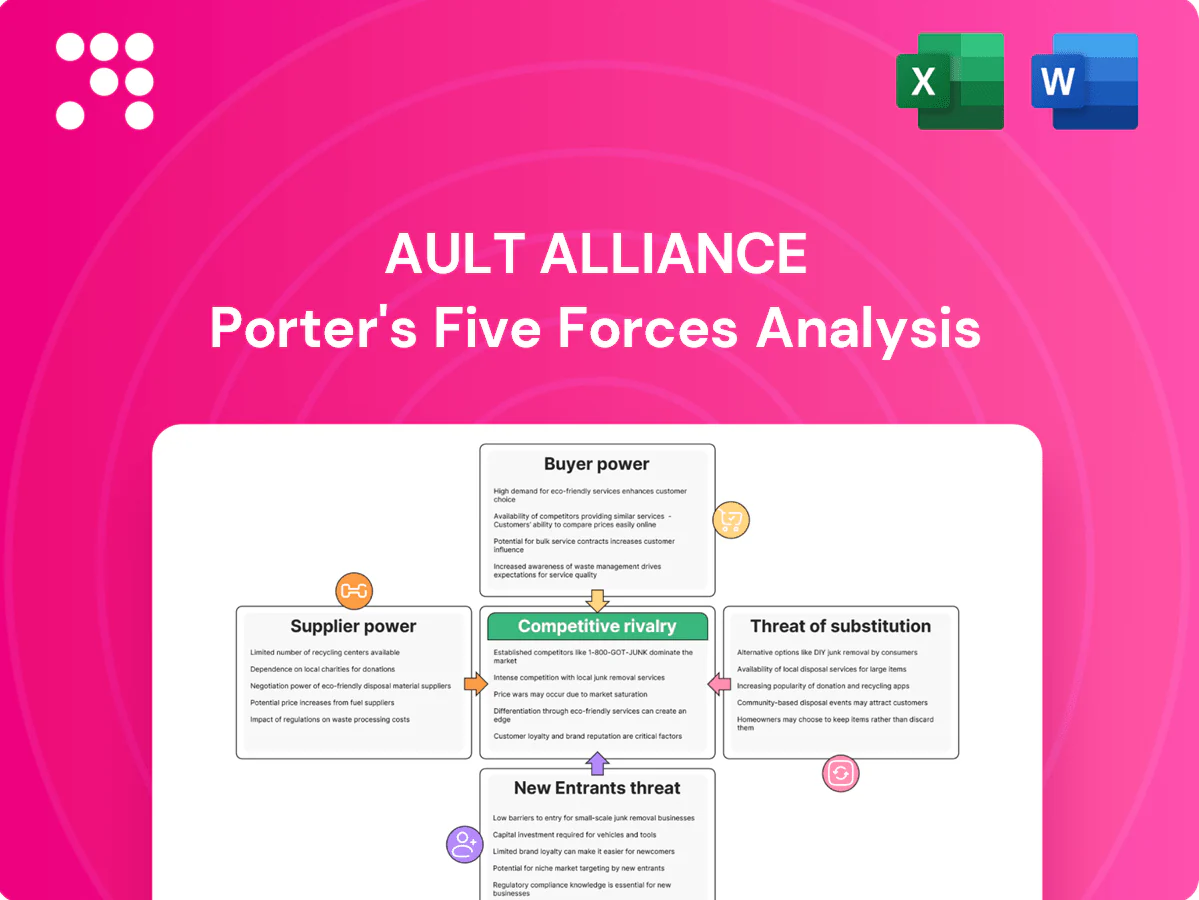
Ault Alliance Porter's Five Forces Analysis

Go Beyond the Preview—Access the Full Strategic Report
Ault Alliance faces moderate buyer power and evolving supplier dynamics as it navigates industry consolidation and regulatory shifts. Competitive rivalry is intensifying with emerging entrants and substitutes pressuring margins, while capital needs and scale provide partial barriers to entry. Our snapshot highlights strategic implications for pricing, partnerships, and risk management. Unlock the full Porter's Five Forces Analysis to explore Ault Alliance’s competitive dynamics, market pressures, and strategic advantages in detail.
Suppliers Bargaining Power

Concentrated mining hardware vendors
ASIC miner supply is concentrated: Bitmain ~55% and MicroBT ~30% of global shipments in 2024, giving price-setting power and delivery prioritization to few vendors.
Lead times of 6–12 months and common prepayment or deposit terms can force unfavorable cash cycles and working capital strain.
Proprietary firmware, warranty and after-sales support create strong lock-in; diversifying suppliers or buying secondary-market units (often 40–70% of new price) reduces but does not eliminate supplier exposure.
Power and grid access constraints
Utilities and IPPs set tariffs, interconnection terms, and curtailment rules that directly shape data center and bitcoin-mining operating costs; US interconnection queues exceeded 1,000 GW in 2024, intensifying delays and bargaining leverage. Regional transmission limits can add demand charges or congestion fees often increasing bills by 10–30%. Long-term PPAs (commonly 5–20 years) mitigate spot exposure but carry renegotiation risk in volatile markets. Supplier power spikes during peak-load periods or fuel-price shocks.

Semiconductor and server supply chains
High-performance servers, GPUs and networking gear face recurring 2024 allocation pressures, with leading foundry TSMC investing roughly US$40B in 2024 to expand capacity and rebalance supply. OEMs and component makers commonly enforce minimum order quantities and premium pricing—customers reported allocation premiums as high as 20–30% during peak cycles. Certification and compatibility requirements (firmware, BIOS, driver stacks) raise switching costs and delay substitutions. Multi-sourcing and inventory buffers (3–6 months in many hyperscalers) partially mitigate but do not eliminate supplier leverage.

Real estate, construction, and EPC partners
Specialized contractors and landlords for data center builds can command premiums, often reported in 2024 at roughly 15–25% above generic project rates in tight markets.
Extended permitting timelines and local labor scarcity in 2024 increased supplier leverage, lengthening delivery by months and raising on-site labor costs.
Fixed-price EPC contracts reduce buyer exposure to overruns but shift risk premiums onto buyers; long-term relationships and secured volume pipelines in 2024 improved pricing and lead times.
- Premiums: 15–25% for specialist contractors (2024)
- Permitting delays: multi-month impacts (2024)
- Fixed-price EPC: transfers overrun risk to buyer
- Volume pipelines: unlock better terms
Software, pool, and hosting dependencies
Software, pool, and hosting dependencies give suppliers leverage: 2024 mining pool fees commonly range 0–2.5% and embedded management fees or data lock-in can compress miner margins rapidly; API changes or fee hikes can shift unit economics within days. Open-source alternatives exist but often lack enterprise SLAs, so contract flexibility and in-house tooling are key to reducing supplier power.
- pool fees: 0–2.5%
- API/fee risk: rapid margin impact
- mitigation: contracts + in-house tools
ASIC duopoly and 6–12 month lead times tighten supply, capex and margins
ASIC supply concentrated: Bitmain ~55%, MicroBT ~30% (2024), enabling price and delivery control.
Long lead times 6–12 months, deposits and proprietary firmware raise switching costs and working-capital strain.
Utilities, EPCs and pools add leverage: US interconnection queue >1,000 GW (2024), contractor premiums 15–25%, pool fees 0–2.5%.
| Metric | 2024 |
|---|---|
| ASIC share (Bitmain) | ~55% |
| Lead time | 6–12 months |
| US interconnection queue | >1,000 GW |
| Contractor premium | 15–25% |
| Pool fees | 0–2.5% |
What is included in the product
 Detailed Word Document
Tailored Porter’s Five Forces analysis for Ault Alliance that identifies competitive intensity, buyer and supplier power, threat of substitutes, and entry barriers, highlighting disruptive threats and strategic levers to protect market share and improve profitability.

 Customizable Excel Spreadsheet
A one-sheet Porter's Five Forces for Ault Alliance that simplifies strategic pressure into an instant radar view, customizable for evolving data and scenarios, easy to copy into decks, no macros required, and ready to swap in your own inputs or duplicate tabs for pre/post-regulation analysis.
Customers Bargaining Power

Enterprise colocation customers
Enterprise colocation customers compare price, uptime, and latency closely, exerting consistent price pressure despite supplier consolidation. Multi-year leases typically run 3–5 years, but renewal risk and competitive RFPs keep effective rates in check. Cross-connects and ancillary services are often negotiable in buyer markets, while differentiation via reliability (typical provider PUE 1.2–1.4) and green energy sourcing helps defend margins.
Hyperscaler and AI workloads
Large hyperscaler tenants (AWS, Azure, GCP ~68% cloud share in 2024) exert outsized bargaining power, demanding custom SLAs, build-to-suit terms and pricing concessions often reaching 20–30%. Landing a hyperscaler improves utilization but can compress project IRRs by ~2–5 percentage points. Control of land, low-cost power and faster delivery timelines materially rebalance negotiations.

Power solutions industrial customers
Industrial buyers run formal competitive bids and prioritize TCO, driving discounts and tougher warranty terms; 2024 surveys show roughly 70% use RFPs and TCO metrics in supplier selection. Switching costs are moderate due to standardized specs and compliance needs, while service contracts (often 10–20% of lifecycle spend) can lock revenue but remain price-sensitive. Demonstrated reliability and certifications cut churn materially, often below 5% annually.

Hosting and managed mining clients
Hosting and managed mining clients exert high bargaining power by comparing all-in $/MWh, uptime (typically 98–99% guarantees in 2024) and curtailment policies; contracts often shift risk via profit-sharing or fixed-rate models. Rig mobility lets buyers relocate to regions with sub-30 $/MWh pricing, increasing leverage. Performance transparency and revenue guarantees are key retention tools.
- All-in cost focus: $/MWh, curtailment rules
- Contract types: profit-share vs fixed-rate
- Leverage: mobility to sub-30 $/MWh markets; 98–99% uptime guarantees
Indirect “buyer” effect via BTC markets
- Halving 04/2024: −50% miner new supply
- Pool fees: ~0.5–2%
- Mitigants: hedging, dynamic curtailment
Hyperscalers ≈68% cloud share; demand 20–30% concessions
Customers exert strong price and SLA pressure across segments, keeping effective rates constrained despite consolidation. Hyperscalers (≈68% cloud share in 2024) demand custom SLAs and 20–30% concessions, while enterprise RFPs (≈70% use TCO) force competitive pricing. Mining and hosting buyers push on $/MWh (<$30 leverage) and uptime (98–99%), with pool fees 0.5–2% and halving 04/2024 cutting miner supply −50%.
| Metric | Value (2024) |
|---|---|
| Hyperscaler cloud share | ≈68% |
| Enterprise RFP usage | ≈70% |
| Typical lease | 3–5 yrs |
| PUE | 1.2–1.4 |
| Uptime guarantees | 98–99% |
| Mining leverage $/MWh | <$30 |
| Pool fees | 0.5–2% |
| Halving | 04/2024 −50% |
Preview the Actual Deliverable
Ault Alliance Porter's Five Forces Analysis
This preview shows the exact Ault Alliance Porter’s Five Forces analysis you’ll receive immediately after purchase—no surprises, no placeholders. The professionally formatted assessment evaluates industry rivalry, supplier and buyer power, threat of substitutes, and barriers to entry, with clear implications for strategy and valuation. You’ll get instant access to this same ready-to-use document upon payment.

Go Beyond the Preview—Access the Full Strategic Report
Ault Alliance faces moderate buyer power and evolving supplier dynamics as it navigates industry consolidation and regulatory shifts. Competitive rivalry is intensifying with emerging entrants and substitutes pressuring margins, while capital needs and scale provide partial barriers to entry. Our snapshot highlights strategic implications for pricing, partnerships, and risk management. Unlock the full Porter's Five Forces Analysis to explore Ault Alliance’s competitive dynamics, market pressures, and strategic advantages in detail.
Suppliers Bargaining Power
Concentrated mining hardware vendors
ASIC miner supply is concentrated: Bitmain ~55% and MicroBT ~30% of global shipments in 2024, giving price-setting power and delivery prioritization to few vendors.
Lead times of 6–12 months and common prepayment or deposit terms can force unfavorable cash cycles and working capital strain.
Proprietary firmware, warranty and after-sales support create strong lock-in; diversifying suppliers or buying secondary-market units (often 40–70% of new price) reduces but does not eliminate supplier exposure.
Power and grid access constraints
Utilities and IPPs set tariffs, interconnection terms, and curtailment rules that directly shape data center and bitcoin-mining operating costs; US interconnection queues exceeded 1,000 GW in 2024, intensifying delays and bargaining leverage. Regional transmission limits can add demand charges or congestion fees often increasing bills by 10–30%. Long-term PPAs (commonly 5–20 years) mitigate spot exposure but carry renegotiation risk in volatile markets. Supplier power spikes during peak-load periods or fuel-price shocks.
Semiconductor and server supply chains
High-performance servers, GPUs and networking gear face recurring 2024 allocation pressures, with leading foundry TSMC investing roughly US$40B in 2024 to expand capacity and rebalance supply. OEMs and component makers commonly enforce minimum order quantities and premium pricing—customers reported allocation premiums as high as 20–30% during peak cycles. Certification and compatibility requirements (firmware, BIOS, driver stacks) raise switching costs and delay substitutions. Multi-sourcing and inventory buffers (3–6 months in many hyperscalers) partially mitigate but do not eliminate supplier leverage.
Real estate, construction, and EPC partners
Specialized contractors and landlords for data center builds can command premiums, often reported in 2024 at roughly 15–25% above generic project rates in tight markets.
Extended permitting timelines and local labor scarcity in 2024 increased supplier leverage, lengthening delivery by months and raising on-site labor costs.
Fixed-price EPC contracts reduce buyer exposure to overruns but shift risk premiums onto buyers; long-term relationships and secured volume pipelines in 2024 improved pricing and lead times.
- Premiums: 15–25% for specialist contractors (2024)
- Permitting delays: multi-month impacts (2024)
- Fixed-price EPC: transfers overrun risk to buyer
- Volume pipelines: unlock better terms
Software, pool, and hosting dependencies
Software, pool, and hosting dependencies give suppliers leverage: 2024 mining pool fees commonly range 0–2.5% and embedded management fees or data lock-in can compress miner margins rapidly; API changes or fee hikes can shift unit economics within days. Open-source alternatives exist but often lack enterprise SLAs, so contract flexibility and in-house tooling are key to reducing supplier power.
- pool fees: 0–2.5%
- API/fee risk: rapid margin impact
- mitigation: contracts + in-house tools
ASIC duopoly and 6–12 month lead times tighten supply, capex and margins
ASIC supply concentrated: Bitmain ~55%, MicroBT ~30% (2024), enabling price and delivery control.
Long lead times 6–12 months, deposits and proprietary firmware raise switching costs and working-capital strain.
Utilities, EPCs and pools add leverage: US interconnection queue >1,000 GW (2024), contractor premiums 15–25%, pool fees 0–2.5%.
| Metric | 2024 |
|---|---|
| ASIC share (Bitmain) | ~55% |
| Lead time | 6–12 months |
| US interconnection queue | >1,000 GW |
| Contractor premium | 15–25% |
| Pool fees | 0–2.5% |
What is included in the product
Detailed Word Document
Tailored Porter’s Five Forces analysis for Ault Alliance that identifies competitive intensity, buyer and supplier power, threat of substitutes, and entry barriers, highlighting disruptive threats and strategic levers to protect market share and improve profitability.
Customizable Excel Spreadsheet
A one-sheet Porter's Five Forces for Ault Alliance that simplifies strategic pressure into an instant radar view, customizable for evolving data and scenarios, easy to copy into decks, no macros required, and ready to swap in your own inputs or duplicate tabs for pre/post-regulation analysis.
Customers Bargaining Power
Enterprise colocation customers
Enterprise colocation customers compare price, uptime, and latency closely, exerting consistent price pressure despite supplier consolidation. Multi-year leases typically run 3–5 years, but renewal risk and competitive RFPs keep effective rates in check. Cross-connects and ancillary services are often negotiable in buyer markets, while differentiation via reliability (typical provider PUE 1.2–1.4) and green energy sourcing helps defend margins.
Hyperscaler and AI workloads
Large hyperscaler tenants (AWS, Azure, GCP ~68% cloud share in 2024) exert outsized bargaining power, demanding custom SLAs, build-to-suit terms and pricing concessions often reaching 20–30%. Landing a hyperscaler improves utilization but can compress project IRRs by ~2–5 percentage points. Control of land, low-cost power and faster delivery timelines materially rebalance negotiations.
Power solutions industrial customers
Industrial buyers run formal competitive bids and prioritize TCO, driving discounts and tougher warranty terms; 2024 surveys show roughly 70% use RFPs and TCO metrics in supplier selection. Switching costs are moderate due to standardized specs and compliance needs, while service contracts (often 10–20% of lifecycle spend) can lock revenue but remain price-sensitive. Demonstrated reliability and certifications cut churn materially, often below 5% annually.
Hosting and managed mining clients
Hosting and managed mining clients exert high bargaining power by comparing all-in $/MWh, uptime (typically 98–99% guarantees in 2024) and curtailment policies; contracts often shift risk via profit-sharing or fixed-rate models. Rig mobility lets buyers relocate to regions with sub-30 $/MWh pricing, increasing leverage. Performance transparency and revenue guarantees are key retention tools.
- All-in cost focus: $/MWh, curtailment rules
- Contract types: profit-share vs fixed-rate
- Leverage: mobility to sub-30 $/MWh markets; 98–99% uptime guarantees
Indirect “buyer” effect via BTC markets
- Halving 04/2024: −50% miner new supply
- Pool fees: ~0.5–2%
- Mitigants: hedging, dynamic curtailment
Hyperscalers ≈68% cloud share; demand 20–30% concessions
Customers exert strong price and SLA pressure across segments, keeping effective rates constrained despite consolidation. Hyperscalers (≈68% cloud share in 2024) demand custom SLAs and 20–30% concessions, while enterprise RFPs (≈70% use TCO) force competitive pricing. Mining and hosting buyers push on $/MWh (<$30 leverage) and uptime (98–99%), with pool fees 0.5–2% and halving 04/2024 cutting miner supply −50%.
| Metric | Value (2024) |
|---|---|
| Hyperscaler cloud share | ≈68% |
| Enterprise RFP usage | ≈70% |
| Typical lease | 3–5 yrs |
| PUE | 1.2–1.4 |
| Uptime guarantees | 98–99% |
| Mining leverage $/MWh | <$30 |
| Pool fees | 0.5–2% |
| Halving | 04/2024 −50% |
Preview the Actual Deliverable
Ault Alliance Porter's Five Forces Analysis
This preview shows the exact Ault Alliance Porter’s Five Forces analysis you’ll receive immediately after purchase—no surprises, no placeholders. The professionally formatted assessment evaluates industry rivalry, supplier and buyer power, threat of substitutes, and barriers to entry, with clear implications for strategy and valuation. You’ll get instant access to this same ready-to-use document upon payment.
Description
Go Beyond the Preview—Access the Full Strategic Report
Ault Alliance faces moderate buyer power and evolving supplier dynamics as it navigates industry consolidation and regulatory shifts. Competitive rivalry is intensifying with emerging entrants and substitutes pressuring margins, while capital needs and scale provide partial barriers to entry. Our snapshot highlights strategic implications for pricing, partnerships, and risk management. Unlock the full Porter's Five Forces Analysis to explore Ault Alliance’s competitive dynamics, market pressures, and strategic advantages in detail.
Suppliers Bargaining Power
Concentrated mining hardware vendors
ASIC miner supply is concentrated: Bitmain ~55% and MicroBT ~30% of global shipments in 2024, giving price-setting power and delivery prioritization to few vendors.
Lead times of 6–12 months and common prepayment or deposit terms can force unfavorable cash cycles and working capital strain.
Proprietary firmware, warranty and after-sales support create strong lock-in; diversifying suppliers or buying secondary-market units (often 40–70% of new price) reduces but does not eliminate supplier exposure.
Power and grid access constraints
Utilities and IPPs set tariffs, interconnection terms, and curtailment rules that directly shape data center and bitcoin-mining operating costs; US interconnection queues exceeded 1,000 GW in 2024, intensifying delays and bargaining leverage. Regional transmission limits can add demand charges or congestion fees often increasing bills by 10–30%. Long-term PPAs (commonly 5–20 years) mitigate spot exposure but carry renegotiation risk in volatile markets. Supplier power spikes during peak-load periods or fuel-price shocks.
Semiconductor and server supply chains
High-performance servers, GPUs and networking gear face recurring 2024 allocation pressures, with leading foundry TSMC investing roughly US$40B in 2024 to expand capacity and rebalance supply. OEMs and component makers commonly enforce minimum order quantities and premium pricing—customers reported allocation premiums as high as 20–30% during peak cycles. Certification and compatibility requirements (firmware, BIOS, driver stacks) raise switching costs and delay substitutions. Multi-sourcing and inventory buffers (3–6 months in many hyperscalers) partially mitigate but do not eliminate supplier leverage.
Real estate, construction, and EPC partners
Specialized contractors and landlords for data center builds can command premiums, often reported in 2024 at roughly 15–25% above generic project rates in tight markets.
Extended permitting timelines and local labor scarcity in 2024 increased supplier leverage, lengthening delivery by months and raising on-site labor costs.
Fixed-price EPC contracts reduce buyer exposure to overruns but shift risk premiums onto buyers; long-term relationships and secured volume pipelines in 2024 improved pricing and lead times.
- Premiums: 15–25% for specialist contractors (2024)
- Permitting delays: multi-month impacts (2024)
- Fixed-price EPC: transfers overrun risk to buyer
- Volume pipelines: unlock better terms
Software, pool, and hosting dependencies
Software, pool, and hosting dependencies give suppliers leverage: 2024 mining pool fees commonly range 0–2.5% and embedded management fees or data lock-in can compress miner margins rapidly; API changes or fee hikes can shift unit economics within days. Open-source alternatives exist but often lack enterprise SLAs, so contract flexibility and in-house tooling are key to reducing supplier power.
- pool fees: 0–2.5%
- API/fee risk: rapid margin impact
- mitigation: contracts + in-house tools
ASIC duopoly and 6–12 month lead times tighten supply, capex and margins
ASIC supply concentrated: Bitmain ~55%, MicroBT ~30% (2024), enabling price and delivery control.
Long lead times 6–12 months, deposits and proprietary firmware raise switching costs and working-capital strain.
Utilities, EPCs and pools add leverage: US interconnection queue >1,000 GW (2024), contractor premiums 15–25%, pool fees 0–2.5%.
| Metric | 2024 |
|---|---|
| ASIC share (Bitmain) | ~55% |
| Lead time | 6–12 months |
| US interconnection queue | >1,000 GW |
| Contractor premium | 15–25% |
| Pool fees | 0–2.5% |
What is included in the product
Detailed Word Document
Tailored Porter’s Five Forces analysis for Ault Alliance that identifies competitive intensity, buyer and supplier power, threat of substitutes, and entry barriers, highlighting disruptive threats and strategic levers to protect market share and improve profitability.
Customizable Excel Spreadsheet
A one-sheet Porter's Five Forces for Ault Alliance that simplifies strategic pressure into an instant radar view, customizable for evolving data and scenarios, easy to copy into decks, no macros required, and ready to swap in your own inputs or duplicate tabs for pre/post-regulation analysis.
Customers Bargaining Power
Enterprise colocation customers
Enterprise colocation customers compare price, uptime, and latency closely, exerting consistent price pressure despite supplier consolidation. Multi-year leases typically run 3–5 years, but renewal risk and competitive RFPs keep effective rates in check. Cross-connects and ancillary services are often negotiable in buyer markets, while differentiation via reliability (typical provider PUE 1.2–1.4) and green energy sourcing helps defend margins.
Hyperscaler and AI workloads
Large hyperscaler tenants (AWS, Azure, GCP ~68% cloud share in 2024) exert outsized bargaining power, demanding custom SLAs, build-to-suit terms and pricing concessions often reaching 20–30%. Landing a hyperscaler improves utilization but can compress project IRRs by ~2–5 percentage points. Control of land, low-cost power and faster delivery timelines materially rebalance negotiations.
Power solutions industrial customers
Industrial buyers run formal competitive bids and prioritize TCO, driving discounts and tougher warranty terms; 2024 surveys show roughly 70% use RFPs and TCO metrics in supplier selection. Switching costs are moderate due to standardized specs and compliance needs, while service contracts (often 10–20% of lifecycle spend) can lock revenue but remain price-sensitive. Demonstrated reliability and certifications cut churn materially, often below 5% annually.
Hosting and managed mining clients
Hosting and managed mining clients exert high bargaining power by comparing all-in $/MWh, uptime (typically 98–99% guarantees in 2024) and curtailment policies; contracts often shift risk via profit-sharing or fixed-rate models. Rig mobility lets buyers relocate to regions with sub-30 $/MWh pricing, increasing leverage. Performance transparency and revenue guarantees are key retention tools.
- All-in cost focus: $/MWh, curtailment rules
- Contract types: profit-share vs fixed-rate
- Leverage: mobility to sub-30 $/MWh markets; 98–99% uptime guarantees
Indirect “buyer” effect via BTC markets
- Halving 04/2024: −50% miner new supply
- Pool fees: ~0.5–2%
- Mitigants: hedging, dynamic curtailment
Hyperscalers ≈68% cloud share; demand 20–30% concessions
Customers exert strong price and SLA pressure across segments, keeping effective rates constrained despite consolidation. Hyperscalers (≈68% cloud share in 2024) demand custom SLAs and 20–30% concessions, while enterprise RFPs (≈70% use TCO) force competitive pricing. Mining and hosting buyers push on $/MWh (<$30 leverage) and uptime (98–99%), with pool fees 0.5–2% and halving 04/2024 cutting miner supply −50%.
| Metric | Value (2024) |
|---|---|
| Hyperscaler cloud share | ≈68% |
| Enterprise RFP usage | ≈70% |
| Typical lease | 3–5 yrs |
| PUE | 1.2–1.4 |
| Uptime guarantees | 98–99% |
| Mining leverage $/MWh | <$30 |
| Pool fees | 0.5–2% |
| Halving | 04/2024 −50% |
Preview the Actual Deliverable
Ault Alliance Porter's Five Forces Analysis
This preview shows the exact Ault Alliance Porter’s Five Forces analysis you’ll receive immediately after purchase—no surprises, no placeholders. The professionally formatted assessment evaluates industry rivalry, supplier and buyer power, threat of substitutes, and barriers to entry, with clear implications for strategy and valuation. You’ll get instant access to this same ready-to-use document upon payment.











