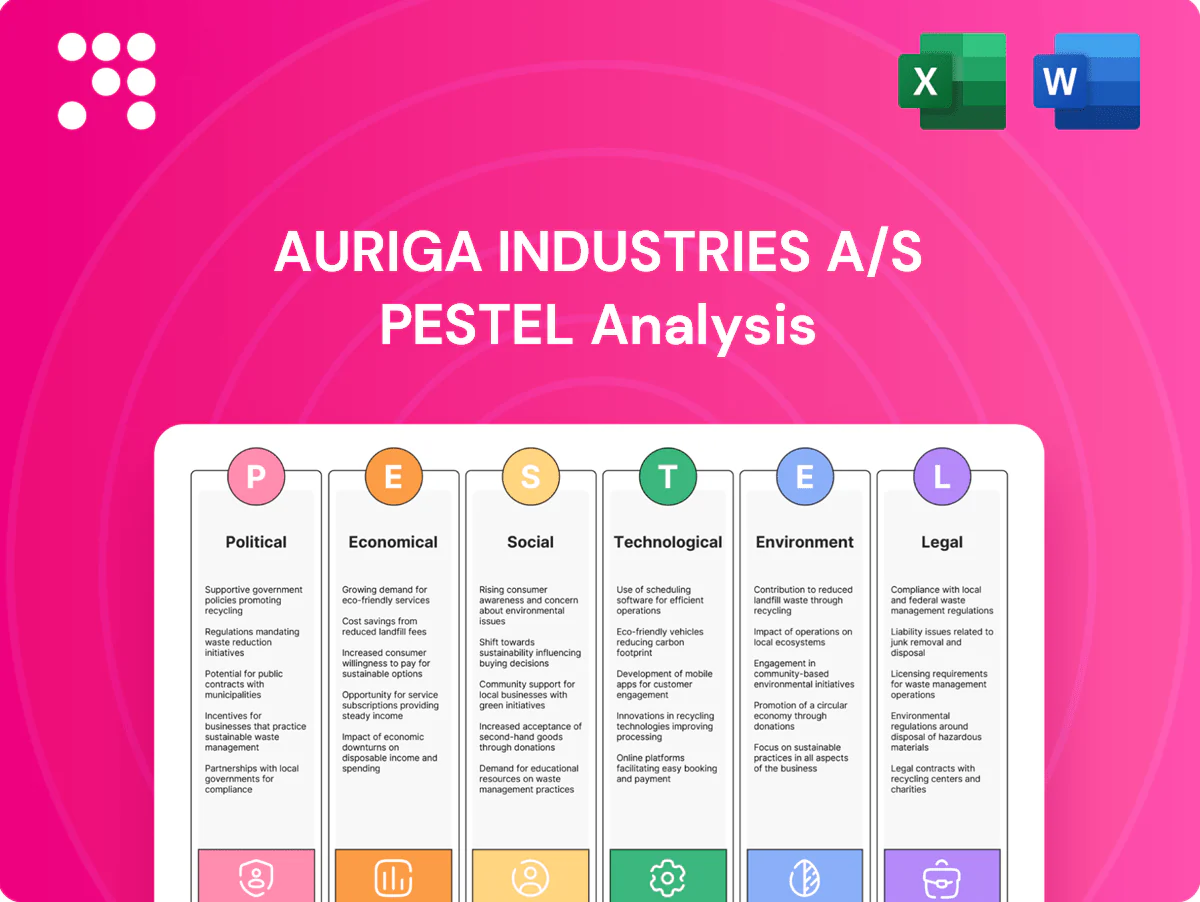
Auriga Industries A/S PESTLE Analysis

Skip the Research. Get the Strategy.
Unlock strategic clarity with our PESTLE Analysis of Auriga Industries A/S—three concise sections reveal how political shifts, economic cycles, and tech trends could alter the company’s trajectory. Perfect for investors and strategists needing rapid, reliable insight. Purchase the full report to access the complete, actionable breakdown instantly.
Political factors

EU ag policy and subsidies
EU Common Agricultural Policy 2021–27 allocates about €387.4 billion and its Farm to Fork target of 25% organic land by 2030 steers demand to sustainable inputs and integrated pest management; changes in subsidy criteria can quickly shift product mix and pricing power, so alignment with national implementation secures market access and co-funding while close monitoring of CAP reforms and eco-schemes is critical for positioning biological, low-impact solutions.
Regulatory stance on pesticides
Governmental tolerance for active ingredients varies by region and election cycle; the EU Farm to Fork plan targets a 50% reduction in chemical pesticide use by 2030, heightening delistings and regional bans. Accelerated phase-outs can strand assets but expand biologics opportunities as that sector is growing at ~12% CAGR. Proactive reformulation and pipeline substitution reduce policy shocks, and stakeholder engagement helps shape realistic transition timelines.

Trade policy and tariffs
Tariffs on chemical intermediates and ag commodities have driven swings in landed input costs—fertilizer and intermediates volatility peaked in 2022 and prices fell roughly 40% by mid‑2024—squeezing farm purchasing power against a global crop protection market near USD 63 billion in 2023. Export restrictions and SPS measures have repeatedly disrupted distribution in 2022–24, while diversified sourcing and local manufacturing materially reduce exposure. Active trade diplomacy in key markets (EU, US, Brazil, India) underpins continuity for Auriga’s crop protection portfolio.

Geopolitical supply risk
Conflicts and sanctions can curtail access to feedstocks, packaging and logistics corridors — notably Russia and Belarus provided roughly 20% of global potash exports in 2022–23, highlighting fertilizer feedstock concentration risks; political instability in emerging ag markets routinely delays registrations and collections, extending time-to-revenue. Dual-sourcing and regional inventory buffers reduce single‑point failures, while scenario planning aligns capital allocation with risk‑adjusted returns.
- Supply concentration: Russia/Belarus ~20% potash (2022–23)
- Operational lag: registration delays in emerging markets increase collection timelines
- Mitigation: dual‑sourcing + regional buffers
- Governance: scenario planning for capex allocation
Public funding for sustainable farming
EU funds and Farm-to-Fork push biologics growth; 50% pesticide cut accelerates delistings
EU CAP 2021–27 (€387.4bn) and NextGenerationEU (~€800bn) steer demand to biologicals and precision ag, supporting Auriga’s low‑impact pipeline. EU Farm-to-Fork targets 50% pesticide reduction by 2030 accelerate delistings; biologics growing ~12% CAGR and global crop protection ≈USD63bn (2023). Trade shocks, potash concentration (~20% Russia/Belarus 2022–23) and ~40% fertilizer price drop by mid‑2024 stress sourcing and margins.
| Indicator | Value |
|---|---|
| CAP 2021–27 | €387.4bn |
| NextGenerationEU | ~€800bn |
| Farm‑to‑Fork goal | 50% pesticide cut by 2030 |
| Biologics CAGR | ~12% |
| Crop protection market | ~USD63bn (2023) |
| Potash share (RUS/BLR) | ~20% (2022–23) |
| Fertilizer price change | ≈−40% by mid‑2024 |
What is included in the product
 Detailed Word Document
Explores how political, economic, social, technological, environmental and legal forces uniquely affect Auriga Industries A/S, combining data-driven trends and region-specific regulatory insights. Designed for executives and investors, it identifies actionable risks and opportunities with forward-looking implications for strategy and funding.

 Customizable Excel Spreadsheet
A clean, summarized PESTLE of Auriga Industries A/S that distills regulatory, economic, social, technological, environmental and political drivers into one-slide insights for faster decision-making. Perfect for dropping into presentations or sharing across teams to align on external risks and market positioning.
Economic factors

Farm income cycles
Farmer cash flows track crop prices, input costs and weather, creating elastic demand for Auriga's protection products; high-commodity-margin periods favor uptake of premium sustainable inputs while downturns shift purchases to generics and smaller pack sizes. Flexible pricing, credit and pack-sizing smooth revenue volatility and preserve market share for Auriga across cycles.
Input inflation and energy costs
Rising energy, solvent and packaging costs have compressed formulations margins; Brent crude averaged about $82/bbl in 2024, keeping feedstock and transport costs elevated. Cost pass-through varies with brand strength and local competitive intensity, limiting pricing power in commoditised segments. Efficiency programs and contract manufacturing have reduced overheads, while hedging and long-term supply contracts have helped stabilise COGS.

FX volatility
FX volatility materially affects Auriga Industries A/S as revenues and costs span USD, EUR and emerging-market currencies, creating translation and transaction risk and impacting reported EBIT and covenant headroom. Exchange-rate swings—EUR/USD moved roughly 8–12% between 2023–2024—have amplified profit variability. Natural hedges and derivatives are used to protect cash flows, while pricing clauses indexed to FX help distributors and farmers pass through costs.

M&A and consolidation
Cost of capital
Rising benchmark rates (ECB deposit ~4.00% mid-2024) elevate Auriga’s internal hurdle rates for R&D and capacity projects, pushing management toward capital-light biologicals and partnership models that limit upfront spend. Use of performance-linked financing and green bonds—shown to lower WACC by ~50–150 bps in recent market studies—increases attractiveness of sustainable projects. Disciplined capital allocation now prioritizes fast-payback innovations and smaller-scale launches to protect ROIC.
- Higher policy rates -> higher hurdle rates
- Capital-light biologicals & partnerships preferred
- Green bonds/performance financing reduce WACC ~50–150 bps
- Focus on fast-payback, high-ROIC projects
EU funds and Farm-to-Fork push biologics growth; 50% pesticide cut accelerates delistings
Farmer cash flows tied to crop prices and weather create elastic demand for Auriga’s protection products, with premium uptake in high-commodity-margin periods and shifts to generics in downturns. Brent crude averaged $82/bbl in 2024, keeping feedstock and transport costs elevated and compressing margins. EUR/USD moved ~8–12% in 2023–24, driving translation and transaction risk despite hedging. ECB deposit ~4.00% mid-2024 raises hurdle rates, favoring capital-light biologicals.
| Metric | 2024/2023–24 |
|---|---|
| Brent crude | $82/bbl (2024) |
| EUR/USD swing | ~8–12% (2023–24) |
| ECB deposit rate | ~4.00% (mid-2024) |
| ROIC uplift from M&A | 200–500 bps |
| WACC reduction via green bonds | 50–150 bps |
Same Document Delivered
Auriga Industries A/S PESTLE Analysis
Auriga Industries A/S PESTLE Analysis provides a structured review of political, economic, social, technological, legal and environmental factors affecting the company and its markets, with actionable insights for strategic decisions. The preview shown here is the exact document you’ll receive after purchase—fully formatted and ready to use. It’s the final, professional file ready for immediate download and implementation.

Skip the Research. Get the Strategy.
Unlock strategic clarity with our PESTLE Analysis of Auriga Industries A/S—three concise sections reveal how political shifts, economic cycles, and tech trends could alter the company’s trajectory. Perfect for investors and strategists needing rapid, reliable insight. Purchase the full report to access the complete, actionable breakdown instantly.
Political factors
EU ag policy and subsidies
EU Common Agricultural Policy 2021–27 allocates about €387.4 billion and its Farm to Fork target of 25% organic land by 2030 steers demand to sustainable inputs and integrated pest management; changes in subsidy criteria can quickly shift product mix and pricing power, so alignment with national implementation secures market access and co-funding while close monitoring of CAP reforms and eco-schemes is critical for positioning biological, low-impact solutions.
Regulatory stance on pesticides
Governmental tolerance for active ingredients varies by region and election cycle; the EU Farm to Fork plan targets a 50% reduction in chemical pesticide use by 2030, heightening delistings and regional bans. Accelerated phase-outs can strand assets but expand biologics opportunities as that sector is growing at ~12% CAGR. Proactive reformulation and pipeline substitution reduce policy shocks, and stakeholder engagement helps shape realistic transition timelines.
Trade policy and tariffs
Tariffs on chemical intermediates and ag commodities have driven swings in landed input costs—fertilizer and intermediates volatility peaked in 2022 and prices fell roughly 40% by mid‑2024—squeezing farm purchasing power against a global crop protection market near USD 63 billion in 2023. Export restrictions and SPS measures have repeatedly disrupted distribution in 2022–24, while diversified sourcing and local manufacturing materially reduce exposure. Active trade diplomacy in key markets (EU, US, Brazil, India) underpins continuity for Auriga’s crop protection portfolio.
Geopolitical supply risk
Conflicts and sanctions can curtail access to feedstocks, packaging and logistics corridors — notably Russia and Belarus provided roughly 20% of global potash exports in 2022–23, highlighting fertilizer feedstock concentration risks; political instability in emerging ag markets routinely delays registrations and collections, extending time-to-revenue. Dual-sourcing and regional inventory buffers reduce single‑point failures, while scenario planning aligns capital allocation with risk‑adjusted returns.
- Supply concentration: Russia/Belarus ~20% potash (2022–23)
- Operational lag: registration delays in emerging markets increase collection timelines
- Mitigation: dual‑sourcing + regional buffers
- Governance: scenario planning for capex allocation
Public funding for sustainable farming
EU funds and Farm-to-Fork push biologics growth; 50% pesticide cut accelerates delistings
EU CAP 2021–27 (€387.4bn) and NextGenerationEU (~€800bn) steer demand to biologicals and precision ag, supporting Auriga’s low‑impact pipeline. EU Farm-to-Fork targets 50% pesticide reduction by 2030 accelerate delistings; biologics growing ~12% CAGR and global crop protection ≈USD63bn (2023). Trade shocks, potash concentration (~20% Russia/Belarus 2022–23) and ~40% fertilizer price drop by mid‑2024 stress sourcing and margins.
| Indicator | Value |
|---|---|
| CAP 2021–27 | €387.4bn |
| NextGenerationEU | ~€800bn |
| Farm‑to‑Fork goal | 50% pesticide cut by 2030 |
| Biologics CAGR | ~12% |
| Crop protection market | ~USD63bn (2023) |
| Potash share (RUS/BLR) | ~20% (2022–23) |
| Fertilizer price change | ≈−40% by mid‑2024 |
What is included in the product
Detailed Word Document
Explores how political, economic, social, technological, environmental and legal forces uniquely affect Auriga Industries A/S, combining data-driven trends and region-specific regulatory insights. Designed for executives and investors, it identifies actionable risks and opportunities with forward-looking implications for strategy and funding.
Customizable Excel Spreadsheet
A clean, summarized PESTLE of Auriga Industries A/S that distills regulatory, economic, social, technological, environmental and political drivers into one-slide insights for faster decision-making. Perfect for dropping into presentations or sharing across teams to align on external risks and market positioning.
Economic factors
Farm income cycles
Farmer cash flows track crop prices, input costs and weather, creating elastic demand for Auriga's protection products; high-commodity-margin periods favor uptake of premium sustainable inputs while downturns shift purchases to generics and smaller pack sizes. Flexible pricing, credit and pack-sizing smooth revenue volatility and preserve market share for Auriga across cycles.
Input inflation and energy costs
Rising energy, solvent and packaging costs have compressed formulations margins; Brent crude averaged about $82/bbl in 2024, keeping feedstock and transport costs elevated. Cost pass-through varies with brand strength and local competitive intensity, limiting pricing power in commoditised segments. Efficiency programs and contract manufacturing have reduced overheads, while hedging and long-term supply contracts have helped stabilise COGS.
FX volatility
FX volatility materially affects Auriga Industries A/S as revenues and costs span USD, EUR and emerging-market currencies, creating translation and transaction risk and impacting reported EBIT and covenant headroom. Exchange-rate swings—EUR/USD moved roughly 8–12% between 2023–2024—have amplified profit variability. Natural hedges and derivatives are used to protect cash flows, while pricing clauses indexed to FX help distributors and farmers pass through costs.
M&A and consolidation
Cost of capital
Rising benchmark rates (ECB deposit ~4.00% mid-2024) elevate Auriga’s internal hurdle rates for R&D and capacity projects, pushing management toward capital-light biologicals and partnership models that limit upfront spend. Use of performance-linked financing and green bonds—shown to lower WACC by ~50–150 bps in recent market studies—increases attractiveness of sustainable projects. Disciplined capital allocation now prioritizes fast-payback innovations and smaller-scale launches to protect ROIC.
- Higher policy rates -> higher hurdle rates
- Capital-light biologicals & partnerships preferred
- Green bonds/performance financing reduce WACC ~50–150 bps
- Focus on fast-payback, high-ROIC projects
EU funds and Farm-to-Fork push biologics growth; 50% pesticide cut accelerates delistings
Farmer cash flows tied to crop prices and weather create elastic demand for Auriga’s protection products, with premium uptake in high-commodity-margin periods and shifts to generics in downturns. Brent crude averaged $82/bbl in 2024, keeping feedstock and transport costs elevated and compressing margins. EUR/USD moved ~8–12% in 2023–24, driving translation and transaction risk despite hedging. ECB deposit ~4.00% mid-2024 raises hurdle rates, favoring capital-light biologicals.
| Metric | 2024/2023–24 |
|---|---|
| Brent crude | $82/bbl (2024) |
| EUR/USD swing | ~8–12% (2023–24) |
| ECB deposit rate | ~4.00% (mid-2024) |
| ROIC uplift from M&A | 200–500 bps |
| WACC reduction via green bonds | 50–150 bps |
Same Document Delivered
Auriga Industries A/S PESTLE Analysis
Auriga Industries A/S PESTLE Analysis provides a structured review of political, economic, social, technological, legal and environmental factors affecting the company and its markets, with actionable insights for strategic decisions. The preview shown here is the exact document you’ll receive after purchase—fully formatted and ready to use. It’s the final, professional file ready for immediate download and implementation.
Original: $10.00
-65%$10.00
$3.50Description
Skip the Research. Get the Strategy.
Unlock strategic clarity with our PESTLE Analysis of Auriga Industries A/S—three concise sections reveal how political shifts, economic cycles, and tech trends could alter the company’s trajectory. Perfect for investors and strategists needing rapid, reliable insight. Purchase the full report to access the complete, actionable breakdown instantly.
Political factors
EU ag policy and subsidies
EU Common Agricultural Policy 2021–27 allocates about €387.4 billion and its Farm to Fork target of 25% organic land by 2030 steers demand to sustainable inputs and integrated pest management; changes in subsidy criteria can quickly shift product mix and pricing power, so alignment with national implementation secures market access and co-funding while close monitoring of CAP reforms and eco-schemes is critical for positioning biological, low-impact solutions.
Regulatory stance on pesticides
Governmental tolerance for active ingredients varies by region and election cycle; the EU Farm to Fork plan targets a 50% reduction in chemical pesticide use by 2030, heightening delistings and regional bans. Accelerated phase-outs can strand assets but expand biologics opportunities as that sector is growing at ~12% CAGR. Proactive reformulation and pipeline substitution reduce policy shocks, and stakeholder engagement helps shape realistic transition timelines.
Trade policy and tariffs
Tariffs on chemical intermediates and ag commodities have driven swings in landed input costs—fertilizer and intermediates volatility peaked in 2022 and prices fell roughly 40% by mid‑2024—squeezing farm purchasing power against a global crop protection market near USD 63 billion in 2023. Export restrictions and SPS measures have repeatedly disrupted distribution in 2022–24, while diversified sourcing and local manufacturing materially reduce exposure. Active trade diplomacy in key markets (EU, US, Brazil, India) underpins continuity for Auriga’s crop protection portfolio.
Geopolitical supply risk
Conflicts and sanctions can curtail access to feedstocks, packaging and logistics corridors — notably Russia and Belarus provided roughly 20% of global potash exports in 2022–23, highlighting fertilizer feedstock concentration risks; political instability in emerging ag markets routinely delays registrations and collections, extending time-to-revenue. Dual-sourcing and regional inventory buffers reduce single‑point failures, while scenario planning aligns capital allocation with risk‑adjusted returns.
- Supply concentration: Russia/Belarus ~20% potash (2022–23)
- Operational lag: registration delays in emerging markets increase collection timelines
- Mitigation: dual‑sourcing + regional buffers
- Governance: scenario planning for capex allocation
Public funding for sustainable farming
EU funds and Farm-to-Fork push biologics growth; 50% pesticide cut accelerates delistings
EU CAP 2021–27 (€387.4bn) and NextGenerationEU (~€800bn) steer demand to biologicals and precision ag, supporting Auriga’s low‑impact pipeline. EU Farm-to-Fork targets 50% pesticide reduction by 2030 accelerate delistings; biologics growing ~12% CAGR and global crop protection ≈USD63bn (2023). Trade shocks, potash concentration (~20% Russia/Belarus 2022–23) and ~40% fertilizer price drop by mid‑2024 stress sourcing and margins.
| Indicator | Value |
|---|---|
| CAP 2021–27 | €387.4bn |
| NextGenerationEU | ~€800bn |
| Farm‑to‑Fork goal | 50% pesticide cut by 2030 |
| Biologics CAGR | ~12% |
| Crop protection market | ~USD63bn (2023) |
| Potash share (RUS/BLR) | ~20% (2022–23) |
| Fertilizer price change | ≈−40% by mid‑2024 |
What is included in the product
Detailed Word Document
Explores how political, economic, social, technological, environmental and legal forces uniquely affect Auriga Industries A/S, combining data-driven trends and region-specific regulatory insights. Designed for executives and investors, it identifies actionable risks and opportunities with forward-looking implications for strategy and funding.
Customizable Excel Spreadsheet
A clean, summarized PESTLE of Auriga Industries A/S that distills regulatory, economic, social, technological, environmental and political drivers into one-slide insights for faster decision-making. Perfect for dropping into presentations or sharing across teams to align on external risks and market positioning.
Economic factors
Farm income cycles
Farmer cash flows track crop prices, input costs and weather, creating elastic demand for Auriga's protection products; high-commodity-margin periods favor uptake of premium sustainable inputs while downturns shift purchases to generics and smaller pack sizes. Flexible pricing, credit and pack-sizing smooth revenue volatility and preserve market share for Auriga across cycles.
Input inflation and energy costs
Rising energy, solvent and packaging costs have compressed formulations margins; Brent crude averaged about $82/bbl in 2024, keeping feedstock and transport costs elevated. Cost pass-through varies with brand strength and local competitive intensity, limiting pricing power in commoditised segments. Efficiency programs and contract manufacturing have reduced overheads, while hedging and long-term supply contracts have helped stabilise COGS.
FX volatility
FX volatility materially affects Auriga Industries A/S as revenues and costs span USD, EUR and emerging-market currencies, creating translation and transaction risk and impacting reported EBIT and covenant headroom. Exchange-rate swings—EUR/USD moved roughly 8–12% between 2023–2024—have amplified profit variability. Natural hedges and derivatives are used to protect cash flows, while pricing clauses indexed to FX help distributors and farmers pass through costs.
M&A and consolidation
Cost of capital
Rising benchmark rates (ECB deposit ~4.00% mid-2024) elevate Auriga’s internal hurdle rates for R&D and capacity projects, pushing management toward capital-light biologicals and partnership models that limit upfront spend. Use of performance-linked financing and green bonds—shown to lower WACC by ~50–150 bps in recent market studies—increases attractiveness of sustainable projects. Disciplined capital allocation now prioritizes fast-payback innovations and smaller-scale launches to protect ROIC.
- Higher policy rates -> higher hurdle rates
- Capital-light biologicals & partnerships preferred
- Green bonds/performance financing reduce WACC ~50–150 bps
- Focus on fast-payback, high-ROIC projects
EU funds and Farm-to-Fork push biologics growth; 50% pesticide cut accelerates delistings
Farmer cash flows tied to crop prices and weather create elastic demand for Auriga’s protection products, with premium uptake in high-commodity-margin periods and shifts to generics in downturns. Brent crude averaged $82/bbl in 2024, keeping feedstock and transport costs elevated and compressing margins. EUR/USD moved ~8–12% in 2023–24, driving translation and transaction risk despite hedging. ECB deposit ~4.00% mid-2024 raises hurdle rates, favoring capital-light biologicals.
| Metric | 2024/2023–24 |
|---|---|
| Brent crude | $82/bbl (2024) |
| EUR/USD swing | ~8–12% (2023–24) |
| ECB deposit rate | ~4.00% (mid-2024) |
| ROIC uplift from M&A | 200–500 bps |
| WACC reduction via green bonds | 50–150 bps |
Same Document Delivered
Auriga Industries A/S PESTLE Analysis
Auriga Industries A/S PESTLE Analysis provides a structured review of political, economic, social, technological, legal and environmental factors affecting the company and its markets, with actionable insights for strategic decisions. The preview shown here is the exact document you’ll receive after purchase—fully formatted and ready to use. It’s the final, professional file ready for immediate download and implementation.











