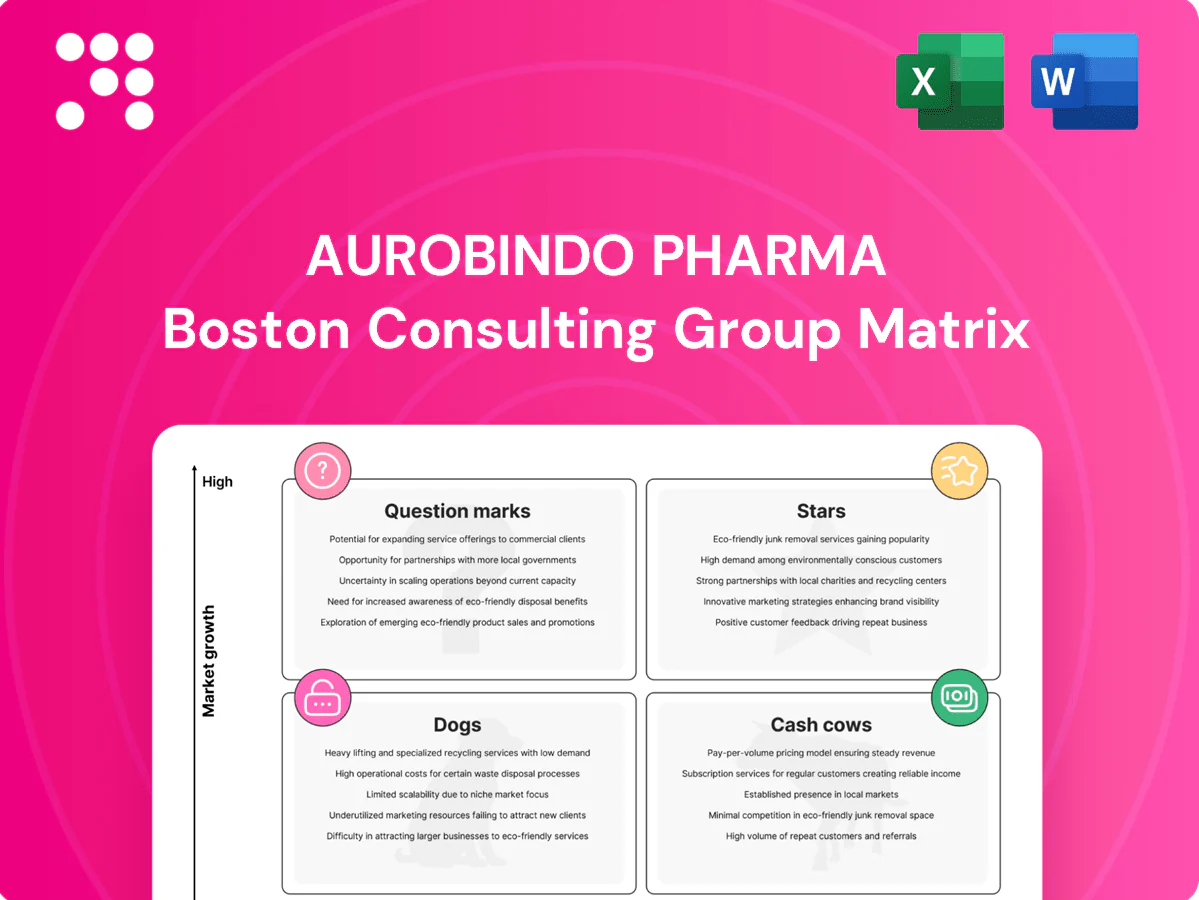
Aurobindo Pharma Boston Consulting Group Matrix

Actionable Strategy Starts Here
Want a quick, clear read on Aurobindo Pharma’s product portfolio? Our BCG Matrix preview shows which lines are scaling and which are bleeding cash—real signals, no fluff. Purchase the full BCG Matrix for quadrant-by-quadrant placement, data-backed recommendations, and ready-to-use Word and Excel deliverables to act on immediately.
Stars

US sterile injectables
US sterile injectables are a Star for Aurobindo: 2024 hospital demand is rising and the company’s expanding sterile capacity gives it real heft. High utilization, frequent launches, and sticky supply contracts have steadily pushed market share higher. The business still consumes cash for new lines, compliance upgrades, and cold-chain, but momentum is clear. Continued investment should secure leadership and scale.
Global ARV portfolio
Global ARV portfolio is a Star: strong share in donor and emerging markets with treatment volumes rising alongside ~30 million people on ART globally (UNAIDS 2023), driving sustained demand. Manufacturing depth in key APIs underpins cost competitiveness and supply reliability. Tender-driven cycles cause working capital swings, but scale and growth win share. Continued investment needed to defend positions and secure multi-year awards.

Complex oral solids (CNS/cardiometabolic)
High-bar complex oral solids in CNS/cardiometabolic areas face fewer competitors, yielding share gains and stickier prescriptions; NCDs already account for 74% of global deaths (WHO) and cardiometabolic disease burden is rising. Market growth is healthy, underpinned by diabetes projections toward ~783 million by 2045 (IDF). Continued R&D and tech transfers are required, while funded line extensions and differentiated strengths will cement Aurobindo’s lead.

Europe hospital generics
Europe hospital generics: institutional channels are expanding and Aurobindo’s wide footprint across EU tender markets and hospital supply chains positions it as a Stars asset in the BCG matrix.
Backward integration into APIs and in-house formulations secures cost and supply continuity, crucial where bids are tight and margin pressure is high.
Scale, reliability, and breadth convert tenders into share gains; continue investing in capacity, QA systems, and portfolio depth to outpace peers.
- Position: Stars — strong market share in high-growth EU hospital generics
- Advantages: wide footprint; backward integration; tender-winning reliability
- Priority: expand capacity, augment QA, widen hospital-focused portfolio
Integrated API + finished dose engines
Owning key antibiotics APIs and finished-dose capacity gives Aurobindo a cost and supply-edge that scales margins as demand rises, making this a BCG Stars segment. It is capex-heavy and QA-intensive but remained strategically valuable through 2024 supply-chain tightness and higher margin capture. Double down where vertical integration secures defensible price-to-value and market share.
- Integration: lowers COGS, improves reliability
- Capex/QA: high upfront, ongoing regulatory spend
- Strategy: invest where integration yields pricing power
ARVs (~30M on ART), sterile injectables&EU hospital generics: 2024 growth
US sterile injectables, ARVs, complex oral solids and EU hospital generics are Stars: rising 2024 hospital demand, ~30M on ART (UNAIDS 2023), NCDs 74% of deaths (WHO) and diabetes ~783M by 2045 (IDF) underpin growth; capex/QA-intensive but scale, backward integration and tender wins secure share.
| Segment | 2024 driver | Key metric |
|---|---|---|
| US sterile | hospital demand, capacity add | utilization↑ 2024 |
| ARV | donor/tender volumes | ~30M on ART |
| CNS/cardiometabolic | NCD growth | 74% deaths |
What is included in the product
 Detailed Word Document
Comprehensive BCG analysis of Aurobindo Pharma’s portfolio, identifying Stars, Cash Cows, Question Marks and Dogs with strategic moves.

 Customizable Excel Spreadsheet
Clean, distraction-free BCG Matrix for Aurobindo Pharma — spot portfolio pain points and speed C-level decisions.
Cash Cows

US oral solids (mature molecules)
Large base and steady volumes from US oral solids, supported by efficient Indian and global plants, throw off significant cash. Growth is flat but market share is entrenched with broad customer coverage and low promo needs—performance hinges on service levels and cost. Focus on milking cash while optimizing SKU mix and automation. US oral solids accounted for roughly 40% of Aurobindo’s FY2024 revenue, underpinning operating cashflow.
Beta‑lactam APIs (penicillins/cephalosporins)
Decades of know‑how, scale and regulatory compliance in beta‑lactam APIs (penicillins/cephalosporins) sustain durable margins and low unit costs while serving over 150 countries. Global demand remains steady among generic buyers, keeping utilization high. Current capex focuses on upkeep and incremental debottlenecking rather than greenfield expansion. Cash generation is routed to a complex injectables/generics pipeline and ongoing debt service.

Cardiovascular generics (stable markets)
Cardiovascular generics deliver high-repeat chronic scripts and predictable demand across a broad label set, forming a stable annuity for Aurobindo Pharma.
Persistent price pressure is offset by manufacturing scale and low marketing lift, keeping margins resilient when coupled with strict cost leadership.
Maintaining supply reliability and production efficiency is critical to preserve market share and the steady revenue stream from these stable markets.

Gastro and diabetes staples
Gastro and diabetes staples are high-volume, well-understood Aurobindo generics with consistent reorder rates and low market growth but minimal volatility, making them reliable cash generators for working-capital planning.
- Yield focus
- Downtime reduction
- Packaging efficiency
- Harvest savings -> redeploy to growth bets
Established EM distribution channels
Established EM distribution channels deliver wide market access with repeat buyers; EM markets accounted for about 35% of Aurobindo Pharma’s revenue in 2024, supporting a lean go-to-market and predictable volumes. Working capital remains manageable with disciplined credit terms and DSO near 50 days; not hyper-growth, yet cash efficient—operating cash flow was roughly INR 3,200 crore in 2024. Keep service high and avoid heavy new spend to preserve cash conversion and margins.
- EM share ~35% (2024)
- DSO ~50 days
- Op. cash flow ≈ INR 3,200 crore (2024)
- High repeat buyers, low incremental GTM spend
Cut downtime, boost margins, redeploy to injectables - Op cashINR 3,200 cr
US oral solids (~40% of FY2024 revenue) and beta‑lactam APIs drive steady cashflow with low promo needs; cardiometabolic and GI generics add predictable annuity. EM channels (~35% of revenue) and DSO ~50 days keep working capital efficient; Op. cash flow ≈ INR 3,200 crore (2024). Focus: milk margins, cut downtime, redeploy harvest to high‑value injectables.
| Metric | 2024 |
|---|---|
| US oral solids | ~40% rev |
| EM share | ~35% rev |
| DSO | ~50 days |
| Op. cash flow | ≈ INR 3,200 crore |
Delivered as Shown
Aurobindo Pharma BCG Matrix
The file you're previewing is the final Aurobindo Pharma BCG Matrix you'll receive after purchase — no watermarks, no demo placeholders, just the polished report. It maps product positions and growth potential with clear visuals and data-driven insights. The download you get is fully editable and presentation-ready. Buy once, use immediately for strategy, decks, or stakeholder review.

Actionable Strategy Starts Here
Want a quick, clear read on Aurobindo Pharma’s product portfolio? Our BCG Matrix preview shows which lines are scaling and which are bleeding cash—real signals, no fluff. Purchase the full BCG Matrix for quadrant-by-quadrant placement, data-backed recommendations, and ready-to-use Word and Excel deliverables to act on immediately.
Stars
US sterile injectables
US sterile injectables are a Star for Aurobindo: 2024 hospital demand is rising and the company’s expanding sterile capacity gives it real heft. High utilization, frequent launches, and sticky supply contracts have steadily pushed market share higher. The business still consumes cash for new lines, compliance upgrades, and cold-chain, but momentum is clear. Continued investment should secure leadership and scale.
Global ARV portfolio
Global ARV portfolio is a Star: strong share in donor and emerging markets with treatment volumes rising alongside ~30 million people on ART globally (UNAIDS 2023), driving sustained demand. Manufacturing depth in key APIs underpins cost competitiveness and supply reliability. Tender-driven cycles cause working capital swings, but scale and growth win share. Continued investment needed to defend positions and secure multi-year awards.
Complex oral solids (CNS/cardiometabolic)
High-bar complex oral solids in CNS/cardiometabolic areas face fewer competitors, yielding share gains and stickier prescriptions; NCDs already account for 74% of global deaths (WHO) and cardiometabolic disease burden is rising. Market growth is healthy, underpinned by diabetes projections toward ~783 million by 2045 (IDF). Continued R&D and tech transfers are required, while funded line extensions and differentiated strengths will cement Aurobindo’s lead.
Europe hospital generics
Europe hospital generics: institutional channels are expanding and Aurobindo’s wide footprint across EU tender markets and hospital supply chains positions it as a Stars asset in the BCG matrix.
Backward integration into APIs and in-house formulations secures cost and supply continuity, crucial where bids are tight and margin pressure is high.
Scale, reliability, and breadth convert tenders into share gains; continue investing in capacity, QA systems, and portfolio depth to outpace peers.
- Position: Stars — strong market share in high-growth EU hospital generics
- Advantages: wide footprint; backward integration; tender-winning reliability
- Priority: expand capacity, augment QA, widen hospital-focused portfolio
Integrated API + finished dose engines
Owning key antibiotics APIs and finished-dose capacity gives Aurobindo a cost and supply-edge that scales margins as demand rises, making this a BCG Stars segment. It is capex-heavy and QA-intensive but remained strategically valuable through 2024 supply-chain tightness and higher margin capture. Double down where vertical integration secures defensible price-to-value and market share.
- Integration: lowers COGS, improves reliability
- Capex/QA: high upfront, ongoing regulatory spend
- Strategy: invest where integration yields pricing power
ARVs (~30M on ART), sterile injectables&EU hospital generics: 2024 growth
US sterile injectables, ARVs, complex oral solids and EU hospital generics are Stars: rising 2024 hospital demand, ~30M on ART (UNAIDS 2023), NCDs 74% of deaths (WHO) and diabetes ~783M by 2045 (IDF) underpin growth; capex/QA-intensive but scale, backward integration and tender wins secure share.
| Segment | 2024 driver | Key metric |
|---|---|---|
| US sterile | hospital demand, capacity add | utilization↑ 2024 |
| ARV | donor/tender volumes | ~30M on ART |
| CNS/cardiometabolic | NCD growth | 74% deaths |
What is included in the product
Detailed Word Document
Comprehensive BCG analysis of Aurobindo Pharma’s portfolio, identifying Stars, Cash Cows, Question Marks and Dogs with strategic moves.
Customizable Excel Spreadsheet
Clean, distraction-free BCG Matrix for Aurobindo Pharma — spot portfolio pain points and speed C-level decisions.
Cash Cows
US oral solids (mature molecules)
Large base and steady volumes from US oral solids, supported by efficient Indian and global plants, throw off significant cash. Growth is flat but market share is entrenched with broad customer coverage and low promo needs—performance hinges on service levels and cost. Focus on milking cash while optimizing SKU mix and automation. US oral solids accounted for roughly 40% of Aurobindo’s FY2024 revenue, underpinning operating cashflow.
Beta‑lactam APIs (penicillins/cephalosporins)
Decades of know‑how, scale and regulatory compliance in beta‑lactam APIs (penicillins/cephalosporins) sustain durable margins and low unit costs while serving over 150 countries. Global demand remains steady among generic buyers, keeping utilization high. Current capex focuses on upkeep and incremental debottlenecking rather than greenfield expansion. Cash generation is routed to a complex injectables/generics pipeline and ongoing debt service.
Cardiovascular generics (stable markets)
Cardiovascular generics deliver high-repeat chronic scripts and predictable demand across a broad label set, forming a stable annuity for Aurobindo Pharma.
Persistent price pressure is offset by manufacturing scale and low marketing lift, keeping margins resilient when coupled with strict cost leadership.
Maintaining supply reliability and production efficiency is critical to preserve market share and the steady revenue stream from these stable markets.
Gastro and diabetes staples
Gastro and diabetes staples are high-volume, well-understood Aurobindo generics with consistent reorder rates and low market growth but minimal volatility, making them reliable cash generators for working-capital planning.
- Yield focus
- Downtime reduction
- Packaging efficiency
- Harvest savings -> redeploy to growth bets
Established EM distribution channels
Established EM distribution channels deliver wide market access with repeat buyers; EM markets accounted for about 35% of Aurobindo Pharma’s revenue in 2024, supporting a lean go-to-market and predictable volumes. Working capital remains manageable with disciplined credit terms and DSO near 50 days; not hyper-growth, yet cash efficient—operating cash flow was roughly INR 3,200 crore in 2024. Keep service high and avoid heavy new spend to preserve cash conversion and margins.
- EM share ~35% (2024)
- DSO ~50 days
- Op. cash flow ≈ INR 3,200 crore (2024)
- High repeat buyers, low incremental GTM spend
Cut downtime, boost margins, redeploy to injectables - Op cashINR 3,200 cr
US oral solids (~40% of FY2024 revenue) and beta‑lactam APIs drive steady cashflow with low promo needs; cardiometabolic and GI generics add predictable annuity. EM channels (~35% of revenue) and DSO ~50 days keep working capital efficient; Op. cash flow ≈ INR 3,200 crore (2024). Focus: milk margins, cut downtime, redeploy harvest to high‑value injectables.
| Metric | 2024 |
|---|---|
| US oral solids | ~40% rev |
| EM share | ~35% rev |
| DSO | ~50 days |
| Op. cash flow | ≈ INR 3,200 crore |
Delivered as Shown
Aurobindo Pharma BCG Matrix
The file you're previewing is the final Aurobindo Pharma BCG Matrix you'll receive after purchase — no watermarks, no demo placeholders, just the polished report. It maps product positions and growth potential with clear visuals and data-driven insights. The download you get is fully editable and presentation-ready. Buy once, use immediately for strategy, decks, or stakeholder review.
Original: $10.00
-65%$10.00
$3.50Description
Actionable Strategy Starts Here
Want a quick, clear read on Aurobindo Pharma’s product portfolio? Our BCG Matrix preview shows which lines are scaling and which are bleeding cash—real signals, no fluff. Purchase the full BCG Matrix for quadrant-by-quadrant placement, data-backed recommendations, and ready-to-use Word and Excel deliverables to act on immediately.
Stars
US sterile injectables
US sterile injectables are a Star for Aurobindo: 2024 hospital demand is rising and the company’s expanding sterile capacity gives it real heft. High utilization, frequent launches, and sticky supply contracts have steadily pushed market share higher. The business still consumes cash for new lines, compliance upgrades, and cold-chain, but momentum is clear. Continued investment should secure leadership and scale.
Global ARV portfolio
Global ARV portfolio is a Star: strong share in donor and emerging markets with treatment volumes rising alongside ~30 million people on ART globally (UNAIDS 2023), driving sustained demand. Manufacturing depth in key APIs underpins cost competitiveness and supply reliability. Tender-driven cycles cause working capital swings, but scale and growth win share. Continued investment needed to defend positions and secure multi-year awards.
Complex oral solids (CNS/cardiometabolic)
High-bar complex oral solids in CNS/cardiometabolic areas face fewer competitors, yielding share gains and stickier prescriptions; NCDs already account for 74% of global deaths (WHO) and cardiometabolic disease burden is rising. Market growth is healthy, underpinned by diabetes projections toward ~783 million by 2045 (IDF). Continued R&D and tech transfers are required, while funded line extensions and differentiated strengths will cement Aurobindo’s lead.
Europe hospital generics
Europe hospital generics: institutional channels are expanding and Aurobindo’s wide footprint across EU tender markets and hospital supply chains positions it as a Stars asset in the BCG matrix.
Backward integration into APIs and in-house formulations secures cost and supply continuity, crucial where bids are tight and margin pressure is high.
Scale, reliability, and breadth convert tenders into share gains; continue investing in capacity, QA systems, and portfolio depth to outpace peers.
- Position: Stars — strong market share in high-growth EU hospital generics
- Advantages: wide footprint; backward integration; tender-winning reliability
- Priority: expand capacity, augment QA, widen hospital-focused portfolio
Integrated API + finished dose engines
Owning key antibiotics APIs and finished-dose capacity gives Aurobindo a cost and supply-edge that scales margins as demand rises, making this a BCG Stars segment. It is capex-heavy and QA-intensive but remained strategically valuable through 2024 supply-chain tightness and higher margin capture. Double down where vertical integration secures defensible price-to-value and market share.
- Integration: lowers COGS, improves reliability
- Capex/QA: high upfront, ongoing regulatory spend
- Strategy: invest where integration yields pricing power
ARVs (~30M on ART), sterile injectables&EU hospital generics: 2024 growth
US sterile injectables, ARVs, complex oral solids and EU hospital generics are Stars: rising 2024 hospital demand, ~30M on ART (UNAIDS 2023), NCDs 74% of deaths (WHO) and diabetes ~783M by 2045 (IDF) underpin growth; capex/QA-intensive but scale, backward integration and tender wins secure share.
| Segment | 2024 driver | Key metric |
|---|---|---|
| US sterile | hospital demand, capacity add | utilization↑ 2024 |
| ARV | donor/tender volumes | ~30M on ART |
| CNS/cardiometabolic | NCD growth | 74% deaths |
What is included in the product
Detailed Word Document
Comprehensive BCG analysis of Aurobindo Pharma’s portfolio, identifying Stars, Cash Cows, Question Marks and Dogs with strategic moves.
Customizable Excel Spreadsheet
Clean, distraction-free BCG Matrix for Aurobindo Pharma — spot portfolio pain points and speed C-level decisions.
Cash Cows
US oral solids (mature molecules)
Large base and steady volumes from US oral solids, supported by efficient Indian and global plants, throw off significant cash. Growth is flat but market share is entrenched with broad customer coverage and low promo needs—performance hinges on service levels and cost. Focus on milking cash while optimizing SKU mix and automation. US oral solids accounted for roughly 40% of Aurobindo’s FY2024 revenue, underpinning operating cashflow.
Beta‑lactam APIs (penicillins/cephalosporins)
Decades of know‑how, scale and regulatory compliance in beta‑lactam APIs (penicillins/cephalosporins) sustain durable margins and low unit costs while serving over 150 countries. Global demand remains steady among generic buyers, keeping utilization high. Current capex focuses on upkeep and incremental debottlenecking rather than greenfield expansion. Cash generation is routed to a complex injectables/generics pipeline and ongoing debt service.
Cardiovascular generics (stable markets)
Cardiovascular generics deliver high-repeat chronic scripts and predictable demand across a broad label set, forming a stable annuity for Aurobindo Pharma.
Persistent price pressure is offset by manufacturing scale and low marketing lift, keeping margins resilient when coupled with strict cost leadership.
Maintaining supply reliability and production efficiency is critical to preserve market share and the steady revenue stream from these stable markets.
Gastro and diabetes staples
Gastro and diabetes staples are high-volume, well-understood Aurobindo generics with consistent reorder rates and low market growth but minimal volatility, making them reliable cash generators for working-capital planning.
- Yield focus
- Downtime reduction
- Packaging efficiency
- Harvest savings -> redeploy to growth bets
Established EM distribution channels
Established EM distribution channels deliver wide market access with repeat buyers; EM markets accounted for about 35% of Aurobindo Pharma’s revenue in 2024, supporting a lean go-to-market and predictable volumes. Working capital remains manageable with disciplined credit terms and DSO near 50 days; not hyper-growth, yet cash efficient—operating cash flow was roughly INR 3,200 crore in 2024. Keep service high and avoid heavy new spend to preserve cash conversion and margins.
- EM share ~35% (2024)
- DSO ~50 days
- Op. cash flow ≈ INR 3,200 crore (2024)
- High repeat buyers, low incremental GTM spend
Cut downtime, boost margins, redeploy to injectables - Op cashINR 3,200 cr
US oral solids (~40% of FY2024 revenue) and beta‑lactam APIs drive steady cashflow with low promo needs; cardiometabolic and GI generics add predictable annuity. EM channels (~35% of revenue) and DSO ~50 days keep working capital efficient; Op. cash flow ≈ INR 3,200 crore (2024). Focus: milk margins, cut downtime, redeploy harvest to high‑value injectables.
| Metric | 2024 |
|---|---|
| US oral solids | ~40% rev |
| EM share | ~35% rev |
| DSO | ~50 days |
| Op. cash flow | ≈ INR 3,200 crore |
Delivered as Shown
Aurobindo Pharma BCG Matrix
The file you're previewing is the final Aurobindo Pharma BCG Matrix you'll receive after purchase — no watermarks, no demo placeholders, just the polished report. It maps product positions and growth potential with clear visuals and data-driven insights. The download you get is fully editable and presentation-ready. Buy once, use immediately for strategy, decks, or stakeholder review.











