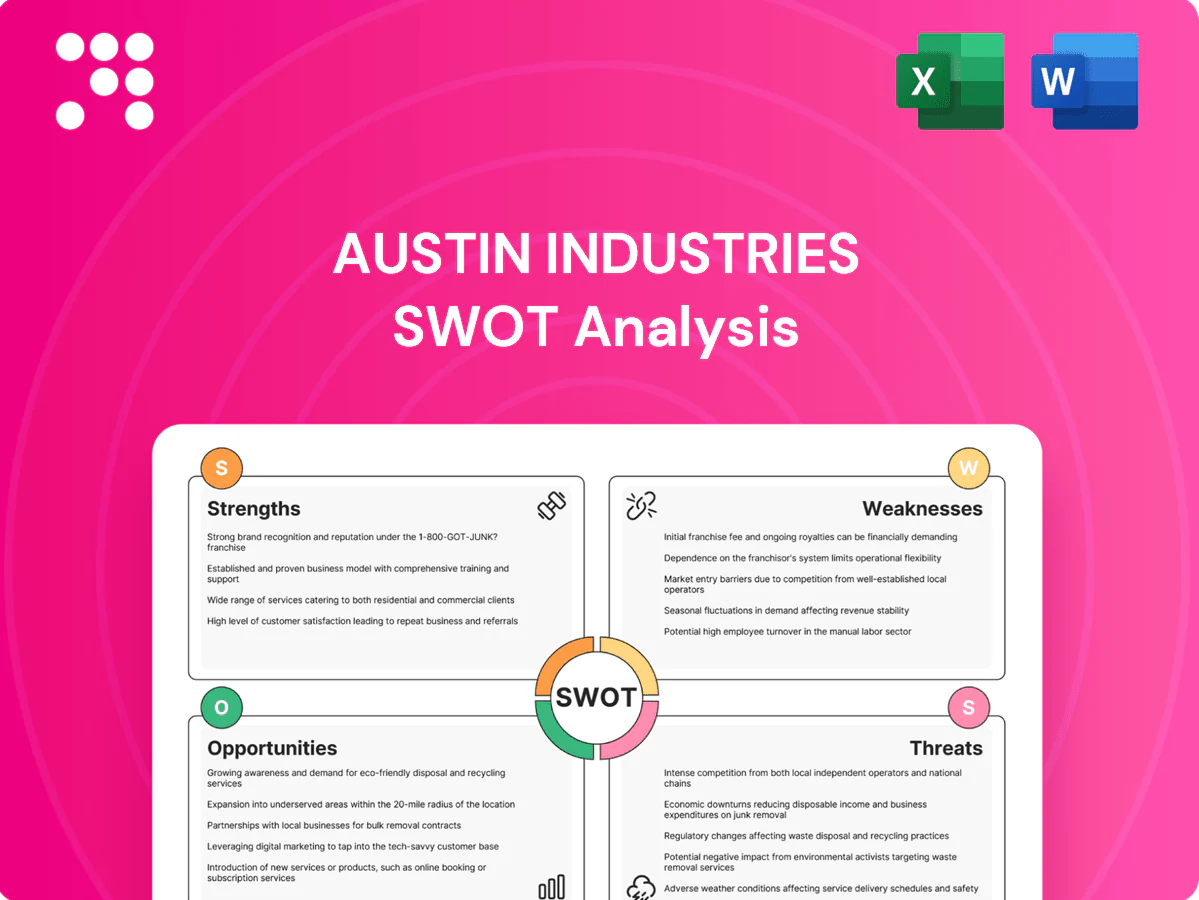
Austin Industries SWOT Analysis

Go Beyond the Preview—Access the Full Strategic Report
Austin Industries' SWOT snapshot highlights its project scale, diversified services, and regional market strength alongside margin pressure, labor risks, and cyclical exposure. Our full SWOT unpacks competitive advantages, regulatory and contract risks, and concrete growth levers with financial context. Purchase the complete, editable report (Word + Excel) to support strategy, bids, or investment decisions with research-backed insights.
Strengths

Diversified service portfolio
Operating across four service lines — civil, commercial, industrial and infrastructure — spreads risk and smooths backlog across project cycles. This breadth enables cross-selling of construction management, design-build and general contracting services, enhancing average project capture. Serving four sectors (transportation, water, energy, buildings) supports revenue stability through downturns and bolsters bid credibility and execution flexibility.
Employee ownership culture
Employee ownership aligns incentives with safety, quality and client satisfaction, driving frontline accountability on projects. In a tight labor market it aids retention of craft and management talent—about 6,500 US ESOP companies were operating in 2024, reflecting growing uptake. The ownership mindset can lift productivity and project outcomes and reinforces a reputation for reliability with repeat clients.

Safety and quality leadership
Austin Industries strong safety record cuts incidents, insurance costs and schedule disruptions, aligning with construction sector norms where the Bureau of Labor Statistics reported construction accounted for roughly 20% of workplace fatalities in 2023; keeping TRIR near or below the industry average (about 2.8) materially reduces downtime. Robust quality systems lower rework and improve margins on thin-bid projects. Proven safety performance is prized by regulated clients and serves as a differentiator in best-value and design-build selections.

Design-build and CM expertise
Austin Industries' design-build and CM expertise accelerates schedules and de-risks owner interfaces via integrated delivery; DBIA reported design-build accounted for about 46% of U.S. nonresidential construction in 2022, underscoring market traction. Early contractor involvement enhances constructability and cost control, raises win rates on complex, schedule-driven work, and supports entry into alternative delivery and P3 pipelines.
- Integrated delivery: faster schedules, fewer interface risks
- Early involvement: improved constructability and cost control
- Competitive edge: higher win rates on schedule-driven projects; aligns with growing design-build/P3 demand
Merit shop flexibility
Merit shop model enables competitive staffing and performance-based pay, driving higher site productivity and accountability. It lowers labor costs and accelerates regional deployment, allowing rapid scaling to meet peak demand without long-term fixed commitments. Associated Builders and Contractors reports merit-shop firms perform the majority of U.S. nonunion construction, a structure many cost-conscious owners prefer.
- Competitive staffing
- Performance pay
- Flexible scaling
Diversified civil-to-infrastructure platform, $1.8B 2024 revenue, ESOP
Broad four-line platform (civil, commercial, industrial, infrastructure) diversifies revenue; 2024 revenue ~1.8B across segments. Employee-owned ESOP model (peer: ~6,500 US ESOP firms in 2024) boosts retention and alignment. Strong safety (TRIR ~2.5 vs industry 2.8) and design-build expertise (46% market share) improve margins and win rates.
| Metric | Value | Year |
|---|---|---|
| Revenue | $1.8B | 2024 |
| TRIR | ~2.5 | 2024 |
| Design-build share | 46% | 2022 |
What is included in the product
 Detailed Word Document
Provides a concise SWOT analysis of Austin Industries’s internal strengths and weaknesses and the external opportunities and threats shaping its construction and infrastructure services, competitive position, and growth prospects.

 Customizable Excel Spreadsheet
Provides a concise, visual SWOT matrix tailored to Austin Industries for rapid strategic alignment and stakeholder briefings; editable format enables quick updates to reflect project-driven priorities and streamlines cross-unit communication.
Weaknesses

Exposure to cyclical end-markets
Exposure to cyclical end-markets leaves Austin Industries vulnerable as construction demand tracks public budgets and private capex; U.S. construction put in place was about $1.8 trillion in 2024 (U.S. Census Bureau), highlighting large swings. Slowdowns in commercial and industrial starts can compress backlog and squeeze margins. Timing gaps between awards and notice-to-proceed often run 3–6 months, straining utilization. Earnings volatility has followed macro downturns in recent cycles.
Thin margins and cost overrun risk
Low-bid environments leave Austin Industries with margins often under 5%, so material inflation or a 1–3% productivity slip can erase profit on fixed-price work. Recent industry trends show material-cost volatility remains elevated, and disputes or change-order recovery commonly tie up cash for 30–120 days. That makes tight risk management and contract discipline essential to protect returns.

Skilled labor availability
Craft shortages have left 82% of contractors struggling to hire (Associated General Contractors, 2024), pushing craft wages up over 5% YoY and constraining Austin Industries’ self-perform capacity. Training new hires raises near-term costs and elevates safety incidents. Intense competition for superintendents and project managers increases turnover, forcing more subcontracting and reducing control.

Geographic and client concentration
Overweight exposure to specific regions and repeat owners clusters risk for Austin Industries, so local downturns or funding delays can quickly ripple through quarterly revenue and backlog. Dependence on a handful of large projects increases earnings variance and cash-flow sensitivity, while geographic diversification requires time and upfront preconstruction investment to rebuild a broader bid pipeline.
- Concentrated regions raise regional downturn risk
- Repeat-owner reliance amplifies funding-delay impact
- Few large projects heighten revenue volatility
- Diversification needs time and preconstruction capital
Working capital and bonding constraints
Large jobs demand substantial bonding and upfront cash for mobilization; industry retainage averages 5–10% and payment lags commonly run 45–90 days, pressuring Austin Industries’ liquidity. Rapid revenue growth can exceed surety capacity—single-project bonding often constrained by sureties to a multiple of net worth—limiting pursuit of $100M+ mega-projects without joint ventures.
- Retainage: 5–10%
- Payment lag: 45–90 days
- Mega-projects: $100M+ often need partner(s)
Construction risk: $1.8T, margins 5%, 45-90d liquidity
Exposure to cyclical markets (US construction put-in-place ~$1.8T in 2024) plus 3–6 month award-to-NTP gaps drives backlog and earnings volatility. Low-bid margins often <5% so 1–3% productivity loss or material inflation erodes profits; retainage 5–10% and payment lags 45–90 days strain liquidity. Craft shortages (82% of contractors, AGC 2024) and >5% YoY wage inflation limit self-perform capacity.
| Metric | Value |
|---|---|
| US construction (2024) | $1.8T |
| Typical margin | <5% |
| Retainage | 5–10% |
| Payment lag | 45–90 days |
| Craft hiring stress (AGC) | 82% |
Full Version Awaits
Austin Industries SWOT Analysis
This is the actual SWOT analysis document you’ll receive upon purchase—no surprises, just professional quality. The preview below is taken directly from the full SWOT report you'll get, and the complete, editable version is available after checkout. Purchase unlocks the entire in-depth file for immediate download.

Go Beyond the Preview—Access the Full Strategic Report
Austin Industries' SWOT snapshot highlights its project scale, diversified services, and regional market strength alongside margin pressure, labor risks, and cyclical exposure. Our full SWOT unpacks competitive advantages, regulatory and contract risks, and concrete growth levers with financial context. Purchase the complete, editable report (Word + Excel) to support strategy, bids, or investment decisions with research-backed insights.
Strengths
Diversified service portfolio
Operating across four service lines — civil, commercial, industrial and infrastructure — spreads risk and smooths backlog across project cycles. This breadth enables cross-selling of construction management, design-build and general contracting services, enhancing average project capture. Serving four sectors (transportation, water, energy, buildings) supports revenue stability through downturns and bolsters bid credibility and execution flexibility.
Employee ownership culture
Employee ownership aligns incentives with safety, quality and client satisfaction, driving frontline accountability on projects. In a tight labor market it aids retention of craft and management talent—about 6,500 US ESOP companies were operating in 2024, reflecting growing uptake. The ownership mindset can lift productivity and project outcomes and reinforces a reputation for reliability with repeat clients.
Safety and quality leadership
Austin Industries strong safety record cuts incidents, insurance costs and schedule disruptions, aligning with construction sector norms where the Bureau of Labor Statistics reported construction accounted for roughly 20% of workplace fatalities in 2023; keeping TRIR near or below the industry average (about 2.8) materially reduces downtime. Robust quality systems lower rework and improve margins on thin-bid projects. Proven safety performance is prized by regulated clients and serves as a differentiator in best-value and design-build selections.
Design-build and CM expertise
Austin Industries' design-build and CM expertise accelerates schedules and de-risks owner interfaces via integrated delivery; DBIA reported design-build accounted for about 46% of U.S. nonresidential construction in 2022, underscoring market traction. Early contractor involvement enhances constructability and cost control, raises win rates on complex, schedule-driven work, and supports entry into alternative delivery and P3 pipelines.
- Integrated delivery: faster schedules, fewer interface risks
- Early involvement: improved constructability and cost control
- Competitive edge: higher win rates on schedule-driven projects; aligns with growing design-build/P3 demand
Merit shop flexibility
Merit shop model enables competitive staffing and performance-based pay, driving higher site productivity and accountability. It lowers labor costs and accelerates regional deployment, allowing rapid scaling to meet peak demand without long-term fixed commitments. Associated Builders and Contractors reports merit-shop firms perform the majority of U.S. nonunion construction, a structure many cost-conscious owners prefer.
- Competitive staffing
- Performance pay
- Flexible scaling
Diversified civil-to-infrastructure platform, $1.8B 2024 revenue, ESOP
Broad four-line platform (civil, commercial, industrial, infrastructure) diversifies revenue; 2024 revenue ~1.8B across segments. Employee-owned ESOP model (peer: ~6,500 US ESOP firms in 2024) boosts retention and alignment. Strong safety (TRIR ~2.5 vs industry 2.8) and design-build expertise (46% market share) improve margins and win rates.
| Metric | Value | Year |
|---|---|---|
| Revenue | $1.8B | 2024 |
| TRIR | ~2.5 | 2024 |
| Design-build share | 46% | 2022 |
What is included in the product
Detailed Word Document
Provides a concise SWOT analysis of Austin Industries’s internal strengths and weaknesses and the external opportunities and threats shaping its construction and infrastructure services, competitive position, and growth prospects.
Customizable Excel Spreadsheet
Provides a concise, visual SWOT matrix tailored to Austin Industries for rapid strategic alignment and stakeholder briefings; editable format enables quick updates to reflect project-driven priorities and streamlines cross-unit communication.
Weaknesses
Exposure to cyclical end-markets
Exposure to cyclical end-markets leaves Austin Industries vulnerable as construction demand tracks public budgets and private capex; U.S. construction put in place was about $1.8 trillion in 2024 (U.S. Census Bureau), highlighting large swings. Slowdowns in commercial and industrial starts can compress backlog and squeeze margins. Timing gaps between awards and notice-to-proceed often run 3–6 months, straining utilization. Earnings volatility has followed macro downturns in recent cycles.
Thin margins and cost overrun risk
Low-bid environments leave Austin Industries with margins often under 5%, so material inflation or a 1–3% productivity slip can erase profit on fixed-price work. Recent industry trends show material-cost volatility remains elevated, and disputes or change-order recovery commonly tie up cash for 30–120 days. That makes tight risk management and contract discipline essential to protect returns.
Skilled labor availability
Craft shortages have left 82% of contractors struggling to hire (Associated General Contractors, 2024), pushing craft wages up over 5% YoY and constraining Austin Industries’ self-perform capacity. Training new hires raises near-term costs and elevates safety incidents. Intense competition for superintendents and project managers increases turnover, forcing more subcontracting and reducing control.
Geographic and client concentration
Overweight exposure to specific regions and repeat owners clusters risk for Austin Industries, so local downturns or funding delays can quickly ripple through quarterly revenue and backlog. Dependence on a handful of large projects increases earnings variance and cash-flow sensitivity, while geographic diversification requires time and upfront preconstruction investment to rebuild a broader bid pipeline.
- Concentrated regions raise regional downturn risk
- Repeat-owner reliance amplifies funding-delay impact
- Few large projects heighten revenue volatility
- Diversification needs time and preconstruction capital
Working capital and bonding constraints
Large jobs demand substantial bonding and upfront cash for mobilization; industry retainage averages 5–10% and payment lags commonly run 45–90 days, pressuring Austin Industries’ liquidity. Rapid revenue growth can exceed surety capacity—single-project bonding often constrained by sureties to a multiple of net worth—limiting pursuit of $100M+ mega-projects without joint ventures.
- Retainage: 5–10%
- Payment lag: 45–90 days
- Mega-projects: $100M+ often need partner(s)
Construction risk: $1.8T, margins 5%, 45-90d liquidity
Exposure to cyclical markets (US construction put-in-place ~$1.8T in 2024) plus 3–6 month award-to-NTP gaps drives backlog and earnings volatility. Low-bid margins often <5% so 1–3% productivity loss or material inflation erodes profits; retainage 5–10% and payment lags 45–90 days strain liquidity. Craft shortages (82% of contractors, AGC 2024) and >5% YoY wage inflation limit self-perform capacity.
| Metric | Value |
|---|---|
| US construction (2024) | $1.8T |
| Typical margin | <5% |
| Retainage | 5–10% |
| Payment lag | 45–90 days |
| Craft hiring stress (AGC) | 82% |
Full Version Awaits
Austin Industries SWOT Analysis
This is the actual SWOT analysis document you’ll receive upon purchase—no surprises, just professional quality. The preview below is taken directly from the full SWOT report you'll get, and the complete, editable version is available after checkout. Purchase unlocks the entire in-depth file for immediate download.
Description
Go Beyond the Preview—Access the Full Strategic Report
Austin Industries' SWOT snapshot highlights its project scale, diversified services, and regional market strength alongside margin pressure, labor risks, and cyclical exposure. Our full SWOT unpacks competitive advantages, regulatory and contract risks, and concrete growth levers with financial context. Purchase the complete, editable report (Word + Excel) to support strategy, bids, or investment decisions with research-backed insights.
Strengths
Diversified service portfolio
Operating across four service lines — civil, commercial, industrial and infrastructure — spreads risk and smooths backlog across project cycles. This breadth enables cross-selling of construction management, design-build and general contracting services, enhancing average project capture. Serving four sectors (transportation, water, energy, buildings) supports revenue stability through downturns and bolsters bid credibility and execution flexibility.
Employee ownership culture
Employee ownership aligns incentives with safety, quality and client satisfaction, driving frontline accountability on projects. In a tight labor market it aids retention of craft and management talent—about 6,500 US ESOP companies were operating in 2024, reflecting growing uptake. The ownership mindset can lift productivity and project outcomes and reinforces a reputation for reliability with repeat clients.
Safety and quality leadership
Austin Industries strong safety record cuts incidents, insurance costs and schedule disruptions, aligning with construction sector norms where the Bureau of Labor Statistics reported construction accounted for roughly 20% of workplace fatalities in 2023; keeping TRIR near or below the industry average (about 2.8) materially reduces downtime. Robust quality systems lower rework and improve margins on thin-bid projects. Proven safety performance is prized by regulated clients and serves as a differentiator in best-value and design-build selections.
Design-build and CM expertise
Austin Industries' design-build and CM expertise accelerates schedules and de-risks owner interfaces via integrated delivery; DBIA reported design-build accounted for about 46% of U.S. nonresidential construction in 2022, underscoring market traction. Early contractor involvement enhances constructability and cost control, raises win rates on complex, schedule-driven work, and supports entry into alternative delivery and P3 pipelines.
- Integrated delivery: faster schedules, fewer interface risks
- Early involvement: improved constructability and cost control
- Competitive edge: higher win rates on schedule-driven projects; aligns with growing design-build/P3 demand
Merit shop flexibility
Merit shop model enables competitive staffing and performance-based pay, driving higher site productivity and accountability. It lowers labor costs and accelerates regional deployment, allowing rapid scaling to meet peak demand without long-term fixed commitments. Associated Builders and Contractors reports merit-shop firms perform the majority of U.S. nonunion construction, a structure many cost-conscious owners prefer.
- Competitive staffing
- Performance pay
- Flexible scaling
Diversified civil-to-infrastructure platform, $1.8B 2024 revenue, ESOP
Broad four-line platform (civil, commercial, industrial, infrastructure) diversifies revenue; 2024 revenue ~1.8B across segments. Employee-owned ESOP model (peer: ~6,500 US ESOP firms in 2024) boosts retention and alignment. Strong safety (TRIR ~2.5 vs industry 2.8) and design-build expertise (46% market share) improve margins and win rates.
| Metric | Value | Year |
|---|---|---|
| Revenue | $1.8B | 2024 |
| TRIR | ~2.5 | 2024 |
| Design-build share | 46% | 2022 |
What is included in the product
Detailed Word Document
Provides a concise SWOT analysis of Austin Industries’s internal strengths and weaknesses and the external opportunities and threats shaping its construction and infrastructure services, competitive position, and growth prospects.
Customizable Excel Spreadsheet
Provides a concise, visual SWOT matrix tailored to Austin Industries for rapid strategic alignment and stakeholder briefings; editable format enables quick updates to reflect project-driven priorities and streamlines cross-unit communication.
Weaknesses
Exposure to cyclical end-markets
Exposure to cyclical end-markets leaves Austin Industries vulnerable as construction demand tracks public budgets and private capex; U.S. construction put in place was about $1.8 trillion in 2024 (U.S. Census Bureau), highlighting large swings. Slowdowns in commercial and industrial starts can compress backlog and squeeze margins. Timing gaps between awards and notice-to-proceed often run 3–6 months, straining utilization. Earnings volatility has followed macro downturns in recent cycles.
Thin margins and cost overrun risk
Low-bid environments leave Austin Industries with margins often under 5%, so material inflation or a 1–3% productivity slip can erase profit on fixed-price work. Recent industry trends show material-cost volatility remains elevated, and disputes or change-order recovery commonly tie up cash for 30–120 days. That makes tight risk management and contract discipline essential to protect returns.
Skilled labor availability
Craft shortages have left 82% of contractors struggling to hire (Associated General Contractors, 2024), pushing craft wages up over 5% YoY and constraining Austin Industries’ self-perform capacity. Training new hires raises near-term costs and elevates safety incidents. Intense competition for superintendents and project managers increases turnover, forcing more subcontracting and reducing control.
Geographic and client concentration
Overweight exposure to specific regions and repeat owners clusters risk for Austin Industries, so local downturns or funding delays can quickly ripple through quarterly revenue and backlog. Dependence on a handful of large projects increases earnings variance and cash-flow sensitivity, while geographic diversification requires time and upfront preconstruction investment to rebuild a broader bid pipeline.
- Concentrated regions raise regional downturn risk
- Repeat-owner reliance amplifies funding-delay impact
- Few large projects heighten revenue volatility
- Diversification needs time and preconstruction capital
Working capital and bonding constraints
Large jobs demand substantial bonding and upfront cash for mobilization; industry retainage averages 5–10% and payment lags commonly run 45–90 days, pressuring Austin Industries’ liquidity. Rapid revenue growth can exceed surety capacity—single-project bonding often constrained by sureties to a multiple of net worth—limiting pursuit of $100M+ mega-projects without joint ventures.
- Retainage: 5–10%
- Payment lag: 45–90 days
- Mega-projects: $100M+ often need partner(s)
Construction risk: $1.8T, margins 5%, 45-90d liquidity
Exposure to cyclical markets (US construction put-in-place ~$1.8T in 2024) plus 3–6 month award-to-NTP gaps drives backlog and earnings volatility. Low-bid margins often <5% so 1–3% productivity loss or material inflation erodes profits; retainage 5–10% and payment lags 45–90 days strain liquidity. Craft shortages (82% of contractors, AGC 2024) and >5% YoY wage inflation limit self-perform capacity.
| Metric | Value |
|---|---|
| US construction (2024) | $1.8T |
| Typical margin | <5% |
| Retainage | 5–10% |
| Payment lag | 45–90 days |
| Craft hiring stress (AGC) | 82% |
Full Version Awaits
Austin Industries SWOT Analysis
This is the actual SWOT analysis document you’ll receive upon purchase—no surprises, just professional quality. The preview below is taken directly from the full SWOT report you'll get, and the complete, editable version is available after checkout. Purchase unlocks the entire in-depth file for immediate download.











